
 PDF Download
 PubReader
 Export Citation
 Email the Author
 Share Facebook
 Share Twitter
 Cited by 0 Article
 Metrics (View:1,395)










1. INTRODUCTION
Geomagnetic storms are one of the main sources of disturbance in the Earth’s ionosphere and represent a major challenge for satellite navigation and communication systems. By altering the distribution of total electronic content (TEC), these events can significantly degrade the accuracy of GNSS systems, affect radio links, and disrupt technological infrastructures dependent on the propagation of electromagnetic waves. Understanding the ionospheric response to geomagnetic storms, particularly as a function of latitude, therefore remains one of the major objectives of space weather research. Among recent events, the exceptional geomagnetic storm of May 11, 2024, characterized by a drop in Dst reaching approximately −400 nT, stands out as one of the most intense of the current solar cycle (solar cycle 25). This storm offers an opportunity to analyze the physical mechanisms governing ionospheric disturbances at different latitudes, from the mid-latitudes to the equatorial and low-southern regions. The study of this event is all the more important given that extreme storms remain relatively rare and their spatially differentiated impact is not yet fully understood. Numerous previous studies have shown that the ionospheric response to geomagnetic storms is highly dependent on latitude and the associated dominant processes. At mid-latitudes, negative ionospheric storms are generally attributed to changes in thermospheric composition, particularly the decrease in the O/N2 ratio, induced by disturbed global circulation (Prölss 1995; Buonsanto 1999; Liou et al. 2005). In contrast, at low and equatorial latitudes, TEC variations are primarily controlled by prompt penetration electric fields (PPEFs), neutral winds, and the fountain effect, often leading to intense positive ionospheric storms or rapid alternations of positive and negative phases (Mannucci et al. 2005; Fejer et al. 2008). Recent work on the storm of May 11, 2024, has also highlighted complex and sometimes asymmetrical ionospheric responses between the hemispheres (Aa et al. 2024; Gordiyenko et al. 2025; Jain et al. 2025). In this context, this article aims to comparatively analyze the ionospheric response of the geomagnetic storm of May 11, 2024, using GNSS data from four stations distributed along a latitudinal gradient, including the northern mid-latitudes, the equatorial ionization anomaly (EIA) region, and the low latitudes of the Southern Hemisphere. Using the delta vertical total electron content (ΔVTEC) parameter, this study quantifies the intensity and nature (positive or negative) of ionospheric disturbances and highlights the dominant mechanisms according to latitude. The continuation of this work is organized into four sections. Section 2 presents the data and methods used, including the geomagnetic and ionospheric indices, as well as the methodology for analyzing the ionospheric disturbances. Section 3 is devoted to the presentation and analysis of the ionospheric response observed at different latitudes during the storm of May 11, 2024. Section 4 discusses these results. Finally, section 5 summarizes the main findings of the study.
2. DATA AND METHODOLOGY
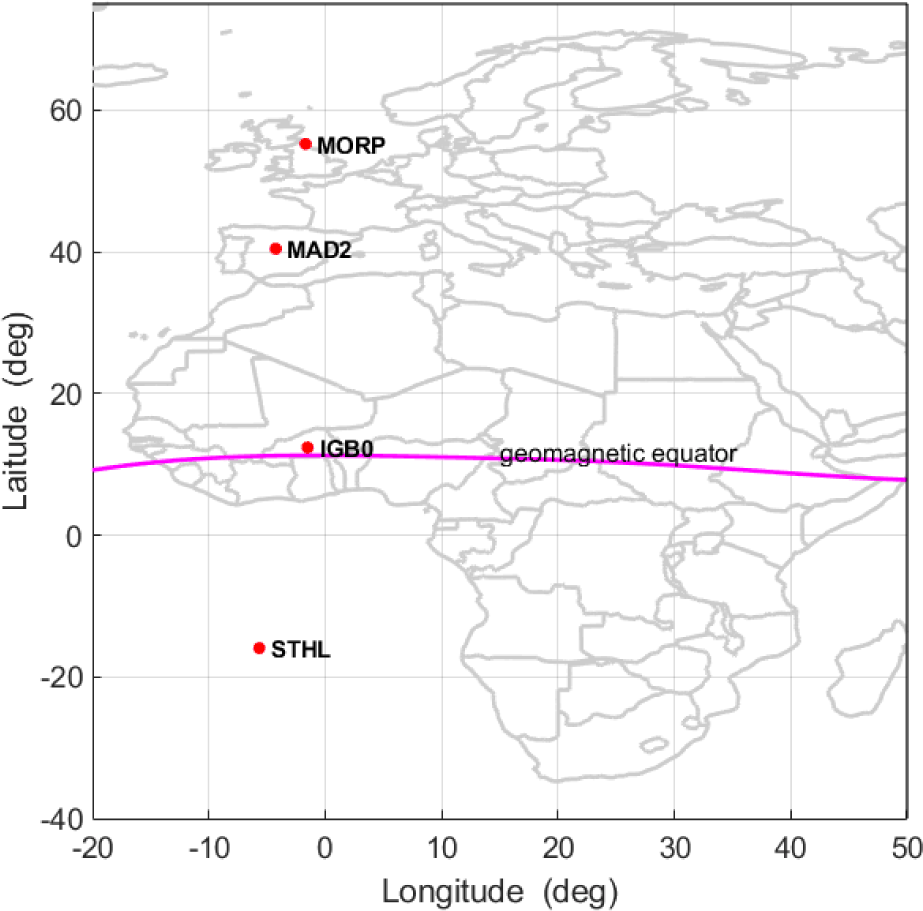
Ionospheric variations were analysed using GNSS obervations from four stations distributed along a latitudinal gradient, from northern mid-latitudes to southern low latitudes. This configuration allows investigation of the latitudinal dependence of storm-time ionospheric processes. The selected stations are MORP (55.21°N), MAD2 (40.43°N), IGB0 (12.37°N) and STHL (15.94°S). This “latitudinal chain” enables comparison of regions dominated by different physical mechanisme: thermospheric composition effects at mid-latitudes and electrodynamic processes at low and equatorial latiudes (Zhang et al. 2016; Cai et al. 2021; Khan et al. 2022). The geographic coodinates and characteritics of the stations are summarized in Table 1 and illustrated in Fig. 1. Raw GNSS data were freely accessed from public databases: UNAVCO (https://www.unavco.org/data/gps-gnss/gps-gnss.html) for the MORP, MAD2, and STHL stations, and BF-CORS (http://www.bfcors.net) for the IGB0 station.
The GNSS data were processed to derive vertical total electron content (VTEC) using ionospheric combinations of dual-frequency signals (L1/L2) (Ouédraogo et al. 2024). A quiet reference VTEC (VTEC_quiet) was constructed from the five quietest days in May. Ionospheric disturbaces were quantified using the relative deviation parameter (ΔVTEC):
Thresholds were used to classify storm intensity: ΔVTEC > +25% indicates a positive storm, ΔVTEC < −25% a negative storm, and |ΔVTEC| < 25% corresponds to undisturbed conditions. The timing of ΔVTEC variations was systematically compared with interplanetary parameters (IMF-Bz and solar wind speed) to distinguish prompt electrodynamic effects from delayed thermospheric responses. Table 2 summarizes these thresholds.
| Thresholds | Storm nature |
|---|---|
| ΔVTEC > +25% | Positive ionospheric storm |
| ΔVTEC < −25% | Negative ionospheric storm |
| |ΔVTEC| < 25% | Undisturbed ionosphere |
Thermospheric composition changes were investigated using global maps of the O/N2 column density ratio obtained from the GUVI intrument onboard the TIMED satellite. The O/N2 ratio is a key parameter controlling ion production efficiency in the F-region. A decrease in O/N2 indicates enhanced molecular nitrogen (N2), leading to increased recombination rates and reduced electron density These data were used to track the spatial and temporal evolution of composition disturbances and to interpret the delayed development of negative ionospheric storms at mi-latitudes. O/N2 ratio were obtained from the Global Ultraviolet Imager (GUVI) onboard the TIMED satellite (https://guvitimed.jhuapl.edu/guvi-galleryl3on2_new).
3. RESULTS AND ANALYSIS
Figs. 2–5 present the variations of Dst, VTEC, and ΔVTEC during the study period (May 8–16, 2024) at the MORP, MAD2, IGB0, and STHL stations, respectively. Each Figs shows, from top to bottom, the profiles of Dst, VSW, IMF-Bz, VTEC, and ΔVTEC. For the VTEC profiles, the blue and red curves represent the evolution of VTEC during quiet (VTEC_quiet) and disturbed periods (VTEC_rec), respectively.
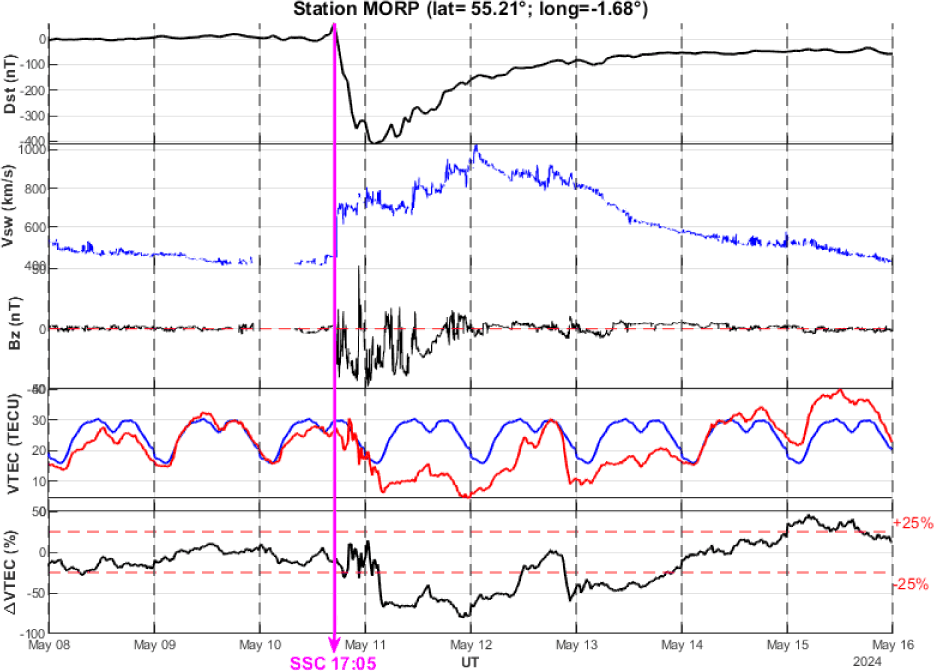
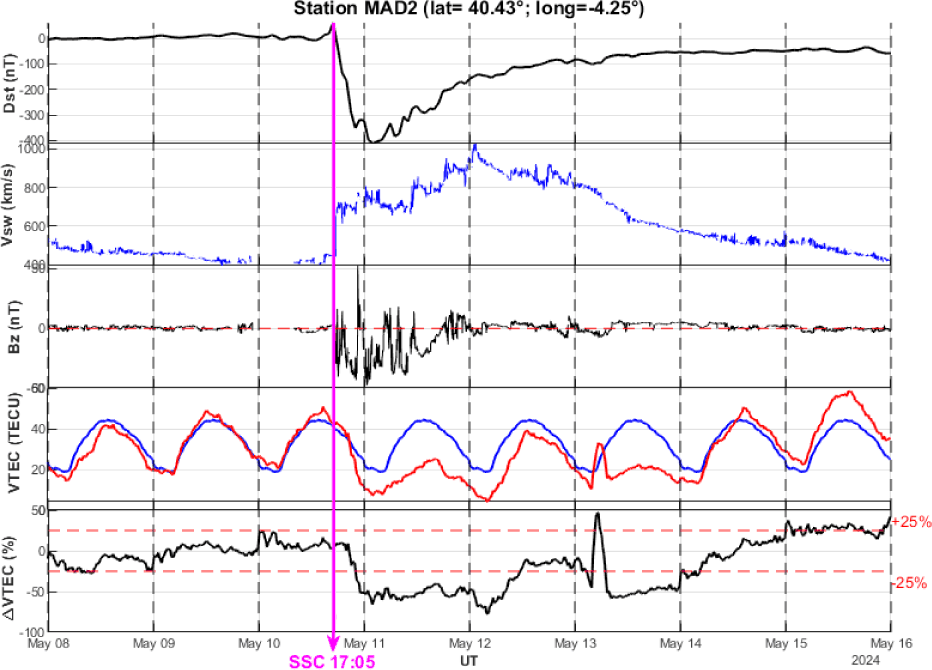
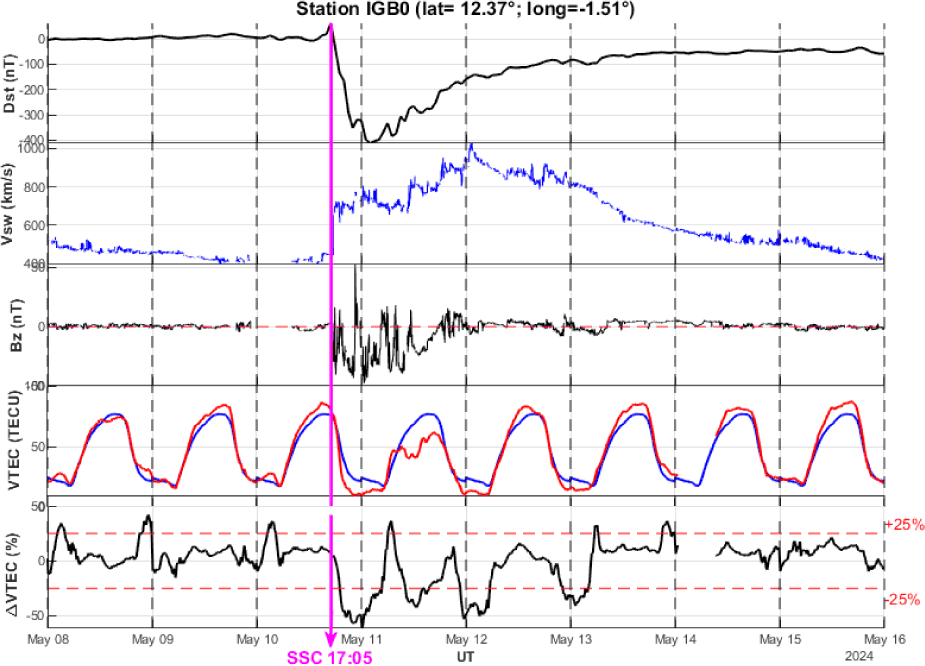
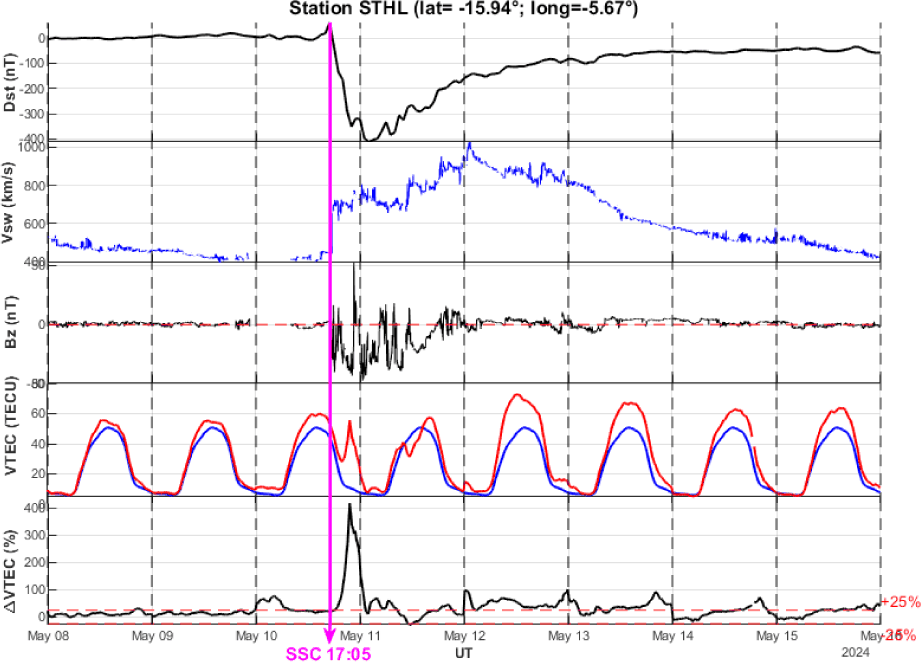
Regardless of the station, a quiet period was observed from May 8th to 10th (Dst close to 0 nT). A SSC appeared on May 10th at 17:05 UT with a positive peak, characteristic of the beginning of a storm. From May 10th to 11th, the Dst dropped sharply, reaching very negative values (~–400 nT), then slowly rose again from May 15th to 16th. The initial phase of the storm occurred around May 10th, its main phase developed from approximately 20:00 UT on May 10th to approximately 03:00 UT on May 11th, and the recovery phase began on the morning of May 11th and ended on May 15th.
Before the storm (May 8–10), the recorded VTEC (VTEC_rec) profile closely followed that of the quiet VTEC (VTEC_quiet), and ΔVTEC oscillated between –10% and +10%, thus characterizing a nearly quiet ionosphere. Immediately after the SSC and during the main phase of the storm, the IMF-Bz is southward and marked oscillations of the VTEC with |ΔVTEC| values rarely exceeding 25% are observed. At the end of the main phase and during the recovery phase (May 11–14), the recorded VTEC remained, for most of this period, below the quiet VTEC, and ΔVTEC was well below –25%, with a minimum value of –60% reached on May 12. From May 14–15, a reversal of trends was noted. The recorded VTEC maxima are slightly above the quiet reference; ΔVTEC exceeded the +25% line for much of May 15 and reached approximately +30% at its maximum.
These observations indicate that at the MORP station, the May 11 storm caused weak recorded VTEC oscillations during the main phase, an intense and prolonged negative storm during most of the recovery phase, and a positive storm at the end of the recovery phase.
Before the storm (May 8–10), the differences between recorded and quiet VTEC were small, and ΔVTEC oscillated within ± 10%, characteristic of a quiet ionosphere. After the SSC (May 10, 17:05 UT) VTEC_rec decreases and |ΔVTEC| exceeds 25% only towards the end of the main phase although the IMF-Bz has been southward since the beginning of the main phase. During the recovery phase, VTEC_rec is lower than VTEC_quiet for an extended period, with ΔVTEC reaching minimum values of –60% on May 12, and IMF-Bz lacks a stable orientation. From May 13th to 15th (recovery phase), the recorded VTEC pattern shifted towards a quieter VTEC pattern. The ΔVTEC gradually changed from negative to positive values, reaching a maximum of +30% between May 14th and 15th. This indicated the development of a moderate positive storm after May 14th.
From these observations, it is noted that at the MAD2 station, the event of May 11th generated a weak negative strom during the main phase, an intense (–60%) and prolonged negative storm during recovery phase (May 11th–12th), followed by a moderate positive ionospheric storm (+30%) at the end of the recovery phase.
Before the storm, recorded and quiet VTEC conditions were close, |ΔVTEC| < 25%, except for a few very brief excursions of recorded VTEC, likely related to minor geomagnetic fluctuations unrelated to the main storm. Just after the SSC (May 11), recorded VTEC shifted into a strongly negative phase with ΔVTEC ≈ −55% during the night into the morning of May 11. ΔVTEC remained below −25% during the main phase until the first hours of the recovery phase (May 11 at 06:00). Then, ΔVTEC fluctuated between positive and negative values until the end of the recovery phase. From these observations, it is noted that the May 11 storm caused both successive positive and negative ionospheric storms at this low latitude close to the equatorial anomaly.
Before the storm, recorded VTEC remained close to quiet VTEC except for a positive excursion (ΔVTEC > +25%) just after May 10. During the main phase, a significant peak in both recorded VTEC and ΔVTEC (+400%) was observed, characteristic of a brief and intense positive ionospheric storm. Throughout the recovery phase, recorded VTEC very often exceeded quiet VTEC. Similarly, ΔVTEC > +25% was frequently observed (+80% on May 12 and 13 at 00:00; on May 13 and 14 at 22:00). These observations suggest the existence of pre-storm ionospheric disturbances, the generation of brief and violent positive ionospheric storms during the main phase, and significant positive storms that persisted throughout the recovery phase.
Fig. 6 shows the thermospheric O/N2 ratio maps for the period from May 8 to 15, 2024.
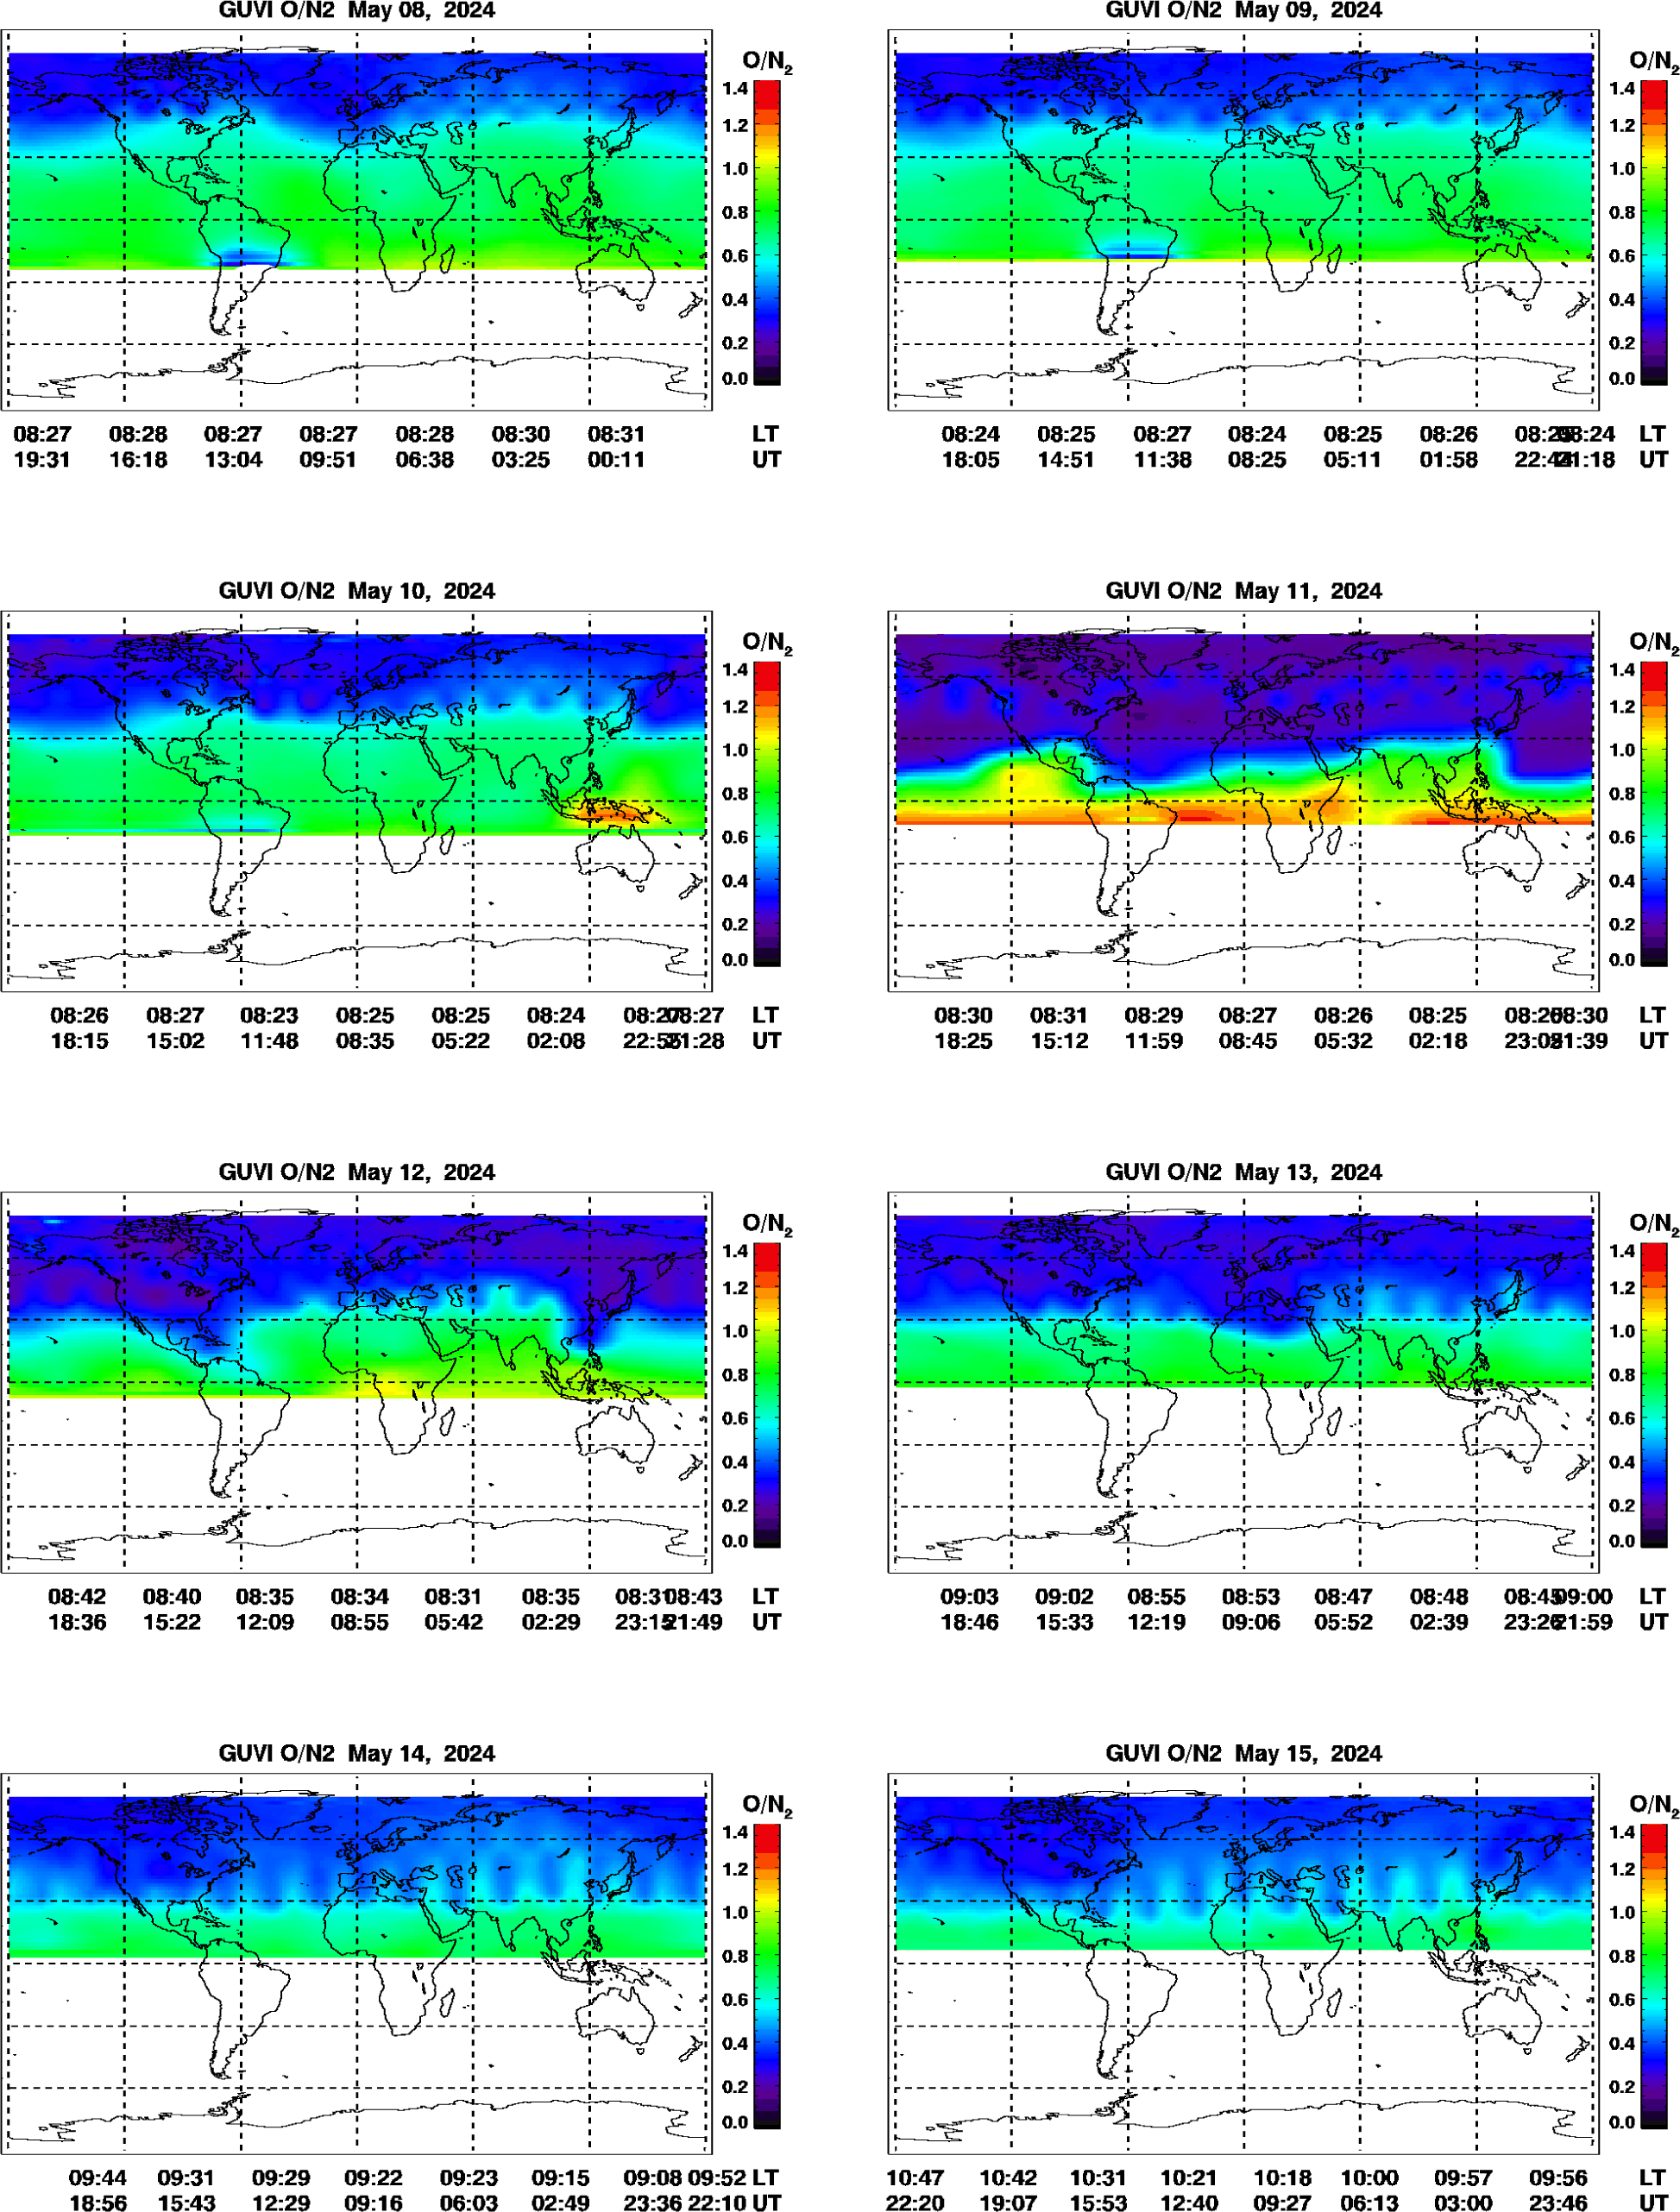
Before the storm (8–9 May), a relatively zonal distribution of the O/N2 ratio is observed, with high values (> 0.6) at low latitudes and an absence of pronounced longitudinal structures, characteristic of a globally quiet thermosphere (Cai et al. 2020).
During the main phase (10–11 May), regions of low O/N2 (< 0.2) appear at mid-latitudes, accompanied by a progressive equatorward extension of this anomaly and the development of asymmetric longitudinal structures. These features suggest enhanced auroral energy input, intensified Joule heating, thermospheric expansion, and equatorward meridional transport of N2-rich air toward lower latitudes (Richmond 2021; Matamba et al. 2023; Gan et al. 2024).
During the recovery phase (12–15 May), the low O/N2 anomalies progressively migrate toward lower latitudes, indicating the equatorward propagation of storm-induced thermospheric disturbances driven by high-latitude energy input (Cai et al., 2020). This evolution leads to a gradual homogenization of the thermospheric composition and a weakening of latitudinal gradients as recovery progresses (Cai et al. 2022).
The ionospheric responses to the May 11, 2024 storm are characterized by positive STHL and negative storms at low and mid-northern latitudes, the onset time of which is correlated with latitude. Indeed, at the IGB0 station (Lat 12.37), the VTEC_rec drop began on May 10 at 17:00 UT (exact time of the SSC). At MAD2 (Lat 40.43), the VTEC_rec drop began at 18:00 UT, one hour after the SSC. At MORP (Lat 55.21), the VTEC_rec drop began on May 11 at 03:00 UT, 10 hours after the SSC. A latitudinal delay is observed in the onset of the negative ionospheric phase. This progressive delay suggests an equatorward propagation of storm-induced thermospheric disturbances from high to lower latitudes.
4. DISCUSSION
At the MORP (55°N) and MAD2 (40°N) stations (mid-latitudes), the May 11, 2024 event generated a prolonged intense negative storm (ΔVTEC ≈ −60%) at the end of the main phase until the middle of the recovery phase (after main southward IMF-Bz interval), followed by moderate positive storms (ΔVTEC ≈ +25 to +30%) at the end of the recovery phase. This result is consistent with Gordiyenko et al. (2025), Santoso et al. (2025), for the same May 11, 2024 storm. The development of the prolonged negative storm after the main southward phase of the IMF-Bz suggests that the dominant mechanism generating the negative storm was not a direct electrodynamic forcing, but rather a perturbation of thermospheric composition. High-latitude Joule heating likely generated an equatorward-propagating composition disturbance zone characterized by reduced O/N2 ratio, which gave rise to persistent negative storms. (Prölss 1995; Buonsanto 1999; Danilov 2001; Tu et al. 2023). Indeed, a decrease in the O/N2 ratio reflects an increase in molecular nitrogen (N2), which improves recombination rates and reduces the lifetime of O+ ions, leading to a depletion of electron density and therefore to negative VTEC anomalies. The VTEC peak observed on May 13 at MAD2 is interpreted as a recovery-phase effect resulting from a combination of mechanisms: (1) the relaxation of thermospheric composition disturbances (i.e., the progressive recovery of the O/N2 ratio), and (2) disturbance dynamo electric fields (DDEF), which can drive upward plasma drift during the recovery phase. This combination leads to a temporary increase in ionospheric electron density at mid-latitudes (Blanc & Richmond 1980; Fejer & Scherliess 1997; Tu et al. 2023).
At IGB0 station (12°N) located at low latitude in the region of the EIA, the ionosphere’s responses are complex: sharp negative drops in the perturbed VTEC (ΔVTEC < −25%) during the main phase and the beginning of the recovery phase, followed by oscillations between negative and positive phases during the rest of the recovery phase. The rapid alternations between positive and negative phases indicate strong electrodynamic control. The abrupt southward turning of IMF Bz triggered PPEFs, modifying vertical plasma drift and disturbing the EIA (Tsurutani et al. 2008). The subsequent rapid oscillations could be the results of competition between the PPEF and DDEF electric fields during the transition from the main phase to the recovery phase (Fejer & Scherliess 1997; Blanc & Richmond 1980; Abdu et al. 2012).
Analysis of the STHL station (~16°S) reveals an ionospheric disturbance characterized by a marked peak in positive storms during the main phase (+400%) and a predominance of intense positive storms (+80%). The exceptional +400% ΔVTEC enhancement during the main phase coincided with strong southward IMF (~18:00 –19:00 UT on May 10) and elevated solar wind speed. This supports PPEF-driven uplift and intensification of the EIA crest (Liu et al. 2014; Astafyeva et al. 2025). Indeed, during strong south-oriented (Bz), the penetrating electric field increases the upward E×B drift at the magnetic equator, which intensifies the fountain process and leads to a polar expansion of the EIA crests. In addition, timing analysis showing that the onset of the VTEC enhancement coincides with sharp southward turnings of IMF-Bz and peaks in the interplanetary electric field (IEF), providing direct evidence for PPEF-driven forcing. Additionally, storm-enhanced density (SED) structures (Li 2021; Zou et al. 2021; Zhang et al. 2022) and interhemispheric seasonal circulation likely amplified plasma accumulation in the winter hemisphere (Astafyeva et al. 2025).
The latitudinal latency likely reflects a two-stage process: (1) The initial VTEC_rec decrease observed at MAD2 around 18 :00 UT (≈ 1 h after SSC) occurs during the interval of strong southward IMF-Bz and enhanced solar wind speed. This timing is consistent with PPEFs, which are known to produce rapid changes in vertical plasma drift at low and mid-latitudes. Therefore, the early MAD2 response is now interpreted as primarily electrodynamic rather than compositional, (2) The negative phase observed at MORP (around 03:00 UTC) develops several hours after the main interplanetary magnetic field (IMF) interval southward. This delay is consistent with the equatorial propagation of thermospheric composition perturbations generated by Joule heating and other processes at high latitudes, as shown on the GUVI/TIMED O/N2 maps. This supports the hypothesis that the observed decrease in VTEC_rec is primarily due to changes in thermospheric composition induced by storms rather than purely electrodynamic processes. Thus, the later MORP response is more compatible with O/N2 depletion mechanisms, whereas the earlier MAD2 decrease likely reflects prompt electrodynamic forcing.
Moreover during May, the Northern Hemisphere approaches summer while the Southern Hemisphere approaches winter. Solstitial thermospheric circulation drives neutral winds from summer to winter hemisphere, redistributing composition and plasma. This seasonal configuration likely contributed to negative storm dominance in the North and strong positive storm development in the South (Fuller-Rowell et al. 1996, Qian & Yue 2017; Astafyeva et al. 2020).
5. CONCLUSION
The extreme geomagnetic storm of 11 May 2024 produced a strongly latitude-dependent ionospheric response characterized by clear spatiotemporal evolution and marked interhemispheric asymmetry. GNSS-derived ΔVTEC observations reveal distinct behaviors across latitudes. At northern mid-latitudes (MORP and MAD2), the storm generated intense and prolonged negative ionospheric storms (down to −60%), mainly developing after the main southward IMF-Bz interval and persisting through early recovery. The delayed onset and duration of these negative phases, supported by GUVI/TIMED O/N2 depletion patterns, indicate that thermospheric composition disturbances were the dominant driver. Moderate positive phases observed at the end of recovery likely reflect progressive relaxation of the coupled ionosphere–thermosphere system. At the equatorial station (IGB0), the response was highly dynamic, with rapid alternations between negative and positive phases. This variability is consistent with strong electrodynamic forcing, including prompt penetration electric fields during the main phase and disturbance dynamo effects during recovery. At the STHL, the ionosphere was dominated by extremely intense positive storms, including an exceptional +400% enhancement during the main phase and persistent positive disturbances during recovery. These features suggest strong electrodynamic uplift combined with seasonal interhemispheric circulation favoring plasma accumulation in the winter hemisphere. Overall, the identified latitudinal latency supports a two-stage response: rapid electrodynamic forcing followed by delayed thermospheric composition perturbations. These results underscore the need to integrate electrodynamic and thermospheric processes in forecasting extreme storm-time GNSS impacts.


