


1. INTRODUCTION
One of the most intensively studied current multidisciplinary scientific issues is estimating the anthropogenic contribution to global warming. This has led to investigating the possible role of the Sun with respect to a better understanding of natural climate change. As a result, it has been shown that the terrestrial climate system responds to the solar variability via changes in the Sun’s total irradiance (Frohlich 2006), the solar extreme ultraviolet (EUV) irradiance (Emmert & Picone 2010;Gray et al. 2017), the Earth’s magnetic/electric systems (Burns et al. 2007, 2008), galactic cosmic ray (GCR) influx (Tinsley & Deen 1991;Pudovkin et al. 1997;Marsh & Svensmark 2000;Roldugin & Tinsley 2004;Pudovkin 2004;Haigh 2007;Bazilevskaya et al. 2008;Artamonova & Veretenenko 2011), solar energetic particle events (Veretenenko & Thejll 2004;Cho et al. 2012;Mironova et al. 2012;Mironova & Usoskin 2013, 2014), highspeed solar winds (Zhou et al. 2016), etc. In addition, the solar North–South asymmetry has recently been considered as one of the parameters affecting climate conditions (e.g., Cho et al. 2012;Kim et al. 2017;Chang 2018;Kim et al. 2018).
Even though the manifestation of the response to solar activity appears to be more local in both time and space than global, there is indeed phenomenological evidence that solar activity is linked to changes in terrestrial weather and climate on the timescales of days to several tens of year (Svensmark & Friis-Christensen 1997;Marsh & Svensmark 2000;Tinsley 2000;Krivova & Solanki 2004;Pudovkin 2004;Roldugin & Tinsley 2004;Scafetta & West 2006;Haigh 2007;Burns et al. 2007, 2008;Cho & Chang 2008;Kniveton et al. 2008;Meehl et al. 2009;Gray et al. 2010;Cho et al. 2012;Gray et al. 2013;Lee & Yi 2018;Muraki 2018). For example, the solar variability is associated with the El Niño-Southern Oscillation (ENSO) variability (e.g., van Loon et al. 2007;van Loon & Meehl 2008;Meehl et al. 2008, 2009;Roy & Haigh, 2010, 2012;Zhou & Tung 2010;Haam & Tung 2012), the Quasi Biennial Oscillation (QBO) (Labitzke 1987;Labitzke & van Loon 1988;Sagir et al. 2015), and the North Atlantic Oscillation (NAO) (Gray et al. 2013). Furthermore, solar activity is related to various types of extreme weather, such as tropical cyclones (Kim et al. 2017;Kim et al. 2018), severe droughts (Bhalme et al. 1983;Meshcherskaya & Blazhevich 1997;Park & Chang 2013;Park et al. 2014), changes in the precipitation patterns of rainy seasons (Mazzarella & Palumbo 1992;Kavlakov 2005;Pérez-Peraza et al. 2008;Ho et al. 2016;Choi et al. 2017), and heatwaves (Coumou & Rahmstorf 2012).
Low solar activity would allow a greater GCR influx into the Earth’s atmosphere. Consequently, more cloud condensation nuclei resulting from GCR via either the ionaerosol clear-sky mechanism or ion-aerosol near-cloud mechanism form to increase cloudiness and in turn affect the tropical cyclone activity. Another possible mechanism is that high solar activity results in warming of the lower stratosphere and the upper troposphere, decreasing the convective available potential energy and the intensity of tropical cyclones (Elsner & Jagger 2008;Hung 2013). Particularly, typhoons in the western North Pacific influencing the Korean peninsula are of great interest because typhoons occur here much more frequently than in any other tropical cyclone genesis basin. Thus, tropical cyclone activity over the Northwestern Pacific basin was examined to determine whether there is a long-term trend, and if so, whether it is modulated by solar activity (Kim et al. 2017;Kim et al. 2018). Kim et al. (2017, 2018) attempted to address questions regarding solar influences on tropical cyclone genesis in the Northwestern Pacific basin by analyzing locations where tropical cyclones form, reach their lowest central pressure, and downgrade back to a tropical depression. They found that tropical cyclones occurring in the solar maximum periods and in the solar descending periods have properties similar to those in El Niño periods. Unfortunately, however, their subsequent investigations show that that conclusion turns out to be inconclusive. Based on the linear correlation coefficients r between the locations of tropical cyclones and observed data of sunspot areas, they concluded that tropical cyclone properties appear weakly correlated or anti-correlated with the solar cycle, although some long-term trends can be observed. In spite of the fact that tropical cyclone activity seems to share periodicities with solar activity, they have also warned, with the wavelet transform method, that there is no evidence showing that tropical cyclone activity is causally related to solar activity, including positions of occurrence/development and other characteristics. This result essentially occurs because the wavelet transform method is inappropriate for searching for causality.
In this paper, we investigate associations between the solar variability and teleconnection patterns, which are spatial and/or temporal climate anomalies connected to each other over a large distance, typically thousands of kilometers. Such a large-scale anomaly surely influences the atmospheric circulation and subsequent spatial distribution of the global pressure system, so that climate factors governing tropical cyclone genesis, movement, and recurvature locations, as well as lifetime, are changed (Choi & Moon 2012; Choi & Cha 2017; Choi et al. 2017). That is, unlike earlier approaches, we study a link between the Sun and a large-scale mode of climate variability, which may indirectly affect the Earth’s climate and weather, instead of a direct link between the Sun and terrestrial climate and weather. This is crucial in the sense that feedbacks of solar variability to an autogenic or internal process, such as a long-term variation, should receive attention because solar forcing as an ingredient of the climate system is nonlinear in nature. To find a resemblance in shape of two physical quantities, we have calculated the normalized crosscorrelations, defined by
Where
and
where u∗(τ) is the complex conjugate of u(τ). For all t, |z(t)| ≤ 1. Note that the argument of w(t) is called the lag if it is positive, or the lead if it is negative. That is, if the argument of w(t) is positive, the first quantity follows the second quantity by the amount of its value, and vice versa. The correlation of a signal with itself is called the autocorrelation. The autocorrelation at zero lag corresponds to the linear correlation coefficient. This paper is organized as follows. We begin with a description of the data analysis in Section 2. We present and discuss the results in Section 3. Finally, we briefly summarize and conclude in Section 4.
2. DATA
As a proxy of solar activity, we have taken the sunspot area and sunspot number data from the NASA Marshall Space Flight Center website (http://solarscience.msfc.nasa. gov/greenwch.shtml). We extracted the daily sunspot area (in units of millionths of a hemisphere) and daily sunspot number during the period from 1977 to 2016, approximately spanning from solar cycles 21 to 24. The sunspot dataset is available as ASCII text files for both the Northern Hemisphere and the Southern Hemisphere, separately. To calculate the solar North–South asymmetry, we have used sunspot area data, defined by (AS − AN)/(AS + AN), where AS and AN are the sunspot area appearing in the solar Southern and Northern hemispheres, respectively. For the timeseries of the teleconnection indices, such as the Southern Oscillation Index (SOI) the NAO index, the Arctic Oscillation (AO) index, the Antarctic Oscillation (AAO) index, and the Pacific-North American (PNA) index, we have downloaded daily data from the NOAA website (https://www.ncdc. noaa.gov/teleconnections), which provides various indices representing large-scale anomalies in space and time that control the variability of atmospheric circulation. Having downloaded all the daily data, we averaged those data yearly so that we can compute the normalized cross-correlations by year. We are interested in yearly values because climate indices primarily vary by season.
3. RESULTS AND DISCUSSION
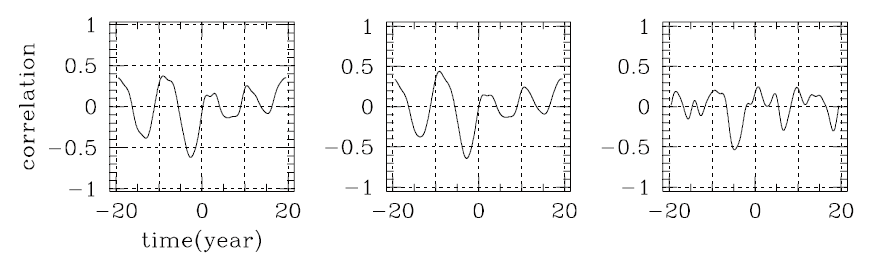
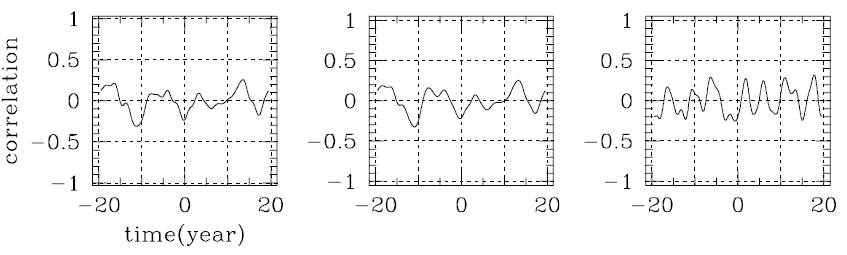
In Fig. 1, from left to right, we show the normalized crosscorrelations of the total sunspot area, the total sunspot number, and the solar North–South asymmetry with the SOI index, respectively. According to the definition, when the correlation values are positive (negative), there is a positive (negative) correlation. When the argument of the function at extremum is positive, the first observable lags (or follows) the SOI index by that amount. Conversely, when the argument of the function at maximum (minimum) is negative, the first observable leads (or goes ahead of ) the SOI index by that amount. The SOI index is anticorrelated with both solar activity and the solar North– South asymmetry with a lag of ∼−3 years. Because the SOI index is based on the standardized difference between observed sea-level pressures in Tahiti and Darwin, the negative SOI index corresponds to the El Niño period. This result therefore means that the El Niño episodes likely occur three years after the solar maximum. This not only agrees with the fact that El Niño episodes likely occur around the solar maximum, but also explains why tropical cyclones occurring in the solar maximum periods and in El Niño periods appear similar (e.g., Kim et al. 2017;Kim et al. 2018).
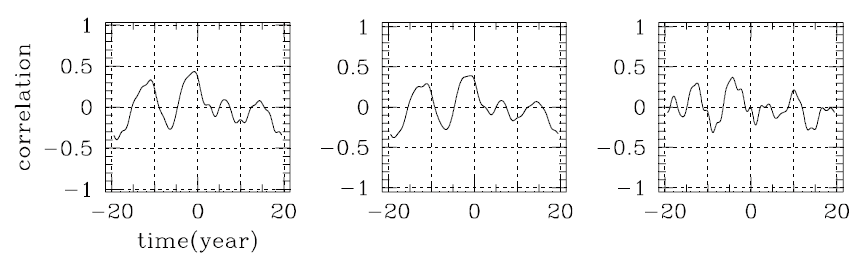
In Fig. 2, from left to right, we show the normalized crosscorrelations of the total sunspot area, the total sunspot number, and the solar North–South asymmetry with the NAO index, respectively. The NAO index is the sealevel pressure difference between the Azores High and the Subpolar Low. The positive and negative phases are associated with the North Atlantic jet stream and storm tracks. When the NAO phase is positive, temperatures in the eastern Americas and northern Europe become high. The NAO index is weakly correlated with solar activity with a lag of ∼−1 year. However, it is very weakly correlated with the solar North–South asymmetry. This might reflect the fact that the climate of regions under the influence of the NAO, including Europe, is less sensitive to solar variability, even though some European countries experience severe winters during grand solar minima, such as the Maunder minimum (e.g., Eddy 1977).
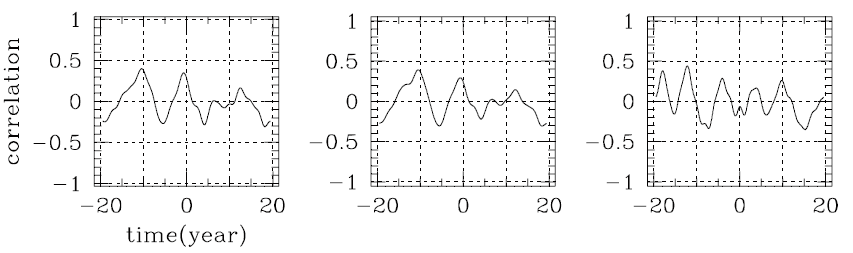
In Fig. 3, from left to right, we show the normalized crosscorrelations of the total sunspot area, the total sunspot number, and the solar North–South asymmetry with the AO index, respectively. The AO is a wind pattern circulating counterclockwise around the North-polar region. It is sometimes referred to as the Northern Hemisphere annular mode (NAM). When it is positive, cold air across the polar region is confined. The AO index appears to be weakly correlated with solar activity, with a lag of ∼−1 year. It is anti-correlated with the solar North–South asymmetry with a lag of ∼−7 years. These results could mean that high solar activity may lead to a positive AO pattern, so that relatively warm winters in the Northern hemisphere occur one year after a solar maximum.
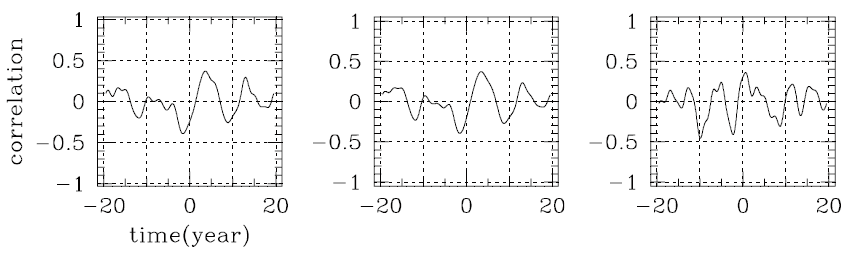
In Fig. 4, from left to right, we show the normalized crosscorrelations of the total sunspot area, the total sunspot number, and the solar North–South asymmetry with the AAO index, respectively. Similar to the AO, the AAO is defined as a belt of westerly winds around Antarctica. It is also known as the Southern Annular Mode (SAM). This may lead to ice shelf basal melt. The AAO index appears to be anti-correlated with solar activity and the solar North– South asymmetry, with a lag of ∼−2 years. Note that this behavior is opposite to what is seen in Fig. 3 resulting from the AO index. It is thus interesting to investigate the cause of this difference in view of the fact that recent global warming apparently leads to warming in the Northern hemisphere and somewhat different effects in the Southern hemisphere.
In Fig. 5, from left to right, we show the normalized cross-correlations of the total sunspot area, the total sunspot number, and the solar North–South asymmetry with the PNA index, respectively. The PNA pattern is associated with the East Asian jet stream. When the PNA pattern is in a positive phase, the temperature in western Canada is high. The PNA index appears to be only slightly correlated with sunspot area/number, or the North–South asymmetry. Again, as in the earlier cases seen in Figs. 2–4, this finding emphasizes that responses of terrestrial climate and weather to solar variability are local in space and demonstrates that the solar effect on the terrestrial climate is not straightforward; rather, feedbacks play a critical role.
In Fig. 6, for comparison, we show the normalized cross-correlations resulting from some combinations of teleconnection indices. On the upper right corner in each panel, the chosen computational indices are indicated. Because teleconnections influencing the weather pattern were first noticed in the late 19th century, the correlation between their time series has been probed, and spatial patterns have been compared. Associated teleconnections are now well known. For example, the PNA pattern is strongly affected by the El Niño phenomenon, and NAO phases are related to AO patterns. As seen in Figs. 1–6, however, the correlations between solar activity and teleconnection indices are as good as correlations resulting from the teleconnection indices themselves. Hence, although the normalized cross-correlations of the total sunspot area, the total sunspot number, and the solar North– South asymmetry with teleconnection indices are marginal, the normalized cross-correlations of solar variability with teleconnection indices cannot be ignored in comparison with those of the teleconnection indices themselves.

4. SUMMARY AND CONCLUSIONS
Sunspot activity is associated with terrestrial weather and climate. It operates in a complex way, so that the resulting effects are nonlinear and local in nature. It may directly modulate the system of terrestrial climate via changes in the Earth’s thermal system, or Earth’s magnetic/ electric systems. More importantly, solar variability may be linked to a largescale mode of climate variability, which may indirectly affect the Earth’s climate and weather. We consider this a crucial matter because feedbacks of solar forcing on an autogenic or internal process such as longterm variation should be taken into account in the sense that a solar variability as an ingredient of the terrestrial climate system is nonlinear in nature. In this paper, we have examined associations between solar variability and teleconnection patterns, which are largescale spatial and/ or temporal climate anomalies connected to each other. We have calculated the normalized cross-correlations of the total sunspot area, the total sunspot number, and the solar North–South asymmetry with teleconnection indices including the SOI, the NAO index, the AO index, the AAO index, and the PNA index during the period from 1977 to 2016, approximately spanning from solar cycles 21 to 24.
As a result, we have found that
(1) the SOI index is anti-correlated with both solar activity and the solar North–South asymmetry, with a lag of ∼−3 years. This implies that El Niño episodes likely occur three years after a solar maximum. This fact both agrees with the fact that El Niño episodes likely occur around the solar maximum and explains why both tropical cyclones occurring in the solar maximum periods and in El Niño periods appear similar.
(2) Other teleconnection indices, such as the AO index, the AAO index, and the PNA index, are weakly or only slightly correlated with solar activity. This fact emphasizes that the responses of terrestrial climate and weather to solar variability are local in space and demonstrates that the solar effect on the terrestrial climate is not straightforward; rather, feedbacks play a crucial role.
(3) The correlations between the indices of solar activity and teleconnection are as good as the correlations resulting from the teleconnection indices themselves. Hence, although the normalized cross-correlations of the total sunspot area, the total sunspot number, and the solar North–South asymmetry with teleconnection indices are marginal, the normalized cross-correlations of solar variability with teleconnection indices cannot be ignored in comparison with the normalized cross-correlations of the teleconnection indices themselves.