Review Paper

Latitudinal Distribution of Sunspot and North-South Asymmetry Revisited

Heon-Young Chang*http://orcid.org/0000-0003-2015-2725
Author Information & Copyright
Department of Astronomy and Atmospheric Sciences, Kyungpook National University, Daegu 41566, Korea
Corresponding Author Tel:+82-53-950-6367, E-mail:hyc@knu.ac.kr

© The Korean Space Science Society. All rights reserved. This is an Open-Access article distributed under the terms of the Creative Commons Attribution Non-Commercial License (http://creativecommons.org/licenses/by-nc/3.0/) which permits unrestricted non-commercial use, distribution, and reproduction in any medium, provided the original work is properly cited.

Received: May 2, 2018; Revised: May 19, 2018; Accepted: May 21, 2018

Abstract

The solar magnetic field plays a central role in the field of solar research, both theoretically and practically. Sunspots are an important observational constraint since they are considered a discernable tracer of emerged magnetic flux tubes, providing the longest running records of solar magnetic activity. In this presentation, we first review the statistical properties of the latitudinal distribution of sunspots and discuss their implications. The phase difference between paired wings of the butterfly diagram has been revealed. Sunspots seem to emerge with the exponential distribution on top of slowly varying trends by periods of ~11 years, which is considered multiplicative rather than additive. We also present a concept for the center-oflatitude (COL) and its use. With this, one may sort out a traditional butterfly diagram and find new features. It is found that the centroid of the COL does not migrate monotonically toward the equator, appearing to form an ‘active latitude’. Furthermore, distributions of the COL as a function of latitude depend on solar activity and the solar North-South asymmetry. We believe that these findings serve as crucial diagnostic tools for any potential model of the solar dynamo. Finally, we find that as the Sun modulates the amount of observed galactic cosmic ray influx, the solar North-South asymmetry seems to contribute to the relationship between the solar variability and terrestrial climate change.

Keywords: sun; sunspots; butterfly diagram; north-south asymmetry

1 INTRODUCTION

The Sun, the nearest star to us, supports life on the Earth in such a way that it provides energy required by living organisms, while simultaneously posing a threat by emitting hazardous high-energy particles onto the terrestrial surface. The invisible solar magnetic field modulates its perceivable effects in time and space, which manifests itself as all the phenomena on the solar surface, including sunspots, faculae, coronal mass ejection, solar flares, and prominences (Choi et al. 2017). It also contributes to regulating the structure and dynamics in the interior of the Sun in the sense that the strength of the convective flows or overshooting should be consistent with the distribution of the deep-rooted largescale magnetic field. This is a part of the reason why much recent effort in solar research is focused on the configuration and evolution of the solar magnetic field. Furthermore, our understanding of the magnetism of cool stars is an extrapolation of our knowledge of the Sun. Though for some scientists, ensembles of cool stars would supply information on the solar magnetic field, demanding observations on a very long timescale, this fact itself states that solar magnetism can be a prototype of that of a cool star.

The solar dynamo, in which the magnetic field is maintained by its interaction with the sheared motion of conducting plasma in the interior, acting in the tachocline between the radiative core and the convective envelope, is generally accepted as the source of the Sun’s magnetic field (Parker 1955; Babcock 1961; Leighton 1969). In the solar dynamo, differential rotation and convective flows are considered to be the most important ingredients (e.g., Parker 1970). Rising through the convection zone due to magnetic buoyancy under the Coriolis effect, magnetic flux tubes, stretched in the toroidal direction by differential rotation, emerge at the visible solar surface as a magnetic loop. Footpoints of the loop are visible as sunspots of bipolar active regions in the photosphere. Theoretically, the solar dynamo can be reckoned as a solution of the magnetohydrodynamics (MHD) equations for which the magnetic energy is nontrivial as time goes to infinity. The traditional mean-field dynamo model based on the Parker mechanism has been mathematically formulated, first by Krause & Rädler (1980), successfully explaining basic observational features. The solution of such αΩ-dynamos represent latitudinally propagating waves equatorward or poleward, dependent on the sign of α∂Ω/∂r (e.g., Yoshimura 1975; Choudhuri et al. 1995; Nandy & Choudhuri 2001; Kitchatinov 2002). In this kind of classical dynamo model, however, there are problems. For instance, the efficiency in creating the migration of the dynamo wave is lower than the observed latitude drift of the sunspot zone. Thus, various versions of the dynamo theory have been developed for overcoming problems and meeting observational constraints.

Our understanding is, as pointed out, constrained by different observations of the magnetic field on the solar surface. Although observations of the solar magnetic field mostly refer to measurements based on the cyclotron resonance, the Hanle effect, and the Faraday rotation, as well as the Zeeman effect (e.g., Howard 1974; Antonucci et al. 1990; Mouradian & Soru-Escaut 1991; Knaack et al. 2004, 2005), the recording of magnetic proxies, such as the number or the area of sunspots (Newton & Milsom 1955; Roy 1977; White & Trotter 1977; Swinson et al. 1986; Vizoso & Ballester 1990; Schlamminger 1991; Yi 1992; Carbonell et al. 1993; Verma 1993; Oliver & Ballester 1994; Krivova & Solanki 2002; Li et al. 2002; Temmer et al. 2002; Vernova et al. 2002; Knaack et al. 2004; Ballester et al. 2005), sunspot groups (Brajša et al. 2002; Berdyugina & Usoskin 2003; Forgács-Dajka et al. 2004), the flare occurrence/ index (Roy 1977; Ichimoto et al. 1985; Verma 1988; Garcia 1990; Verma 1993; Ataç & Özguç 1996; Li et al. 1998; Ataç & Özguç 2001; Temmer et al. 2001; Joshi & Joshi 2004; Joshi & Pant 2005), the coronal green-line (Waldmeier 1971; Özgüç & Ücer 1988; Tritakis et al. 1988), and prominences/ filaments (Hansen & Hansen 1975; Vizoso & Ballester 1989; Duchlev & Dermendjiev 1996; Duchlev 2001; Gigolashvili et al. 2005), have been routinely conducted in a traditional way. Particularly, sunspot observations provide the longest running records of solar magnetic activity (e.g., Schwabe 1843; Carrington 1860; Maunder 1904). It should be worthwhile to note that their magnetic nature has only been known as a source of the sunspot phenomenon since Hale first measured the magnetic field in sunspots (Hale 1908), although sunspots have been extensively monitored for longer than 400 years.

Sunspots, whose umbra intensity is approximately 20–30 % that of the quiet Sun, are the most readily visible signs of concentrated solar magnetic fields. Since sunspots are formed as soon as the magnetic tube emerges from the solar surface, they can be considered tracers of emerged magnetic flux tubes. At the center of a sunspot, the magnetic field line is almost vertically aligned, with a field strength of about 2,500–3,500 G. Long-term observations of sunspots indicate that solar activity as a time series shows various periodicities, such as ~11 years (Schwabe 1843; Maunder 1904), ~80–90 years (Gleissberg 1971), ~1.3 years (Howe et al. 2000; Krivova & Solanki 2002; Obridko & Shelting 2007; Kim & Chang 2011; Cho et al. 2014), ~154 days (Rieger et al. 1984), ~51, 78, 104, and 129 days (Bai & Sturrock 1991, 1993). In addition to variable sunspot records in time, the latitudinal position of sunspots with time provides invaluable information about the physical processes that generate the solar magnetic flux and induce its evolution. Although sunspots seem to emerge stochastically at any latitude lower than ~±40°, locations of sunspots are drifting equatorward from the mid-latitudes as a solar cycle proceeds. This behavior forms a well-known butterfly diagram (Maunder 1904), which has become a widely-used tool for a concise description of the sunspot zone evolution. One thing that must be kept in mind when statistically comparing a theoretical model with the observed butterfly diagram, however, is that the butterfly diagram does not consider the sunspot lifetime nor the spatial size. Since all sunspots are dealt equally, regardless of their temporal and spatial dimension, the conventional butterfly diagram is likely to be overwhelmed by numerous and yet small sunspots, which are distributed over wider ranges than large ones (Ternullo 2007a; Cho & Chang 2011). This aspect is easy to understand if one notes that the smallest 65 % of the sunspots comprises only up to ~10 % of the total spotted area (Ternullo 2007b).

This review article is aimed at both the young student who is about to enter the field of solar research and space physicists and astronomers in other possibly related fields. The scope of this article and the provided references should not be considered comprehensive nor complete. Nonetheless, here, we would like to present the observed spatial distribution of sunspots, which exhibits a North-South asymmetry, and discuss its statistical properties. Its periodicity is also summarized. We would further introduce another way to form a butterfly diagram demonstrating interesting features. We believe that any potential model of the solar dynamo must be capable of explaining the butterfly diagram and its properties since it provides clues and diagnostic tools on the structure and evolution of the solar magnetic field. In the end, we discuss related issues, such as the impact of the Sun on the terrestrial climate (e.g., Cho & Chang 2008; Park & Chang 2013; Kim et al. 2017a; Kim et al. 2017b; Lee et al. 2017; Hwang et al. 2018; Kim et al. 2018). The paper is organized as follows. We discuss stochastic properties and periodicities of the North-South asymmetry of the observed sunspot data in Section 2. We discuss how we define the center-of-latitude (COL) and what we find from the analysis of distributions of the COL in Section 3. We present a couple of issues related to the North-South asymmetry of sunspots in Section 4. Finally, we conclude in Section 5.

2 NORTH-SOUTH ASYMMETRY OF SUNSPOT AREA

2.1 Stochastic Properties

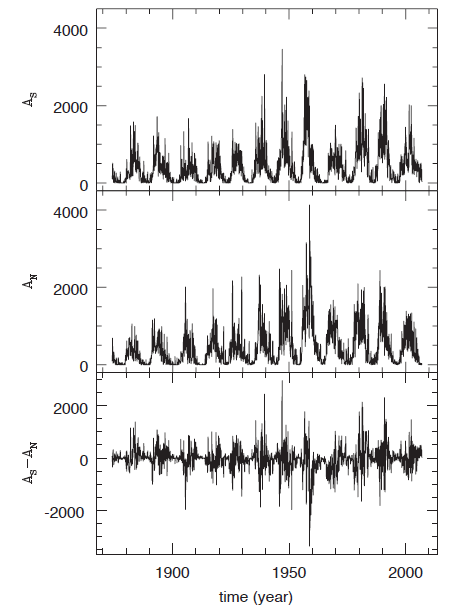
Asymmetries between the northern and southern hemispheres have been previously reported in various solar indices. In Fig. 1, we show the monthly average of the sunspot area appearing in the solar northern and southern hemispheres, AN and AS, and its difference, AS-AN, as appeared in Chang (2008). It should be noted from the bottom plot that the absolute difference is enhanced near the solar maxima and that the cycle maxima in both hemispheres are shifted by a couple of years (cf. Temmer et al. 2006). As far as we are aware, there is a magnetic flux transport dynamo model that successfully reproduces the amplitude and duration fairly well but not the phase difference in the solar activity. This is partly why a clear explanation for the physical cause of the North-South asymmetry is still outstanding, yet it is suspected to be related to the dynamo action (e.g., Ossendrijver et al. 1996; Zharkov & Zharkova 2006). Note that Pulkkinen et al. (1999) proposed an idea that the solar North-South asymmetry phenomenon could be explained by the oscillation in a quadrupolar component of a mixed parity mode excited in the solar magnetic field.
jass-35-55_F1
Fig. 1. Monthly average of the sunspot area in units of millionths of a hemisphere, redrawn to reproduce Fig. 1 in Chang (2008). From top to bottom, AS, AN, and AS - AN are shown. Plots result from the period of 1874–2007.
Download Original Figure

According to Chang (2008), the sunspot area can be modeled with random noise superposed on a slowly varying background characterizing the observed asymmetry of the sunspot area. Thus, the sunspot areas in the two hemispheres, AS and AN, are assumed to be approximated by

A S = ( 1 + ε S ) × sin n ( ω 0 + ϕ ) A N = ( 1 + ε N ) × sin m ω 0 t
(1)

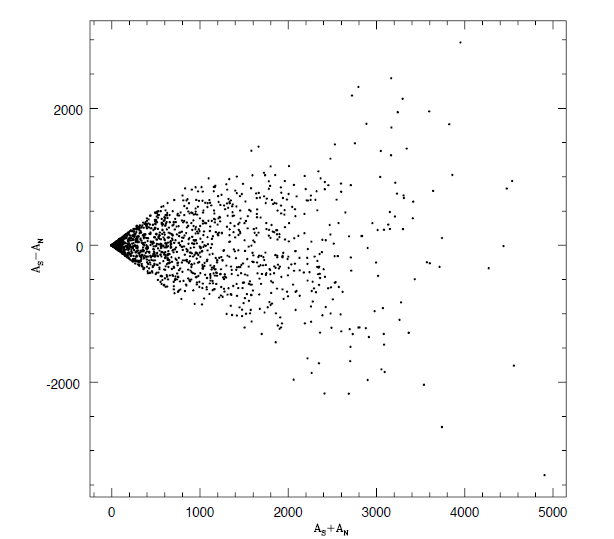
atterplot, which is related to the stochastic properties of the where ω0 represents the solar cycle frequency, ϕ is the phase shift, and ϵS and ϵN are random noise (e.g., Chang 2009a). Two kinds of noise distribution were employed to reproduce the observational features: (1) uniform distribution and (2) exponential distribution. Random noise is assumed to be multiplicative rather than additive, since the former reproduces observational features more satisfactorily. Fig. 2
jass-35-55_F2
Fig. 2. Scatterplot of the difference against the sum of the sunspot areas in both hemisphere, redrawn to reproduce the lower panel of Fig. 2 in Chang (2008). We show AS - AN versus AS + AN at the same epoch.
Download Original Figure

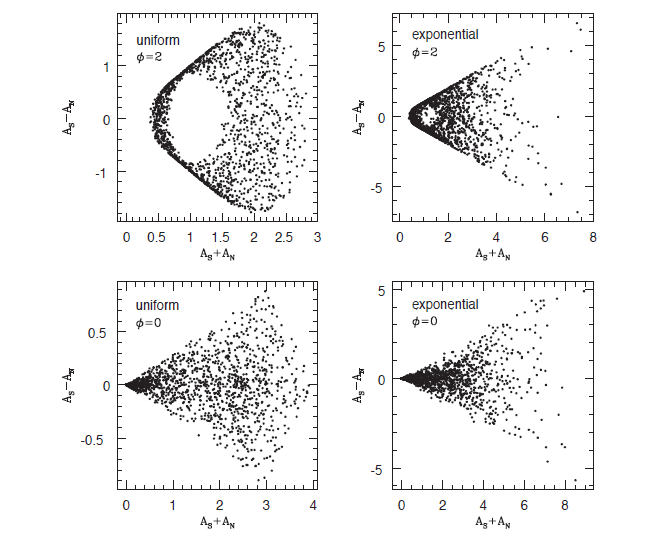
average of the sunspot area and the sum of the sunspot areas in the northern and southern hemispheres at a given time. The scatterplot represents the dependence of the asymmetry upon the magnitude of the solar activity index itself. There seems to be an evident pattern in this scatterplot, which is related to the stochastic properties of the magnitude of the North-South asymmetry. In Fig. 3, for example, we show scatterplots for the uniform distribution and exponential distribution with and without 2-year phase lags, as denoted in the upper left corner in each panel. As the phase lag becomes greater than a couple of years, the silhouette of scatters significantly deviates from the observational data (cf. Waldmeier 1971; Swinson et al. 1986; Zolotova & Ponyavin 2006). Another important point is that the exponential distribution case agrees with the observed sunspot area data more closely than the uniformly distributed random number case. According to Chang (2008), when m and n have different values, the scatterplot becomes less symmetric with respect to the horizontal axis, which is what one may see in the observed data.
jass-35-55_F3
Fig. 3. Scatterplots for two cases of random number distributions with and without 2-year phase lags, redrawn to reproduce Fig. 3 in Chang (2008). Values of n and m are the same and are set to 2.4.
Download Original Figure
2.2 Periodcity of North-South Asymmentry

Chang (2007a) studied the temporal variations in the North-South asymmetries of the sunspot area, applying the periodogram analysis method developed by Lomb and Scargle (see Kim & Chang 2014), an appropriate tool for analyzing unevenly-spaced data. From this analysis, sunspot areas in the northern and southern hemispheres were revealed to exhibit the ~11-year periodicity when they were analyzed separately. However, it was noted that the main periodicity of the absolute asymmetry is ~9 years, while the main periodicity of the relative asymmetry, the difference divided by total area, is ~12 years. This study also noted other periodicities of ~1.4, ~3.8, and ~43 years. Chang (2007b, 2009b) also employed the cepstrum analysis method to reanalyze the power spectrum of the North- South asymmetry after applying a cleaning process and confirmed the earlier conclusion of Chang & Han (2008). However, some of the short periodicities appear to be unable to survive the deconvolution process (cf. Knaack et al. 2004; Ballester et al. 2005). The shorter periodicities should be more closely studied. For instance, Cho & Chang (2011) have reported that the periodicity of ~5.5 years can be found in each hemisphere when the COL is analyzed. They further suggested that the periodicity of ~49 years is found in the averaged COL.

3 LATITUDINAL DISTRIBUTION OF SUNSPOTS USING THE CENTER-OF-LATITUDE

Sunspot latitude is a definitive indication of the phase of the sunspot cycle, indicating how active the Sun is. As mentioned above, however, a study of the latitudinal distribution with the conventional butterfly diagram conclusion may be biased due to a large group of small sunspots. This is why a cleaner butterfly diagram is necessary. To bypass this issue, Cho & Chang (2011) attempted a novel approach to a diagram of the latitudinal distribution of sunspots. They defined the ‘COL’ by

COL =  i ( a i × L i ) / i a i
(2)

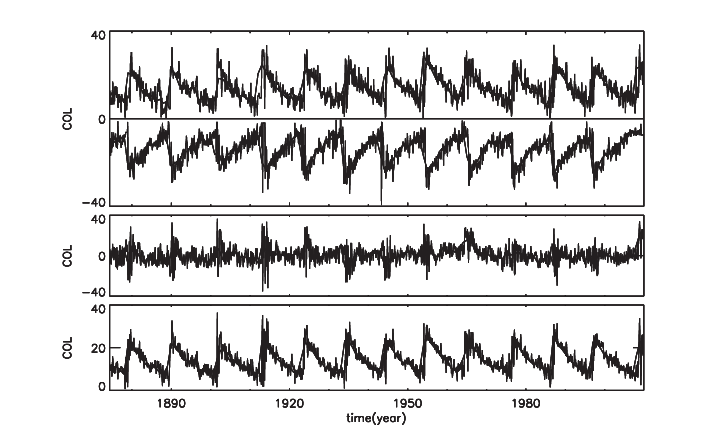
In Fig. 4 we show the ‘COL’ as a function of time. In the upper panel, the averaged COL for sunspots appearing both in the northern and southern hemispheres is separately plotted. Here, the plus and minus signs represent the northern and southern hemispheres, respectively. In the middle panel, the averaged COL for sunspots appearing in both hemispheres is plotted, taking into account the sign of the latitude. In the bottom panel, a similar plot to that in the middle panel is shown, with the exception that the averaged COL is computed without considering its sign. Based on the newly suggested butterfly diagram, Chang (2012) noted that the COL does not steadily decrease, as commonly considered (cf. Ternullo 2007a). Instead, short plateaus or humps between solar minima are commonly seen at latitudes of ~±10°. In fact, humps appear around all solar maxima, which may well be related to the ‘active latitude’, proposed in other studies (e.g., Li et al. 2003; Solanki et al. 2008; Ternullo 2010). Chang (2012) also found that each of the wings of the butterfly diagram is not symmetrical nor does it monotonically drift to the equator.
jass-35-55_F4
Fig. 4. ‘Center-of-latitude (COL)’, redrawn to reproduce Fig. 1 in Cho & Chang (2011). Thick and thin curves represent the yearly averaged COL and the monthly averaged COL, respectively. In the upper panel, we plot separately the COL for the northern and southern hemispheres. In the middle panel, we plot the average COL of both hemispheres, taking into account its sign. In the bottom panel, we plot the average COL of both hemispheres without considering its sign.
Download Original Figure

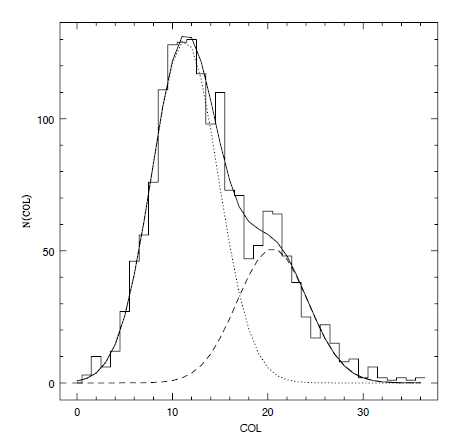
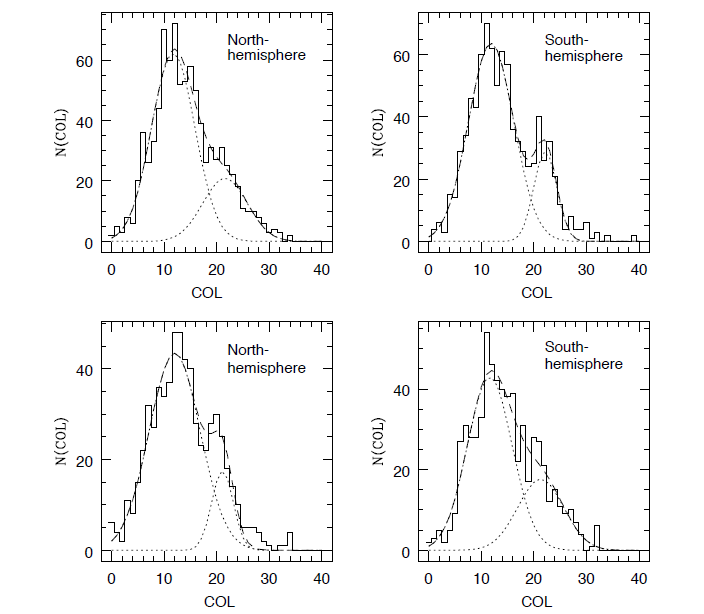
In Fig. 5, we show the histogram of the COL and its best fit. Solid, dashed, and dotted curves represent the best fit of the double Gaussian function and two Gaussian components, respectively. The distribution of the COL as a whole is well represented by the double Gaussian function, having maxima at ~±11° and ~±20°. Regardless of which hemisphere is magnetically dominant, the main component of the double Gaussian function seems to remain unchanged. The central position and the full-width-at-half-maximum (FWHM) are largely unchanged, as well. On the other hand, as shown in Fig. 6, when the northern (southern) hemisphere is dominant, the width of the secondary component of the northern (southern) hemisphere becomes about twice as wide as that of the southern (northern) hemisphere. In other words, which hemisphere is dominant can be determined by measuring the width of the secondary component at higher latitudes.
jass-35-55_F5
Fig. 5. Histogram of the COL with the double Gaussian function, redrawn to reproduce Fig. 1 in Chang (2011). Solid, dashed, and dotted curves represent the best fit of the double Gaussian function and the two Gaussian components, respectively.
Download Original Figure
jass-35-55_F6
Fig. 6. Histogram of the COL with the double Gaussian function, redrawn to reproduce the upper panels of Figs. 3 and 4 in Chang (2012). In the left and right columns, histograms result from sunspots in the northern and southern hemispheres, respectively. Upper panels show results of the sunspots observed in the solar cycles when the northern hemisphere is dominant. Lower panels show results of the sunspots observed in the solar cycles when the southern hemisphere is dominant.
Download Original Figure

Chang (2011) further reported that centroid1 (or centroid2), at which the double Gaussian function has its maxima, and the sum of sunspot area symbolizing solar activity are apparently correlated. This becomes more obvious when the data point corresponding to solar cycle 19 is excluded. From this it can be inferred that sunspots of a more active cycle tend to emerge at higher latitudes on the whole, as Li et al. (2002) have concluded. According to Chang (2015), the secondary component of the double Gaussian function at higher latitudes seems also to shift, depending on the duration of solar cycle, such that the central position peaks at ~±22.1° for the short cycles and at ~±20.7° for the long cycles with very small errors. This too agrees with earlier claims (cf. Hathaway et al. 2003).

4 RELATED ISSUES

It is well known that the cyclic variations of the Sun’s open magnetic flux modulate the cosmic ray flux reaching the Earth. Cho et al. (2011) investigated the dependence of the amount of observed galactic cosmic ray (GCR) influx on the solar North-South asymmetry. They found that the observed GCR influxes at the Moscow, Kiel, Climax, and Huancayo stations are suppressed when the solar southern hemisphere is more active compared with when the solar northern hemisphere is active. This finding has interesting implications on the terrestrial climate. As such, the decrease in the observed GCR influx may reduce the low-level cloud cover and, consequently, the terrestrial albedo (Svensmark & Friis-Christensen 1997; Egorova et al. 2000; Carslaw et al. 2002; Svensmark 2007). The study of the responses of atmospheric ionization and the global electric circuit to varying GCRs also demonstrate that atmospheric transparency is associated with the GCR flux (Roldugin & Tinsley 2004). Hence, one may suspect that the solar North-South asymmetry plays a role in modulating the temperature anomaly (Georgieva 2002; Georgieva et al. 2005, 2007; Cho et al. 2009). In fact, Cho et al. (2012) have shown that the mean global temperature anomaly is systematically smaller (0.56 in the unit of its standard deviation) during the period when the solar northern hemisphere is more active than the solar southern hemisphere.

Acid rain is any form of precipitation that causes water and soil to become acidic, which is harmful for plants, aquatic animals, and infrastructure (Likens et al. 1979). Acid rain is known to be caused by sulfur dioxide and nitrogen oxide emitted by industrial and transportation sources. However, the actual pathways are very intricate and can be influenced by prevailing atmospheric conditions, such as sunlight, temperature, humidity, and the presence of hydrocarbons, nitrogen dioxides, and particulates in the atmosphere (Wisniewski & Kinsman 1982; Parungo et al. 1987; Cotter et al. 2003; Frey et al. 2005). According to the ice core extracted at Talos Dome in Antarctica, solar cycles were present in the pre-industrial epoch, with a variability of 10–25 % in nitrate content (Zeller & Parker 1981; Zeller & Dreschhoff 1995; Patris et al. 2002; Traversi et al. 2012). In fact, large solar proton events can have quite a sporadic yet very significant impact on the stratospheric nitrogen oxide (NOx) budget (Storini & Damiani 2007; Damiani et al. 2010; Funke et al. 2011). Such attributes encouraged attempts to link solar variability to the chemistry of nitrogen oxide (Logan 1983; Garcia & Solomon 1994). Moon et al. (2014) studied the measured pH in precipitation in the United States and found that precipitation pH data is marginally anticorrelated with the solar North-South asymmetry and is correlated with solar UV radiation.

5 CONCLUSIONS

Sunspots represent one of the most noticeable manifestations of magnetic fields on the solar surface. Since it was discovered, the North-South asymmetry is considered to be one of the most important ingredients in any theoretical model that explains the features of the observed solar magnetic field. The bimodality of the sunspot latitudinal distribution more appropriately characterizes the aspect of the active latitude mentioned earlier. It is also demonstrated that the secondary component of the double Gaussian function may become an indicator of the North-South asymmetry of the solar magnetic field. Explorations of the newly suggested butterfly diagram reveal that the two wings of the butterfly diagram are different from each other. The latitudinal migration of the center-of-latitude does not monotonically proceed. All these findings may point to the conclusion that the solar magnetic field is generated and governed by more than one single process.

The magnetically variable Sun influences the Earth in diverse ways, including the terrestrial magnetic environment. By modulating the GCR influx, the solar North-South asymmetry appears to affect the Earth’s energy balance and influence chemistry in the upper atmosphere. A better understanding of the relation between the spatial distribution of sunspots and the terrestrial climate is required to explain the possible connection between solar variability and terrestrial climate change, in which interest has increased.

ACKNOWLEDGMENTS

This work was supported by BK21 Plus of the National Research Foundation of Korea (22A20130000179) and Heon-Young Chang was supported by a National Research Foundation of Korea Grant funded by the Korean government (NRF-2015M1A3A3A02009155).

References

1.

AntonucciE, HoeksemaJT, ScherrerPH, Rotation of the photospheric magnetic fields: a north-south asymmetry, Astrophys. J.360, 296-304 (1990).

2.

AtaçT, ÖzgüçA, North-south asymmetry in the solar flare index, Sol. Phys.166, 201-208 (1996). https://doi.org/10.1007/BF00179363

3.

AtaçT, ÖzgüçA, Flare index during the rising phase of solar cycle 23, Sol. Phys.198, 399-407 (2001).

4.

BabcockHW, The topology of the Sun’s magnetic field and the 22-year cycle, Astrophys. J.133, 572-587 (1961).

5.

BaiT, SturrockPA, The 154-day and related periodicities of solar activity as subharmonics of a fundamental period, Nature350, 141-143 (1991).

6.

BaiT, SturrockPA, Evidence for a fundamental period of the Sun and its relation to the 154 day complex of periodicities, Astrophys. J. (1993). 409, 476-486https://doi.org/10. 1086/172680

7.

BallesterJL, OliverR, CarbonellM, The periodic behavior of the north-south asymmetry of sunspot areas revisited, Astron. Astrophys.431, L5-L8 (2005).

8.

BerdyuginaSV, UsoskinIG, Active longitudes in sunspot activity: century scale persistence, Astron. Astrophys.405, 1121-1128 (2003).

9.

BrajšaR, WhölH, VršnakB, RuždjakD, SudarD, et al.Differential rotation of stable recurrent sunspot groups, Sol. Phys.206, 229-241 (2002).

10.

CarbonellM, OliverR, BallesterJL, On the asymmetry of solar activity, Astron. Astrophys.274, 497-504 (1993).

11.

CarringtonRC, On Dr. Soemmering's observations of the solar spots in the years 1826, 1827, 1828, and 1829, Mon. Not. R. Astron. Soc.20, 71-77 (1860).

12.

CarslawKS, HarrisonRG, KirkbyJ, Cosmic rays, clouds, and climate, Science298, 1732-1737 (2002).

13.

ChangHY, Variation in north-south asymmetry of sun spot area, J. Astron. Space Sci.a24, 91-98 (2007).

14.

ChangHY, A new method for north-south asymmetry of sun spot area, J. Astron. Space Sci.b24, 261-268 (2007).

15.

ChangHY, Stochastic properties in north-south asymmetry of sunspot area, New Astron.13, 195-201 (2008).

16.

ChangHY, On mode correlation of solar acoustic oscillations, J. Astron. Space Sci.a26, 287-294 (2009).

17.

ChangHY, Periodicity of north-south asymmetry of sunspot area revisited: Cepstrum analysis, New Astron.b14, 133-138 (2009).

18.

ChangHY, Correlation of parameters characterizing the latitudinal distribution of sunspots, New Astron.16, 456-460 (2011).

19.

ChangHYBimodal distribution of area-weighted latitude of sunspots and solar north-south asymmetry, New Astron.17, 247-253 (2012).

20.

ChangHY, Latitudinal distribution of sunspots and duration of solar cycles, J. Korean Astron. Soc.48, 325-331 (2015).

21.

ChangHY, HanJH, Cepstrum analysis of terrestrial impact crater records, J. Astron. Space Sci.25, 71-76 (2008).

22.

ChoIH, ChangHY, Long term variability of the Sun and climate change, J. Astron. Space Sci.25, 395-404 (2008).

23.

ChoIH, ChangHY, Latitudinal distribution of sunspots revis-ited, J. Astron. Space Sci.28, 1-7 (2011).

24.

ChoIH, KwakYS, ChoKS, ChoiHS, ChangHY, On the relation between the Sun and climate change with the solar north-south asymmetry, J. Astron. Space Sci.26, 25-30 (2009).

25.

ChoIH, KwakYS, ChangHY, ChoKS, ParkYD, et al.Depend-ence of GCRs influx on the solar north-south asymmetry, J. Atmos. Sol. Terr. Phys.73, 1723-1726 (2011).

26.

ChoIH, KwakYS, ChangHY, ChoKS, KimYH, et al.The global temperature anomaly and solar north-south asymmetry, Asia-Pac, J. Atmos. Sci.48, 253-257 (2012).

27.

ChoIH, HwangJ, ParkYD, Revisiting solar and heliospheric 1.3-year signals during 1970-2007, Sol. Phys.289, 707-719 (2014).

28.

ChoiKC, ParkMY, KimJH, Auto-detection of halo CME parameters as the initial condition of solar wind prop-agation, J. Astron. Space Sci.34, 315-330 (2017).

29.

ChoudhuriAR, SchüsslerM, DikpatiM, The solar dynamo with meridional circulation, Astron. Astrophys.303, L29-L32 (1995).

30.

CotterESN, JonesAE, WolffEW, BauguitteSJB, What controls photochemical NO and NO2 production from Antarctic snow? laboratory investigation assessing the wavelength and temperature dependence, J. Geophys. Res.108, 4147-4156 (2003).

31.

DamianiA, StoriniM, RafanelliC, DiegoP, The hydroxyl radical as an indicator of SEP fluxes in the high-latitude terrestrial atmosphere, Adv. Space Res.46, 1225-1235 (2010).

32.

DuchlevPI, An estimation of the long-term variation of a north-south asymmetry of the long-lived solar filaments, Sol. Phys.199, 211-215 (2001).

33.

DuchlevPI, DermendjievVN, Periodicities in the N-S asym-metry of long-lived solar filaments, Sol. Phys.168, 205-210 (1996).

34.

EgorovaLV, VovkVYa, TroshichevOA, Influence of variations of the cosmic rays on atmospheric pressure and temperature in the southern geomagnetic pole region, J. Atmos. Sol. Terr. Phys.62, 955-966 (2000).

35.

ForgácsEMajorBBorkovitsTLong-term variation in distribution of sunspot groups, Astron. Astrophys.424, 311-315 (2004).

36.

FreyMM, StewartRW, McConnellJR, BalesRC, Atmospheric hydroperoxides in West Antarctica: links to stratospheric ozone and atmospheric oxidation capacity, J. Geophys. Res.110, D23301-D23317 (2005).

37.

FunkeB, BaumgaertnerA, CalistoM, EgorovaT, JackmanCH, et al.Composition changes after the ?oHalloween ?? solar proton event: the high-energy particle precipitation in the atmosphere (HEPPA) model versus MIPAS data intercomparison study, Atmos. Chem. Phys.11, 9089-9139 (2011).

38.

GarciaHA, Evidence for solar-cycle evolution of north-south flare asymmetry during cycles 20 and 21, Sol. Phys.127, 185-197 (1990).

39.

GarciaRR, SolomonS, A new numerical model of the middle atmosphere. 2. ozone and related species, J. Geophys. Res.99, 12937-12952 (1994).

40.

GeorgievaK, Long-term changes in atmospheric circulation, Earth rotation rate and north-south solar asymmetry, Phys. Chem. Earth27, 433-440 (2002).

41.

GeorgievaK, KirovB, BianchiC, Long-term variations in the correlation between solar activity and climate, Mem. Soc. Astron. Ital.76, 965-968 (2005).

42.

GeorgievaKKirovBTonevPGuinevaVAtanasovDLongterm variations in the correlation between NAO and solar activity: the importance of north-south solar activity asymmetry for atmospheric circulation, Adv. Space Res.40, 1152-1166 (2007).

43.

GigolashviliMS, JaparidzeDR, MdzinarishviliTG, ChargeishviliBB, N-S asymmetry in the solar differential rotation during 1957-1993, Sol. Phys.227, 27-38 (2005). https://doi.org/10.1007/s11207-005-1214-3

44.

GleissbergW, The probable behaviour of sunspot cycle 21, Sol. Phys.21, 240-245 (1971).

45.

HaleGE, On the probable existence of a magnetic field in sun-spots, Astrophys. J.28, 315-343 (1908).

46.

HansenSF, HansenRT, Differential rotation and reconnection as basic causes of some coronal reorientations, Sol. Phys.44, 503-508 (1975).

47.

HathawayDH, NandyD, WilsonRM, ReichmannEJ, Evidence that a deep meridional flow sets the sunspot cycle period, Astrophys. J.589, 665-670 (2003).

48.

HowardR, Studies of solar magnetic fields. III - the east-west orientation of field lines, Sol. Phys.38, 275-287 (1974).

49.

HoweR, Christensen-DalsgaardJ, HillF, KommRW, LarsenRM, et al.Dynamic variations at the base of the solar convection zone, Science287, 2456-2460 (2000).

50.

HwangJKimHParkJLeeJLimitations of electromagnetic ion cyclotron wave observations in low earth orbit, J. Astron. Space Sci.35, 31-37 (2018).

51.

IchimotoK, KubotaJ, SuzukiM, TohmuraI, KurokawaH, Periodic behaviour of solar flare activity, Nature316, 422-424 (1985).

52.

JoshiBJoshiAThe north-south asymmetry of soft X-ray flare index during solar cycles 21, 22 and 23, Sol. Phys.219, 343-356 (2004).

53.

JoshiB, PantP, Distribution of HI flares during solar cycle 23, Astron. Astrophys.431, 359-363 (2005).

54.

KimBY, ChangHY, Short periodicities in latitudinal variation of sunspots, J. Astron. Space Sci.28, 103-108 (2011).

55.

KimG, KimYS, LeeYS, Mesospheric temperatures over Apache Point Observatory (32A N, 105A W) derived from Sloan digital sky survey spectra, J. Astron. Space Sci.a34, 119-125 (2017).

56.

KimJHChangHYSpectral analysis of geomagnetic activity indices and solar wind parameters, J. Astron. Space Sci.31, 159-167 (2014).

57.

KimJHKimKBChangHYSolar influence on tropical cyclone in Western North Pacific ocean, J. Astron. Space Sci.34, 257-270 (2017). b

58.

KimS, YiY, HongIS, SohnJ, Solar insolation effect on the local distribution of lunar hydroxyl, J. Astron. Space Sci.35, 47-54 (2018).

59.

KitchatinovLL, Do dynamo-waves propagate along isorotation surfaces?Astron. Astrophys.394, 1135-1139 (2002).

60.

KnaackR, StenfloJO, BerdyuginaSV, Periodic oscillations in the north-south asymmetry of the solar magnetic field, Astron. Astrophys.418, L17-L20 (2004).

61.

KnaackR, StenfloJO, BerdyuginaSV, Evolution and rotation of large-scale photospheric magnetic fields of the Sun during cycles 21-23. periodicities, north-south asymmetries and r-mode signatures, Astron. Astrophys.438, 1067-1082 (2005).

62.

KrauseF, RädlerKH, Mean-field magnetohydrodynamics and dynamo theory. (Oxford, Pergamon1980)..

63.

KrivovaNA, SolankiSK, The 1.3-year and 156-day periodicities in sunspot data: wavelet analysis suggests a common origin, Astron. Astrophys.394, 701-706 (2002).

64.

LeeEHLeeDYParkMYClimate events and cycles during the last glacial-interglacial transition, J. Astron. Space Sci.34, 207-212 (2017).

65.

LeightonRB, A magneto-kinematic model of the solar cycle, Astrophys. J.156, 1-26 (1969).

66.

LiKJ, SchmiederB, LiQS, Statistical analysis of the X-ray flares (M 3 1) during the maximum period of solar cycle 22, Astron. Astrophys. Suppl. Ser.131, 99-104 (1998).

67.

LiKJ, LiangHF, YunHS, GuXM, Statistical behavior of sunspot groups on the solar disk, Sol. Phys.205, 361-370 (2002).

68.

LiKJ, WangJX, ZhanLS, YunHS, LiangHF, et al.On the latitudinal distribution of sunspot groups over a solar cycle, Sol. Phys.215, 99-109 (2003).

69.

LikensGE, WrightRF, GallowayJN, ButlerTJ, Acid rain, Sci. Am.241, 43-51 (1979).

70.

LoganJA, Nitrogen oxides in the troposphere: global and regional budgets, J. Geophys. Res.88, 10785-10807 (1983).

71.

MaunderEW, Note on the distribution of sun-spots in helio-graphic latitude, 1874 to 1902, Mon. Not. R. Astron. Soc.64, 747-761 (1904).

72.

MoonGH, HaGY, KangSH, LeeBH, KimKB, et al.Acidity in precipitation and solar north-south asymmetry, J. Astron. Space Sci.31, 325-333 (2014).

73.

MouradianZ, Soru-EscautI, On the dynamics of the largescale magnetic fields of the sun and the sunspot cycle, Astron. Astrophys.251, 649-654 (1991).

74.

NandyD, ChoudhuriAR, Toward a mean field formulation of the Babcock-Leighton type solar dynamo: I. α-coefficient versus Durney’s double-ring approach, Astrophys. J.551, 576-585 (2001).

75.

NewtonHW, MilsomAS, Note on the observed differences in spottedness of the Sun's northern and southern hemi-spheres, Mon. Not. R. Astron. Soc.115, 398-404 (1955).

76.

ObridkoVN, SheltingBD, Occurrence of the 1.3-year periodicity in the large-scale solar magnetic field for 8 solar cycles, Adv. Space Res.40, 1006-1014 (2007).

77.

OliverR, BallesterJL, The north-south asymmetry of sunspot areas during solar cycle 22, Sol. Phys.152, 481-485 (1994).

78.

OssendrijverAJH, HoyngP, SchmittD, Stochastic excitation and memory of the solar dynamo, Astron. Astrophys.313, 938-948 (1996).

79.

ÖzgüçA, ÜcerC, North-south asymmetries in the green corona brightness between 1947 and 1976, Sol. Phys.114, 141-146 (1988).

80.

ParkJ.H, ChangHY, Drought over Seoul and its association with solar cycles, J. Astron. Space Sci.30, 241-246 (2013).

81.

ParkerEN, Hydromagnetic dynamo models, Astrophys. J.122, 293-314 (1955).

82.

ParkerEN, The generation of magnetic fields in astrophysical bodies. I. the dynamo equations, Astrophys. J.162, 665-673 (1970).

83.

ParungoFNagamotoCMaddlRA study of the mechanisms of acid rain formation, J. Atmos. Sci.44, 3162-3174 (1987).

84.

PatrisN, DelmasR, LegrandM, de AngelisM, FerronFA, First sulfur isotope measurements in central Greenland ice cores along the preindustrial and industrial periods, J. Geophys. Res.107, 4115-4125 (2002).

85.

PulkkinenPJ, BrookeJ, PeltJ, TuominenI, Long-term variation of sunspot latitudes, Astron. Astrophys.341, L43-L46 (1999).

86.

RiegerE, ShareGH, ForrestDJ, KanbachG, ReppinC, et al.A 154-day periodicity in the occurrence of hard solar flares?Nature312, 623-625 (1984).

87.

RolduginVC, TinsleyBA, Atmospheric transparency changes associated with solar wind-induced atmospheric electri-city variations, J. Atmos. Sol. Terr. Phys.66, 1143-1149 (2004).

88.

RoyJR, The north-south distribution of major solar flare events, sunspot magnetic classes and sunspot areas (1955- 1974), Sol. Phys.52, 53-61 (1977).

89.

SchlammingerL, Hemispherical asymmetries in sunspot areas and auroral frequencies, Sol. Phys.135, 407-413 (1991).

90.

SchwabeSH, Die Sonne, Astron. Nachr.20, 283-288 (1843).

91.

SolankiSK, WenzlerT, SchmittD, Moments of the latitudinal dependence of the sunspot cycle: a new diag-nostic of dynamo models, Astron. Astrophys.483, 623-632 (2008).

92.

StoriniM, DamianiA, Effects of the January 2005 GLE/SPE events on minor atmospheric components, Proceedings of the 30th International Cosmic Ray Conference, Merida, Yucatan, Mexico 3-11 July2007.

93.

SvensmarkHCosmoclimatology: a new theory emerges, Astron. Geophys.48, 1.18-1.24 (2007).

94.

SvensmarkH, Friis-ChristensenE, Variation of cosmic ray flux and global cloud coverage—a missing link in solar-climate relationships, J. Atmos. Sol. Terr. Phys.59, 1225-1232 (1997).

95.

SwinsonDB, KoyamaH, SaitoT, Long-term variations in north-south asymmetry of solar activity, Sol. Phys.106, 35-42 (1986).

96.

TemmerM, VeronigA, HanslmeierA, OtrubaW, MesserottiM, Statistical analysis of solar Hα flares, Astron. Astrophys.375, 1049-1061 (2001).

97.

TemmerM, VeronigA, HanslmeierA, Hemispheric sunspot numbers Rn and Rs: catalogue and N-S asymmetry analysis, Astron. Astrophys.390, 707-715 (2002). https://doi.org/10.1051/0004-6361:20020758

98.

TemmerM, RybákJ, BendikP, VeronigA, VoglerF, et al.Hemispheric sunspot numbers Rn and Rs from 1945-2004: catalogue and N-S asymmetry analysis for solar cycles 18- 23, Astron. Astrophys.447, 735-743 (2006).

99.

TernulloM, The butterfly diagram fine structure, Sol. Phys.240, 153-164 (2007). a

100.

TernulloM, Looking inside the butterfly diagram, Astron. Nachr.328, 1023-1032 (2007). b

101.

TernulloM, The butterfly diagram internal structure, Astrophys. Space Sci.328, 301-305 (2010).

102.

TraversiR, UsoskinIG, SolankiSK, BecagliS, FrezzottiM, et al.Nitrate in polar ice: a new tracer of solar variability, Sol. Phys.280, 237-254 (2012).

103.

TritakisVP, MavromichalakiH, PetropoulosB, Asymmetric variations of the coronal green line intensity, Sol. Phys.115, 367-384 (1988).

104.

VermaVK, On the increase of solar activity in the southern hemisphere during solar cycle 21, Sol. Phys.114, 185-188 (1988).

105.

VermaVK, On the north-south asymmetry of solar activity cycles, Astrophys. J.403, 797-800 (1993).

106.

VernovaES, MursulaK, TyastoMI, BaranovDG, A new pattern for the north-south asymmetry of sunspots, Sol. Phys.205, 371-382 (2002).

107.

VizosoG, BallesterJL, Periodicities in the north-south asymmetry of solar activity, Sol. Phys.119, 411-414 (1989).

108.

VizosoG, BallesterJL, The north-south asymmetry of sunspots, Astron. Astrophys.229, 540-546 (1990).

109.

WaldmeierM, The asymmetry of solar activity in the years 1959-1969, Sol. Phys.20, 332-344 (1971).

110.

WhiteOR, TrotterDE, Note on the distribution of sunspots between the north and south solar hemispheres and its variation with the solar cycle, Astrophys. J. Suppl. Ser.33, 391 (1977).

111.

WisniewskiJ, KinsmanDJ, An overview of acid rain monitoring activities in north America, Bull. Am. Meteorol. Soc.63, 598-618 (1982).

112.

YiW, The north-south asymmetry of sunspot distribution, J. R. Astron. Soc. Can.86, 89-98 (1992).

113.

YoshimuraH, Solar-cycle dynamo wave propagation, Astrophys. J.201, 740-748 (1975).

114.

ZellerEJ, ParkerBC, Nitrate ion in Antarctic firn as a marker for solar activity, Geophys. Res. Lett.8, 895-898 (1981).

115.

ZellerEJ, DreschhoffGAM, Anomalous nitrate concentrations in polar ice cores - do they result from solar particle injections into the polar atmosphere?Geophys. Res. Lett.22, 2521-2524 (1995).

116.

ZharkovSI, ZharkovaVV, Statistical analysis of the sunspot area and magnetic flux variations in 1996-2005 extracted from the solar feature catalogue, Adv. Space Res.38, 868-875 (2006).

117.

ZolotovaNV, PonyavinDI, Phase asynchrony of the north-south sunspot activity, Astron. Astrophys.449, L1-L4 (2006).