


1 INTRODUCTION
Formation flying offers benefits in many aspects, such as development period, launch cost, and performance, by replacing a single large spacecraft with several small spacecraft. However, in order to improve the performance of formation flying missions, it is necessary to operate spacecraft more precisely than a single spacecraft operation. Therefore, various research has been conducted to improve the accuracy of relative pose estimation between spacecraft.
The vision sensor provides relative pose information and is mainly used at short distances. Generally, it is relatively inexpensive compared to sensors such as lidar and radar. In addition, shorter relative distance means higher estimation accuracy. Therefore, the vision sensor is considered to be a powerful and promising sensor for proximity operation. As an example, recent proximity operations of Shenzhou-9 and Tiangong-1, as well as the docking of the spacecraft were carried out using a vision sensor (Xie et al. 2013). NASA employed an CCD optical sensor to install the SPHERES autonomous docking module, and utilized it to verify performance of the vision sensor in space (Saenz-Otero & Miller 2005) and conduct various studies (Olivieri et al. 2017).
Vision-based relative pose estimation has been generally performed using line of sight (LOS) vector measurement (Junkins et al. 1999). The relative state between spacecraft can be estimated by using the nonlinear least squares method (Junkins et al. 1999) or the extended Kalman filter (Kim et al. 2007). In addition, a study was conducted for estimation of both the state of a chief and a deputy satellite based on chief coordinates rather than local vertical and local horizontal (LVLH) coordinates (Zhang et al. 2014). Previous studies applied the extended Kalman filter with zero-mean Gaussian with white noise as dynamic model error. Thus, it is possible to estimate orbital elements of a chief spacecraft, as well as the relative pose, if the initial state error is not too large. However, the vision sensor provides only relative information, such that estimation of absolute orbital elements using idealized error is not convenient. It is confirmed that the relative position estimation accuracy decreases remarkably when considering nonlinear perturbations (Lee & Pernicka 2011). In this study, a projected circular orbit (PCO) formation flying scenario was implemented by applying nonlinear perturbations and possible degradation of the sensor resolution in reality.
Vision-based relative pose estimation can be utilized for satellite formation flying with relative navigation methods. The relative position of satellites can be determined using only GPS measurements (Sim et al. 2009) or laser measurements, which consist of range and direction data (Jung et al. 2012;Lee et al. 2018). Moreover, the relative position can be determined employing a laser in combination with GPS data (Lee et al. 2015;Oh et al. 2016). With relative position and relative pose estimation, the precise formation flying technologies, such as the proximity operation, rendezvous, or docking, become feasible. Navigation algorithms for vision-based relative pose estimation can be derived from the filtering algorithms for absolute satellite navigation (Kim et al. 2017, Lee et al. 2017a;Lee et al. 2017b).
Since it takes a lot of effort to verify formation flying technology in space, validation through a test-bed on the ground is regarded as the most reasonable alternative. A lot of research has been conducted using test-beds to obtain high stability and environmental similarity to space environments. In Texas A&M, a vision-based state estimation system, VisNav, was installed on a 2- Degrees-of-freedom (DOF) air bearing test bed (Du 2004). The MIT MVDS also performed ground validation through a 3-DOF air bearing test bed (Rodgers 2006). In Yonsei, the Autonomous Spacecraft Test Environment for Rendezvous In proximity (ASTERIX) consists of an aluminum table, main computer, and two spacecraft simulators (Eun et al. 2018). ASTERIX can be used to perform a feasibility assessment on a number of systems, which will be on a space.
In this study, pose alignment was implemented by the vision system in numerical simulations to verify the feasibility of the system, i.e., that it can be applied to satellite formation flying. The influence of external environmental factors on the performance of formation flying was analyzed, while checking the estimation and control accuracy according to the level of observation error. In order to improve the relative position estimation accuracy even in the presence of nonlinear perturbation, we proposed a performance improvement by combination with a laser sensor. This will serve to supplement the existing algorithm, as the estimation performance declines with larger relative distances, suggesting the possibility of expanding the relative distance range of the formation flying that utilizes the vision sensor. By carrying out performance verification through hardware experiments, we confirmed that the constructed algorithm is applicable in a real environment in the presence of various disturbing factors. In addition, we investigated the reason behind the difference between the results of numerical simulations and hardware experiment and laid the basis for constructing algorithms that can be applied to real environments more pragmatically.
2 VISION-BASED MEASUREMENT SYSTEM
A measurement model of the estimation algorithm was constructed using a vision sensor, a laser distance meter, and a gyro sensor.
The vision system consists of a CMOS video camera (Table 1), a red 5 mm circular LED, and the estimation algorithm. The camera in tracking spacecraft recognizes four LEDs attached to the target spacecraft and saves their positions on the CMOS image plane. The camera generates a gray scale 2D image with a fixed shutter speed and focal length. If we construct a vector from the position at which the light is focused to the center of the lens, the measurement can be written as follows (Alonso et al. 2000).
In Eq. (1), is the i-th measurement, and A is the transformation matrix from the initial coordinate system to the sensor coordinate system. are coordinates of the i-th LED with respect to the target spacecraft, and are coordinates of the target spacecraft with respect to the tracking spacecraft. The coordinates can be expressed in the LVLH coordinate system, the ECI (Earth-Centered Inertial) coordinate system, and the body-fixed coordinate system of the target spacecraft, etc. The measurement noise matrix of the Gaussian-distributed error was proven to be a diagonal matrix with diagonal components of the error variance as in Eq. (2) (Cheng et al. 2005).
Information provided by the vision sensor consists of projected LED positions on the CCD detector and the image size for image processing (Fig. 1). The LEDs have to be sufficiently brighter than surrounding lights, but at the same time should have moderate intensities to reduce measurement error due to inter-LED interference or light blur. This is achieved by adjusting camera aperture. The wavelength of the LEDs was selected in visible light range to minimize interference with infrared markers.
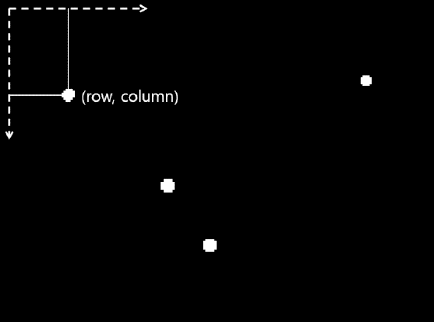
The measurement values of the vision system consist of row and column positions in an image plane, whereas the LEDs have 3D position information in 3D space. Therefore, the matching does not always fulfill a one-to-one correspondence, such that a singularity problem can occur easily (Fig. 2). Singularity arises when all of the LEDs are placed on one plane (Rodgers 2006). Therefore, the minimum number of LEDs to avoid the singularity is four.
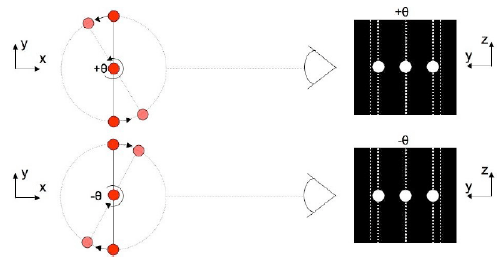
Considering the viewing angle, all LEDs were positioned to be projected within 80 % of the image size when the camera and LED were located at the closest distance (Fig. 3). When the distance between the camera and the LEDs center is 5 cm, the dimensions of the LED configuration are 15 cm in width and 8 cm in height. The estimation accuracy with respect to the number and distribution of LEDs was discussed in detail in (Xing et al. 2010).
Calibration is a process of experimental and numerical determination for an actual focal length. This is an indispensable process that derives the internal matrix of the measurement model. The process numerically estimates internal parameters using several grid images (Zhang 2000). In this study, we used the GML C ++ Camera Calibration Toolbox v 0.72 beta developed by Graphics and Media Lab of National University of Moscow (http://graphics.cs.msu.ru/en/node/909). By calibration, we obtain the radial distortion, tangential distortion coefficient, a position for the principal point, and pixel error, as well as the focal length. The most influential variable is the focal length, which needs to be obtained every time the camera settings are changed.
An image obtained with a camera gives different 2D information depending on parameter settings such as hue, brightness, and saturation. In order to extract the desired measurement, a cutoff process is necessary (Fig. 4). By the cutoff process, the number of observed objects is obtained at every capture and the cutoff value is adjusted repeatedly until the desired number is achieved. In this process, if the difference between successive positions of the object, LED, has a value larger than a specified value, failure is declared and passed to the next step. If failures are declared continuously, some action should be taken such as reducing surrounding lights by adjusting the experimental environment.
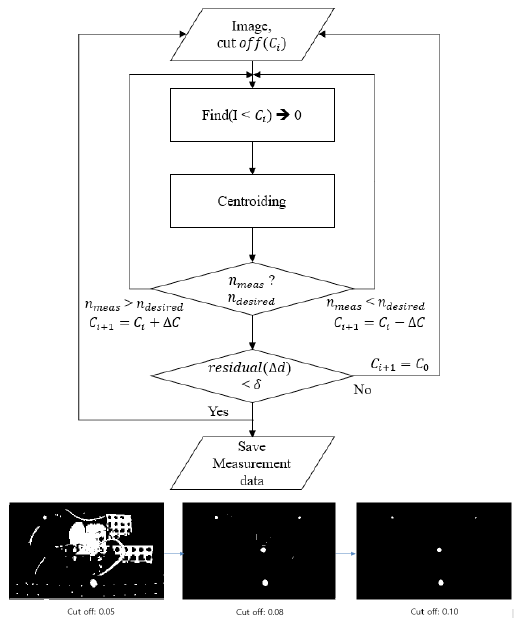
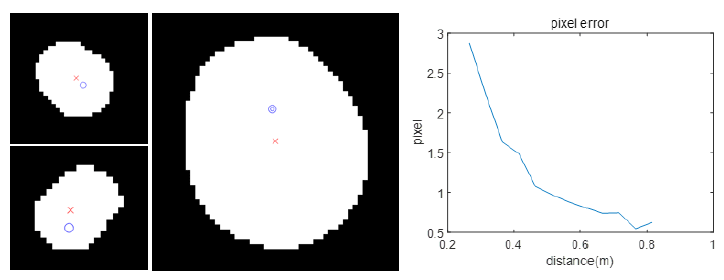
The center points of the LEDs are found in the LED image after cutoff (Fig. 1) by extracting the center of mass of the concentrated pixels. In the LED structure, a hemispherical part emitting light contains a filament in itself. Therefore, image distortion of the LED becomes larger with the increase in lateral distance between the center of the lens and the LED. The effect of image distortion on the observation error is shown in Fig. 5. If the relative distance in the line of sight direction is larger than 1 m, the observation error is less than 1 pixel. In a previous study using the measurement model of Eq. (3.3) and the Position Sensitive Diode (PSD), the authors assumed an observation error of 0.3 – 0.5 pixels (Crassidis et al. 2000). We assumed observation errors of 0.1 – 5 pixels to analyze the estimation accuracy with respect to the level of observation errors. The observation error was set to less than 1 pixel in the PCO formation flying scenario.
The gyro sensor, which measures the angular velocity of the spacecraft, was applied to the filter and the relative attitude estimation. The angular velocity measured by the gyro includes drift and instability error, in addition to the actual angular velocity of the body. The gyro drift error is divided into white noise and a bias error. The instability error is divided into electric noise and a quantization error component. In this study, the most common gyro model, the first Markov process, was applied (Crassidis & Junkins 2004).
In Eq. (3), nv and nu depict Gaussian white noise with an average of zero and spectral densities of , respectively. β denotes the drift error vector, and is the measured angular velocity. The angular velocity can be estimated by propagating the attitude in Eq. (12).
The laser distance meter measures relative distance from the sensor to the object in the direction of the laser line of sight (Fig. 6). The device can measure relative distance at a rate of up to 50 Hz. The measurement model of the laser distance meter is as follows (Shin 2016).
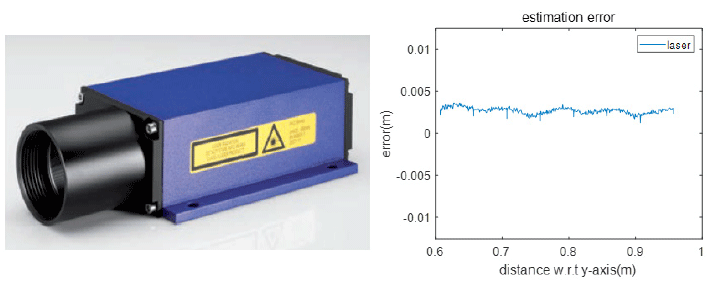
In Eq. (4), is the matrix for converting the coordinate system depicted by Rx, Ry, Rz to the laser coordinate system. The line of sight of the laser coincides with the -axis of the laser coordinate system. It is assumed that the observed values can be obtained when the angle between the x-axis of the laser coordinate system and the position vector pointing from the laser to the target spacecraft is within rad. Therefore, in order to employ the laser, the alignment must be implemented by the vision sensor and the gyro sensor. The inherent measurement error of this equipment is within 5 mm (Fig. 6).
3 VISION-BASED RELATIVE POSE ESTIMATION
The relative state between two spacecrafts can be estimated by using the nonlinear least squares method (Junkins et al. 1999) or the extended Kalman filter (Kim et al. 2007), both of which utilize the line of sight vector for measurement. The nonlinear least squares method provides a simple estimation solution by means of a numerical algorithm, but becomes inaccurate with large measurement noise.
The measurement model was constructed through the relationship between relative poses and expected measurements derived from lens equations and triangulation (Rodgers 2006). Using actual measurements, we can obtain the numerical solution of the rotation matrix, which involves the relative pose.
On the other hand, the extended Kalman filter can speed up the calculation and improve accuracy as precision of the dynamic model increases (Junkins et al. 1999). Therefore, it is possible to estimate the state between two spacecrafts on-line with the extended Kalman filter.
To estimate the initial relative pose between two spacecrafts without prior information, Eq. (1) is solved iteratively with the current measurement only. As this is a nonlinear optimization problem with no constraints, we applied the Levenberg-Marquardt method, which is a nonlinear least squares method (More 1977). It is necessary to match the position of the LED with the projected position on the image plane, so that a solution converges by iterative calculation. Therefore, we terminate the numerical calculation to obtain a final solution when a solution with a residual of less than 10 pixels is presented with a corresponding combination.
In the case of the extended Kalman filter, the measurement noise matrix is a diagonal matrix with diagonal components of the covariance of the observation error. When propagating trajectories through the relative orbital equation, a diagonal matrix with components of acceleration disturbances can be used as the process noise matrix (Kim et al. 2007). Nevertheless, we used Eq. (5), which describes an absolute orbital motion, to check the effect of nonlinear perturbation apart from white noise. Thereby, we found a proper process noise matrix by trial and error, in order to match standard deviation derived from the filter with the state error derived from reference state.
In addition to Earth’s gravity, spacecrafts in Earth orbit are also affected by Earth’s non-spherical perturbations, atmospheric drag, 3rd body perturbations, and solar radiation pressure. The absolute equations of motion including these perturbations are as follows (Vallado 2014).
In Eq. (5), the position vector of the spacecraft is depicted by , and μ is the Earth gravitational constant, while represent accelerations due to the non-spherical perturbation, the atmospheric friction, the 3rd body gravitational perturbation, and the solar radiation pressure, respectively. The state vector propagated through the above equation was regarded to be the true value and used as a reference to be compared to the estimated value in order to evaluate estimation performance.
The attitude of the spacecraft was represented by a quaternion value. The angular velocity was represented in three axes of the body fixed coordinate system. The attitude dynamic model is expressed as follows (Zhang et al. 2014).
In these expressions (6), the attitude and the angular velocity with respect to the inertial coordinate system are described in a body-fixed coordinate system. The derivative of the angular velocity can be obtained as follows.
The attitude and the angular velocity are calculated by state equations Eq. (6) and (7). The torque includes the gravity gradient torque and control torque of a spacecraft. The attitude and angular velocity of the two spacecrafts are propagated in an inertial frame, and then the true value of the relative attitude is generated by the quaternion relationship as follows.
In Eq. (8) are quaternions representing a deputy spacecraft, a chief spacecraft, and the relative attitude of the deputy spacecraft with respect to the chief spacecraft, respectively. The symbol ‘⊗’ denotes quaternion multiplication.
The Jacobian matrix F of the filter was derived from Eq. (5). The dynamic model of the filter includes J2 perturbation. The orbit control includes an input error of about 10 %, which is a realistic value of the simulator thruster. The result could be seen in the numerical simulation of docking, which appeared to be working properly.
An absolute equation of motion was mainly used for estimation with a sensor that gave the absolute attitude with respect to the inertial reference frame. Thus, it can also be implemented for the estimation of the spacecraft simulator, since the reference coordinate system is assumed to be inertial. The linearized state equation was constructed through Eq. (6) and Eq. (7). It is assumed that a torque in Eq. (7) comprises an error of about 10 % of the control input. Detailed matrices in the filter are not described in this paper because of their simplicity.
Relative pose estimation with respect to a rotating coordinate frame requires relative equations of motion. Here, we describe the relative pose estimation method based on the LVLH coordinate system (Zhang et al. 2014). This method is used in the numerical simulation of PCO scenarios.
If the relative distance between spacecraft is much smaller than the orbital radius of the spacecraft, it is convenient to establish the relative orbital equations representing the relative coordinates of the deputy spacecraft with respect to the chief orbital coordinate system (LVLH). If the trajectory of the chief orbit is a circle, the relative equation of motion is simplified to the following Clohessy-Wiltshire (CW) equation (Schaub & Junkins 2002).
In Eq. (9), x, y, z are relative position components in the LVLH coordinate system, and f is the orbital angular velocity.
The relative attitude equation is expressed with the relative quaternion obtained by Eq. (8). It can be expressed as Eq. (10) (Lefferts et al. 1982).
The subscripts c and t in Eq. (10) refer to the reference and the other spacecraft, respectively. It was shown that Eq. (10) is identical to the following kinetic equations (Xing et al. 2001).
Here, we can use some of the quaternion relations in (Kim et al. 2007). Therefore, the discrete equation of propagation is given as follows.
Eq. (12) assumes that angular velocities are constant during the time interval. Propagation error increases as the time interval is lengthened, or when the torque and changes in angular velocities are large. We constructed a state equation which includes the relative position, velocity, orbital elements, and derivative values of the orbital elements (Zhang et al. 2014). Then, since the estimation for absolute orbital components is meaningless when the true value is propagated with nonlinear perturbations, absolute orbital components and their derivatives are omitted. The state equation can be constructed as follows.(13)
The sensitivity matrix of the filter is also related to the relative equations of motion. The measurement of the vision sensor has the following relationship with the relative pose.
Therefore, the relative position can be estimated from the vision-based measurement. To estimate both relative position and attitude, we use Eq. (14) in conjunction with the attitude model.
The relative attitude equation of the filter is slightly different from the absolute one. First, Eq. (11) has a similar shape to Eq. (6). Using relations of Eq. (11) and some relations of quaternion, the relative attitude equation is summarized as follows.(15)
The angular velocity error is defined as follows.
In Eq. (16), the subscript H denotes the component of the LVLH coordinate system. The angular velocity error of Eq. (16) can be expressed using the gyro sensor model of Eq. (3).(17)
With the following procedures in (Kim et al. 2007), the state equations can be constructed as follows.(18)
The error state vector constructed by both the relative orbit dynamics and the attitude equation of motion is defined as follows.(19)
Therefore, the overall error state equation can be summarized as the following Eq. (20).
Eq. (20) represents the relative attitude of the primary and secondary spacecraft, chief and deputy, with respect to the rotational coordinate system (LVLH). The relative attitude between two spacecrafts can be obtained by quaternion calculation. Since no orbital control is applied in the PCO formation flying scenario, information on thrust control is not required. If nonlinear perturbation is added to the dynamics, the absolute orbital estimation of the main spacecraft becomes meaningless. As can be seen from the matrix H in Eq. (20), absolute orbital elements do not affect the measurement value and only have an effect on the propagated state of each spacecraft. Therefore, in the PCO formation flying scenario with nonlinear perturbations, the error state vector is modified as follows.
3 RESULTS
In this scenario, the target (chief) spacecraft with attached LEDs was orbiting a low earth orbit. The scenario assumed that a tracking (deputy) spacecraft, equipped with a camera, was about 6 m away from the chief and approaching to dock with the target. A classical PD controller was used in this simulation. The reference orbital model was based on absolute equations of motion in Eq. (5), including JGM 2020, 3rd body perturbation of the moon and the sun, atmospheric friction, and solar radiation pressure. The absolute attitude model in Eq. (6) and (7) including control input error and gravity gradient torque were used in this scenario. The dynamic model in the filter used the absolute trajectory model in Eq. (5), and the absolute attitude model in Eq. (6) and (7), as same as reference model but excluded error components.
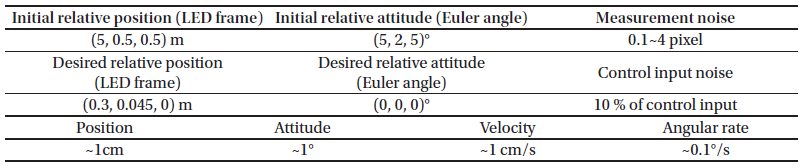
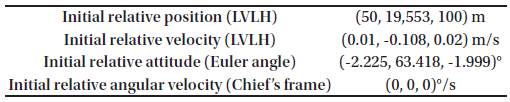
The docking aimed at reaching the required state starting from the initial state. The relative distance between the camera and the LEDs center was 0.3 m at the required position, and attitudes of the tracking spacecraft and the target spacecraft were aligned. A 10 % control error for PD control was applied. The P and D gain of the attitude control were set to 0.1 and 0.04, respectively, and the P gain and the D gain of the trajectory control were set to 2 and 7, respectively. The measurement error was varied from 0.1 pixel to 5 pixels. The docking requirement (Wigbert 2008) determining the success of the docking mission was considered and simulation results were compared with these values. The initial values of relative pose between spacecraft and docking requirements are shown in Table 2. The initial state was set within the range in which the vision sensor can detect all the LEDs. The initial relative position, velocity, attitude, and angular velocity errors were set to [1, 0.5 0.5] m, [0.1, 0.1, 0.1] m, [1 1 1]°, and [1 1 1] °/s, respectively.
We found that estimation errors converged at around 200 s for all cases in the measurement error of 0.1 – 5 pixels for given initial conditions. The sum of the three sigma values of both the control and estimation error was considered as the total accuracy of the procedure.
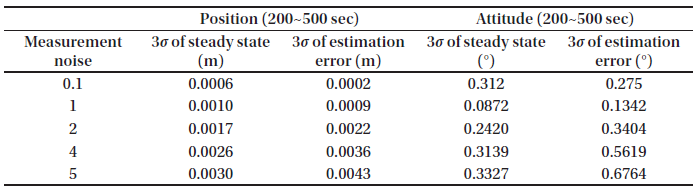
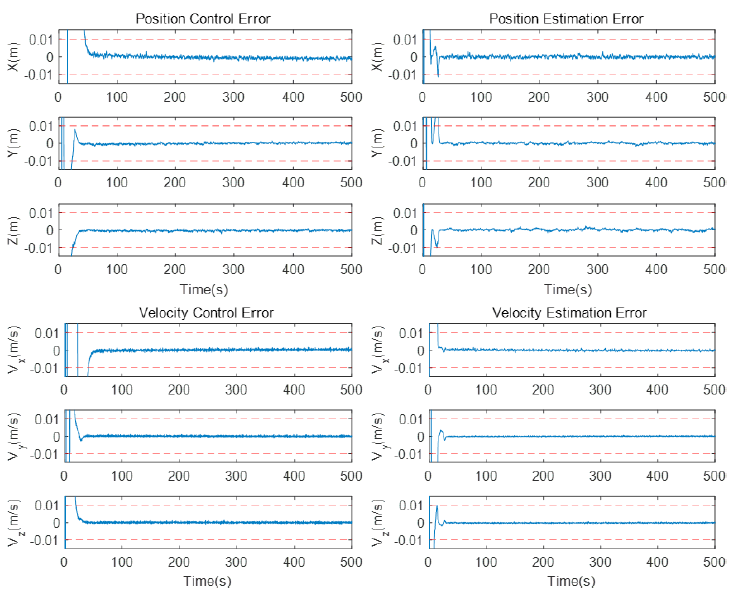
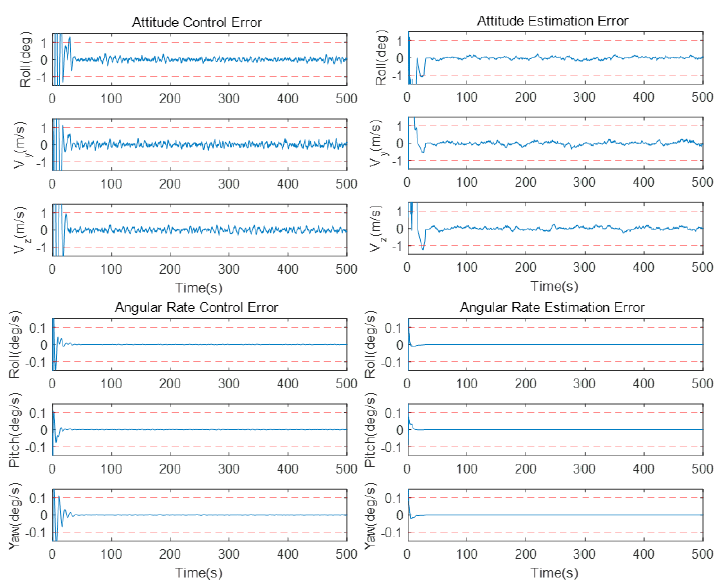
Table 3 illustrates the position, velocity estimation error, and control error in the case of a measurement error of 1 pixel, and shows that requirements were satisfied. Three sigma of relative position estimation error was 0.0009 m and three sigma of control error was 0.0010 m. Thus, the total accuracy was about 0.0019 m, which satisfied the docking requirement (Fig. 7). Three sigma of the attitude estimation error was 0.1342°, and the three sigma of the attitude control error was 0.0872° (Fig. 8). Therefore, all required accuracies were satisfied. In Table 3, it can be seen that the measurement error increases with an increase in both the control and the estimation error. Moreover, if the measurement error exceeds 5 pixels, the attitude control and estimation performance do not meet the requirement. However, the position accuracy still meets the docking requirement. Therefore, docking using the vision system should be carefully handled with respect to the attitude accuracy.
|
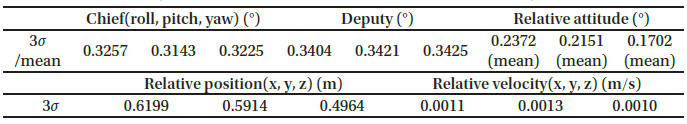
The PCO at low Earth altitude had a projection radius of 100 m. Previous studies have used PSD with a standard deviation error of 0.0005° (Zhang et al. 2014). This corresponds to 0.01 pixel on a sensor with 8 mm focus length. We set the measurement error as 1/3 pixel, which was experimentally confirmed with the CMOS vision sensor used for ASTERIX. The orbital model of the filter applied the relative orbital in Eq. (9). With initial values satisfying the condition of Eq. (22), the orbit was designed to perform relative orbital motion for a sufficiently long period without any orbit control. The relative pose was estimated through the extended Kalman filter in Eq. (20).
In order to detect LEDs even at longer distances, the space between each LED was adjusted to be 10 times wider than in the docking scenario (Fig. 3). Thus, the lateral and vertical width of the LED structure were set to be 1.5 m and 0.8 m, respectively. The initial relative pose of the PCO scenario is shown in Table 4. The bias error of the gyro sensor was set to be 1°/hr for each axis, and the initial error of the position and attitude was set to be 1m and 1°. The initial covariance matrix consisted of a relative position 5I3×3m2, a relative attitude of I3×3deg2, a gyro bias of each satellite 4I3×3(deg/h2), and a diagonal matrix with relative velocity 0.02I3×3(m/s2). For a given initial condition, attitude estimation errors of the two spacecrafts converged in about 50 minutes. The dotted line in Fig. 7 represents the 3 sigma of accuracy. The attitude estimation error of each satellite was less than 1°, and 3 sigma was also less than 1°. The estimated value of the bias of the gyro sensor converged efficiently to the true value 1°/hr at around 50 minutes. The relative attitude estimation error was less than 1°.
The estimation results by numerical simulations are shown in Table 5. The relative position was estimated with a precision of less than 1 m, and the velocity with a precision of less than 5 mm/s. Compared with the docking scenario, it was seen that the error increased by several times or several tens of times. The result reveals that estimation accuracy becomes lower as the relative distance between spacecraft increases.
|
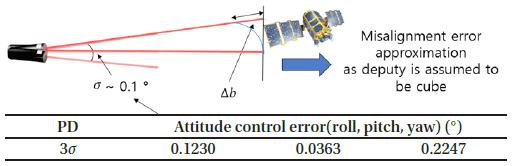
On the other hand, since the laser distance meter provides distance information in the direction of line of sight, it is suitable as a sensor for supplementing the vision sensor. The attitude estimation information required for the laser distance meter can be obtained through the vision system. Therefore, the PD controller uses the estimated attitude information of the vision system. The 3 sigma of the attitude control error is shown in Fig. 9. Considering the attitude control error of steady state and the relative distance, the alignment error of the laser was less than 1 m. Therefore, it is assumed that after the attitude control reaches the steady state, the laser distance measurement can be continuously received. The error of the equipment itself was assumed to be around 5 mm, which was obtained from the experiment (Fig. 6). We constructed the extended Kalman filter with the measurement model of laser distance meter in Eq. (4).
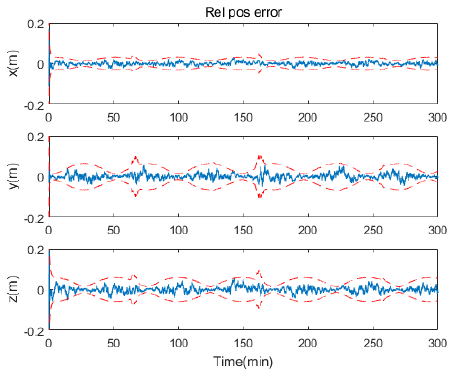
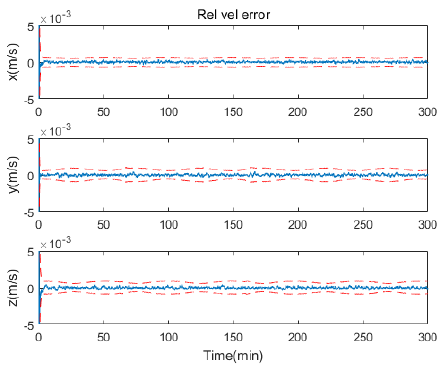
Figs. 10 and 11 depict results of the estimation algorithm supplemented by the laser distance meter. The graphs show that the relative position and velocity estimation accuracy improved. The accuracy of the position estimation shown in the LVLH coordinate system improved by about 10 times from 0.5 m to 0.05 m. The 3 sigma of the position error of the X, Y and Z axes in the LVLH coordinate system was 0.0246 m, 0.0428 m and 0.0421 m respectively, and the 3 sigma of the velocity estimation error was 0.0006 m/s, 0.0008 m/s, and 0.0007 m/s in X, Y and Z axes, respectively. There was no significant change in the attitude estimation accuracy. From these results, we deduce that this method serve as an alternative when the estimation performance of the vision system is degraded due to the effect of nonlinear perturbations and sufficiently long relative distance.
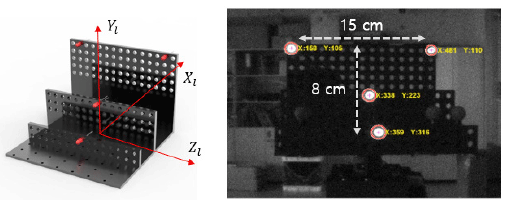
The reference value of the ASTERIX was generated by eight infrared cameras, with two cameras at each corner of the laboratory (Fig. 12). The spacecraft simulator was equipped with more than three infrared markers, so that we could establish the coordinate system of the simulator. The error in the reference value was 0.3550 mm for a period of 100 seconds. However, the simulator has to be immobilized to the blind spot in order to generate stable references. The attitude error due to the loss of one marker was about 2° (B circle in Fig. 15). The movement of ASTERIX equipped with the vision system was implemented by manpower, not gas thrusters. The state between two simulators was estimated in real time (5 – 7 Hz). As we could see in the docking scenario, the simulators gradually approached a phase in which attitudes were aligned.
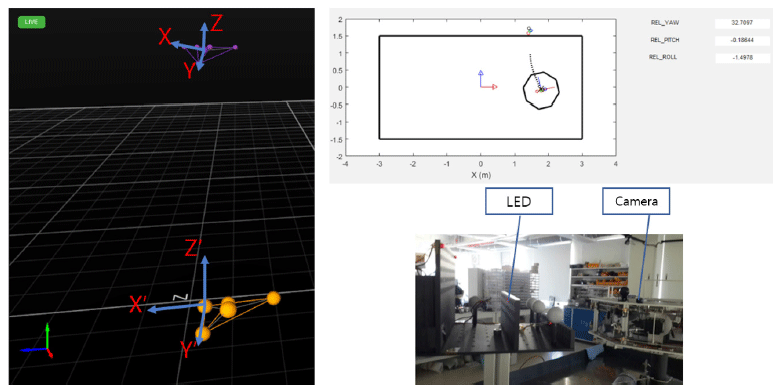
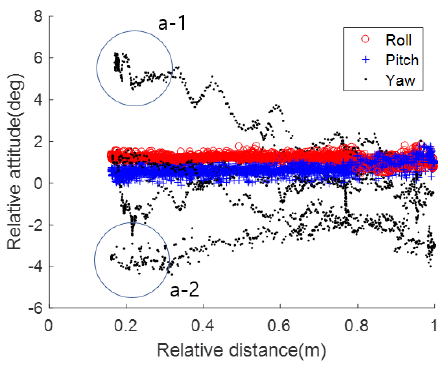
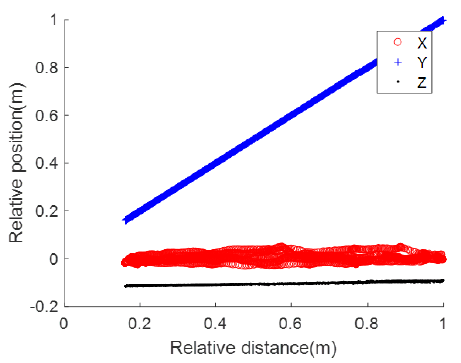
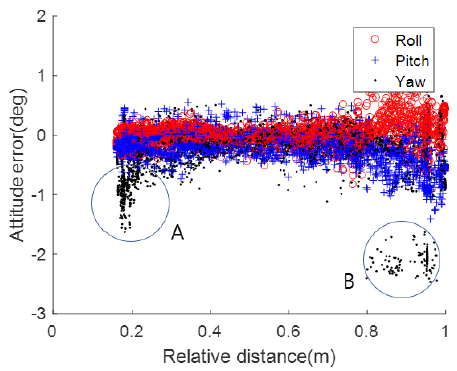
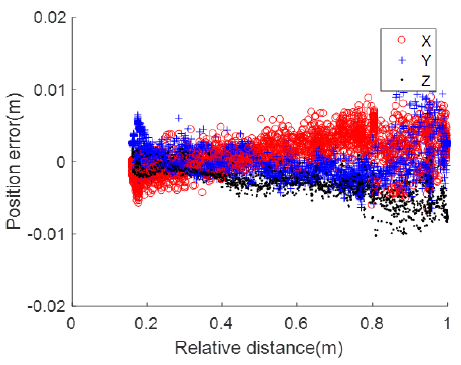
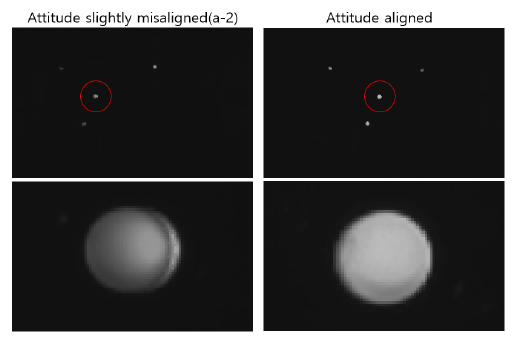
The experimental results are shown in Figs. 13-16. The relative position and attitude with respect to relative distance are shown in Figs. 13 and 14. The X-axis of the graph represents the relative distance shown in the camera coordinate system. It can be seen that the docking proceeded without being completely aligned with respect to yaw axis (a-1, a-2 in Fig. 13). Figs. 15 and 16 show results of real-time state estimation. The Y-axis of the graph represents position errors of the x, y, and z axes or attitude errors of roll, pitch, and yaw, respectively. For all points, the ratio of satisfying the attitude requirement of the docking, which was less than 1°, is 95.96 %, and the ratio of satisfying the position requirement, which was less than 1 cm, was 99.84%. When the relative distance was less than 0.4 m, 97.18 % and 100 % of the points satisfied requirements. The circle A in Fig. 15 corresponds a-1 and a-2 in Fig. 13. The attitude estimation error increased with increase in the relative attitude angle, especially when the distance between spacecraft was near in the LOS direction. This was because the LED projection image was distorted due to the relative attitude (Fig. 5). An example is shown in Fig. 17. The position error corresponding to the circle B of Fig. 15 is due to one of the markers not being detected for an instant. However, position errors were less than 1 cm, even if in the absence of one marker. In Fig. 16, the tendency of the position estimation error was slightly different for each axis. This was due to the incompleteness of the assembly, so that the estimation error was related to unadjusted assembly tolerance and measurement error, simultaneously.
4 CONCLUSION
The effectiveness of the constructed algorithm was verified by software simulations assuming two scenarios. First, it is confirmed that the vision system composed of a vision-based estimation algorithm and a PD controller can be used for autonomous docking. When the measurement error of the vision sensor is less than 5 pixels, the desired relative position and attitude accuracy can be achieved. In the PCO formation flying scenario, the precision was lower than that of the docking task, but the accuracy was improved to the order of several tens of millimeters by the complementary algorithm using the laser sensor. This result confirmed that the relative position estimation performance of the vision system can be compensated by combining the vision system with the relative position sensor, which is sensitive to the relative distance direction. The algorithm demonstrated the possibility of expanding the distance range utilizing the vision system.
The near-field estimation performance of the constructed algorithm was verified by hardware experiments. First, it was confirmed that the accuracy required for the docking can be achieved by using the real vision system composed of real equipment. In addition, except for the assembly tolerance of the hardware, it was found that simulation results are similar to those of numerical simulations. Even in the presence of unmeasurable errors that may exist in the laboratory, the estimation system satisfied mission requirements. This implies that the vision system demonstrated its feasibility in the real-world estimation.
This study confirmed the performance of both the software algorithm and the hardware system. Also, ways to supplement the algorithm were suggested and verified. In addition, by assessing the performance in actual experimental environment, the feasibility of the constructed algorithm was confirmed. In further research, the performance of the estimation algorithm in more varying scenarios can be analyzed and a system that reflects various error factors in the real world can be constructed.