1 INTRODUCTION
Arctic sea ice has a crucial place in Earth’s climate as an indicator of climate change. Recent studies of sea ice variability focus on the decline of Arctic sea ice in the summer (Serreze et al. 2007; Stroeve et al. 2007; Comiso et al. 2008), a thinner than normal thickness (Giles et al. 2008; Haas et al. 2008; Rothrock et al. 2008; Kwok et al. 2009), and a more vulnerable rapid melt (Holland et al. 2006; Maslanik et al. 2007; Nghiem et al. 2007; Boé et al. 2009).
There are several possible factors for the noted reduction of sea ice: 1) high sea surface temperature might have contributed to the reduction of Arctic sea ice; 2) the decline of Arctic sea ice has allowed greater absorption of solar radiation and has increased the sea surface temperature (Perovich et al. 2008; Steele et al. 2008; Shibata et al. 2010); and 3) researchers used the data from in situ measurements and satellites during a period when sea surface temperature was anomalously high in 2000 and 2007.
According to some studies, an increase in solar radiation accelerated the rate of Arctic sea ice melting, and the absorbed solar radiation in the summer melts the sea ice (Comiso et al. 2008; Perovich et al. 2008; Perovich & Polashenski 2012). The summer heat is stored in the ocean and released in fall and winter (Screen & Simmonds 2010). Timmermans (2015) examined the release of stored solar heat on sea ice in fall and winter and showed the absorbed heat loss plays an important role in the change in sea ice. Perovich et al. (2011) suggested that the enhanced solar heat in the ocean increased melting at the bottom.
Atmospheric circulation patterns change the Arctic sea ice (Deser et al. 2000; Hu et al. 2002; Rothrock & Zhang 2005; Serreze & Francis 2006; Ukita et al. 2007). These research proposed that the reduction of Arctic sea ice is driven by the Arctic oscillation, north Atlantic oscillation, or northern annular mode. Deser & Teng (2008) analyzed sea ice concentration trends in the Arctic during the period from 1979 to 2007, and their results show the atmospheric circulation has an influence on forcing winter and summer Arctic sea ice concentration trends. However, they also explained that a general decline in Arctic sea ice was not affected directly by a trend in atmospheric circulation. Parkinson & Comiso (2013) indicated that the Arctic oscillation indices did not contribute to sea ice decline in 2012 as compared to the 2007 sea ice minimum period. The Arctic sea ice area reached a historic minimum size in modern observation history in the summer of 2012.
One of the contributors to the reduction of Arctic sea ice is the increase in surface air temperature (Kay et al. 2011). Anthropogenic greenhouse gases have driven Arctic and global warming, and the Arctic surface temperature have risen about twice as much as the global average in recent decades, which is referred to as the Arctic amplification (ACIA 2005; Serreze & Francis 2006; Screen & Simmonds 2010; Serreze & Barry 2011; IPCC 2013). Ogi & Wallace (2007) explained the summer circulation anomalies related to sea ice extent with positive anomalies over the reduction region of the Arctic sea ice. The Arctic amplification and the sea ice loss associated ice-albedo feedback resulted in enhanced solar radiation on the ocean surface (Curry et al. 1995; Perovich et al. 2007). However, Parkinson & Comiso (2013) examined monthly anomaly data of surface temperatures in July and August of 2007 and 2012 and explained that surface air temperature was likely not a major influence in reducing the sea ice extent and sea ice concentration.
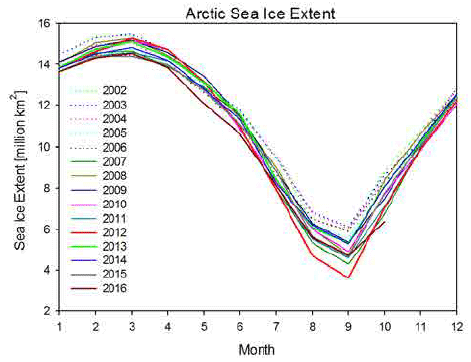
Fig. 1 shows the Arctic sea ice extent (a typical threshold of sea ice extent is at least 15 % ice concentration as ice-covered) from January 2002 to October 2016. The Arctic sea ice extent average value was 3.41 million square kilometers in the area in September 2012, the lowest seasonal minimum extent in the satellite record since 1979.

The factors contributing to the decline in the Arctic sea ice have been studied: the atmospheric warming and circulation in summer and winter, solar radiation, and ocean heat. However, the fundamental mechanisms for the decline of Arctic sea ice are not completely understood. In this study, we will suggest an additional explanation for the reduction of Arctic sea ice by investigating the spatial distribution of the sea ice melting region near the Arctic polar ice cap in the summer of 2012 and the winters of 2013 and 2014 using the data from passive microwave sensors.
2 OBSERVATION
The sea ice concentration and extent data collection derived from passive microwave satellites began in 1978. This consistent observation data combines data from the Nimbus-7 scanning multi-channel microwave radiometer from 1979 to 1987, the Defense Meteorological Satellite Program (DMSP) Special Sensor Microwave/Imager (SSMI) from 1987 to 2007, and the Special Sensor Microwave Imager/Sounder (SSMIS) from 2008 to present. The passive microwave data for the research of sea ice is efficient because the microwave emissions of ice and liquid differ significantly allowing a distinction between ice and liquid. Passive microwave sensors allow a clear depiction of the overall ice distribution. Therefore, we can calculate the extent and concentration of the Arctic sea ice using the data from passive microwave satellites.
In this study, we used data from the DMSP F13 satellite SSMI and F17 satellite SSMIS sensors, which have operated from July 1987 to the present. The SSMI instrument measures the surface radiances for the atmosphere, ocean, and terrain at 19.3, 22.2, 37.0, and 85.5 GHz. The SSMIS measures the same objects and polarization as the SSMI sensor and collects microwave energy at 24 frequencies between 19 and 183 GHz with a swath width of 1,700 km.
Sea ice concentration is defined as the relative amount of area covered by ice. The ice concentration describes how much of a grid cell box is covered by ice and is represented as 0 to 100 % ice. In this study, we used the daily sea ice concentration data derived from the NASA team sea ice algorithm (Cavalieri et al. 1999) on a 25 km by 25 km grid (Maslanik & Stroeve 1999) and the sea ice extent (area of ocean with at least 15 % sea ice) data (Fetterer et al. 2016). These data were obtained from the National Snow and Ice Data Center (NSIDC). They provide the best estimates of current ice and snow conditions based on the information and algorithms available at the time of data acquisition.
3 THE SPATIAL DISTRIBUTION OF SEA ICE CONCENTRATION IN SUMMER AND WINTER
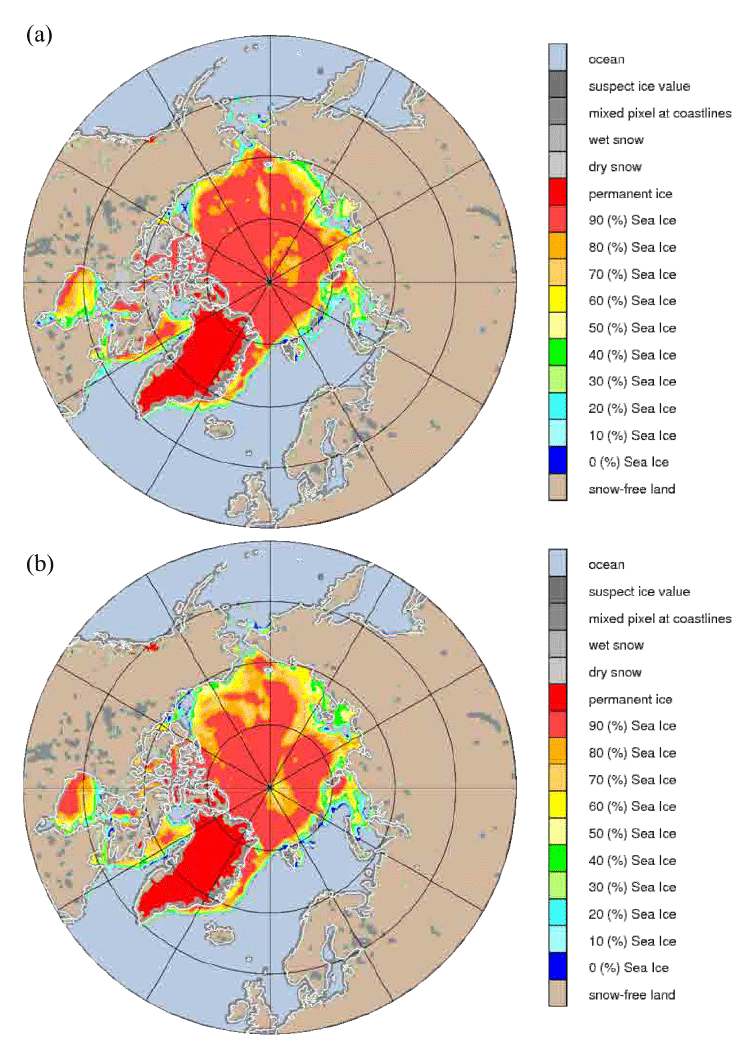
Fig. 2 shows the spatial distribution of the daily sea ice concentration variability in the Arctic in the summer of 2012. We calculated the approximate minimum size for the melting region near the Arctic polar ice cap from the geographic information from the satellite. The size was about (a) 865 km by 610 km for June 9 and (b) 596 km by 428 km for June 11. The percentage of ice concentration of the melting area drops to 60 - 80 % from over 90 % value of the surrounding area.

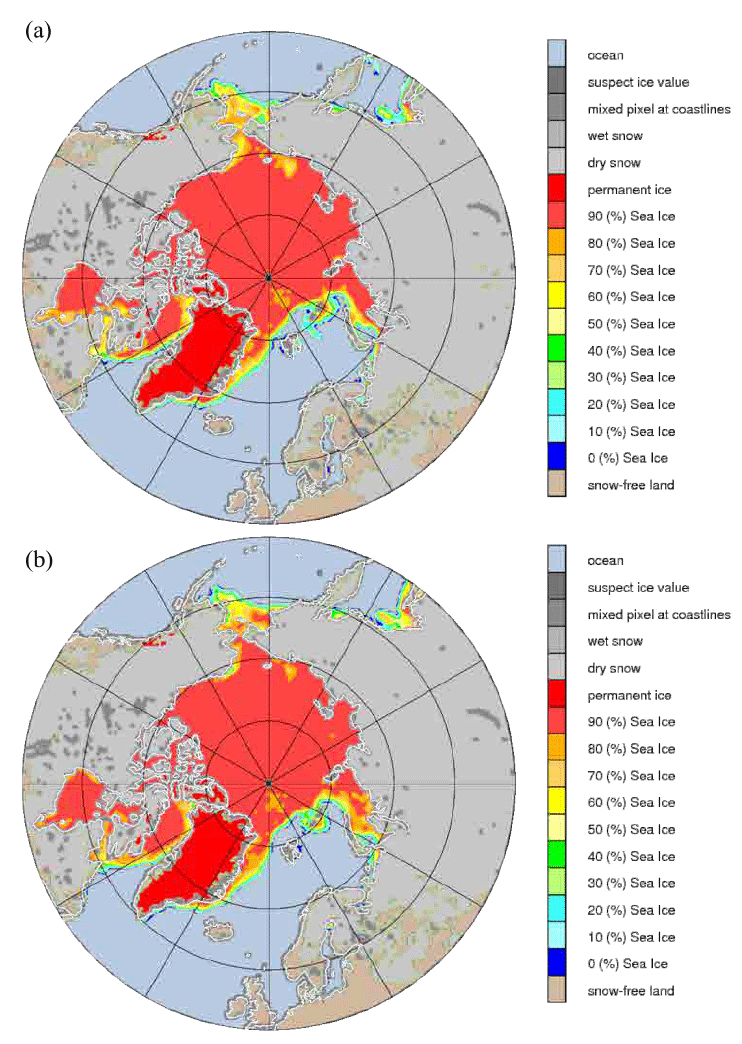
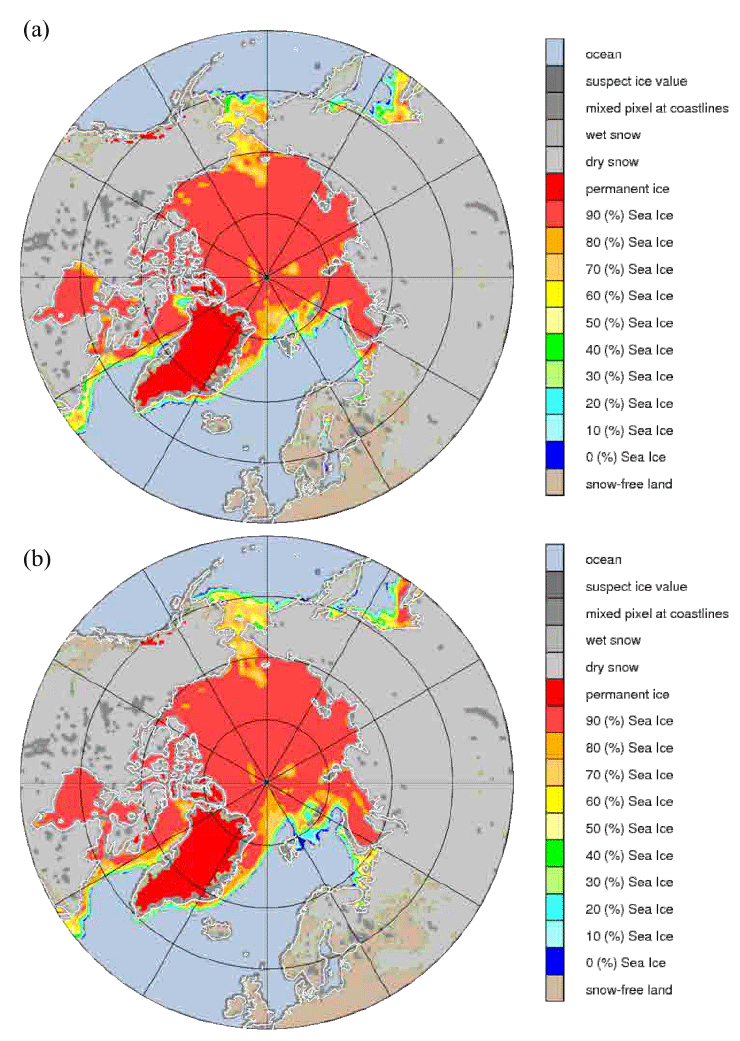
Furthermore, we investigated the change in sea ice concentration in the winters of 2013 and 2014 (Figs. 3 and 4). We identified an extraordinarily large amount of melting near the polar ice cap region and a melting area as extensive as in the summer. The size is about (a) 317 km by 245 km on January 1, 2013 and (b) 242 km by 322 km on January 6, 2013, and the percentage of sea ice decrease to 70 - 80 % in January 2013 near polar ice cap. We also identified the melt region in the winter of 2014. Their size is about (a) 317 km by 245 km on February 10 and (b) 242 km by 322 km on February 20 as the percentage of sea ice concentration drops to 70 - 80 %. The sea ice melting phenomenon near polar ice cap lasted more than three weeks in the winters of 2013 and 2014. Although the sea ice melted more in the summer than in winter near the polar ice cap in Arctic, the melting of the winter is a significant. This is because the errors of the sea ice measurements are about 10 % smaller in winter than in summer resulting from melt ponds on the ice surface and atmospheric and weather effects (Cavalieri et al. 1992; Steffen et al. 1992) and also the error becomes smaller as it goes from the edge to the center of North Pole (Cavalieri et al. 1999).


The Arctic surface temperatures during the winter are below freezing, and the actual surface temperature of the region near the polar ice caps is much lower than at the continental margin. Therefore, the polar ice cap melting in winter is hard to explain by general surface warming.
4 SUMMARY AND DISCUSSION
Arctic sea ice has become thinner than the average ice thickness and more fragmented during the last decade. Arctic sea ice has an important role in climate change because it affects the polar region climate and moderates the global climate system. There has been much research regarding the melting Arctic sea ice and the mechanisms for its decline. The collection of sea ice data by passive microwave satellite began in the early 1970s and provides us long-term data for the efficient calculation of sea ice extent and concentration. In this study, we used the daily sea ice concentration data derived by the DMSP SSMI and SSMIS sensors. These data provide the best estimation of the current sea ice and snow conditions.
In this study, we identified large melting regions near the polar ice cap in summer and winter using passive microwave sea ice data to understand better the accelerated Arctic sea ice melting since 2000 and estimated the size of the melting region. We discovered the sea ice melting region near the Arctic polar ice cap in summer from the spatial distribution of the Arctic sea ice and also identified this extraordinary phenomenon in the winter (January 2013 and February 2014). We suggest that it is hard to explain this phenomenon only by atmospheric or ocean surface effects. Therefore, we would like to propose an additional hypothesis: the rising heating source from the Arctic Ocean ridges and/or the hydrothermal vents could melt the Arctic sea ice near the polar ice cap. In order to verify this hypothesis, the existence of warm water column structure under the melted or thinning arctic sea ice should be confirmed by analyzing the temperature data of sea subsurface from the project such as Coriolis dataset for reanalysis (CORA) compared with those in the Arctic.


