
 PDF Download
 PubReader
 Export Citation
 Email the Author
 Share Facebook
 Share Twitter
 Cited by 0 Article
 Metrics (View:34)










1. INTRODUCTION
The Earth’s thermosphere-ionosphere system is a dynamic region in which forcing from the lower atmosphere interacts with forcing from space (Forbes 2007; Liu 2016). These coupled drivers produce substantial variability over a broad range of temporal and spatial scales (Qian & Solomon 2012; Liu 2016). In this region, solar and geomagnetic forcing, atmospheric waves (tides, gravity waves, and planetary waves), and electrodynamic processes continuously modify neutral winds and temperature (Forbes 2007; Richmond 2011; Liu 2016). The resulting variability plays an important role in the transport of energy and momentum throughout the upper atmosphere. It also contributes to changes in ionospheric structure and thermospheric circulation and links neutral and plasma processes (Immel et al. 2006; Richmond 2011). Therefore, understanding these variations is essential for describing the state of the upper atmosphere and the mechanisms that control its behavior. Such understanding is also practically important because upper atmospheric disturbances can affect satellite drag, radio communication, and satellite-based navigation systems (Schrijver et al. 2015; Bruinsma et al. 2023; Ishii et al. 2024).
A variety of observational techniques have been used to investigate upper atmospheric dynamics (Meriwether 2006; Dhadly et al. 2023). Ground-based instruments, such as meteor radars, Fabry-Perot interferometers (FPIs), and all-sky cameras, provide valuable measurements of different atmospheric parameters over specific locations (Shiokawa et al. 1999; Hocking 2001; Meriwether 2006). Satellite observations provide broad spatial coverage that complements these local measurements (Englert et al. 2023). Among these methods, direct measurements of thermospheric neutral winds and temperature are particularly important for understanding upper atmospheric dynamics (Meriwether 2006; Dhadly et al. 2023). Such measurements provide key information on momentum transport, energy balance, and the response of the neutral atmosphere to external forcing (Forbes 2007). Because neutral winds and temperature are fundamental state variables of the thermosphere, continuous monitoring of these parameters is essential for both case studies and long-term climatological investigations (Fisher et al. 2015; Dhadly et al. 2023).
The FPI is one of the most widely used ground-based instruments for measuring thermospheric neutral winds and temperatures. It determines the Doppler shift and Doppler broadening of airglow emission lines. These measurements allow the retrieval of line-of-sight wind velocity and neutral temperature (Shiokawa et al. 2012; Nakamura et al. 2017). The horizontal wind field can also be estimated from observations in multiple look directions. FPI observations are particularly valuable because they provide direct information on thermospheric dynamics with high temporal resolution during nighttime conditions. Over the past several decades, FPIs have been deployed at many locations worldwide and have contributed substantially to studies of upper atmospheric variability (Meriwether 2006). These instruments have been used to investigate quiet-time circulations, geomagnetic storm responses, and wave-related disturbances in the thermosphere (Emmert et al. 2006b; Shiokawa et al. 2009; Oyama et al. 2023).
Previous FPI observations have revealed that thermospheric winds and temperatures vary significantly with local time, season, latitude, and geomagnetic activity (Emmert et al. 2006a, b; Fisher et al. 2015; Oyama et al. 2023). They have also shown that the thermosphere responds sensitively to both lower-atmospheric forcing and space weather disturbances. For example, FPI measurements have provided important evidence for the role of atmospheric waves in the modulation of upper atmospheric circulation (Ford et al. 2006). They have also helped characterize storm-time heating, enhanced neutral winds, and changes in thermospheric circulation associated with high-latitude energy input (Qian & Solomon 2012; Cai et al. 2019). These findings demonstrate that FPI measurements are essential for understanding the coupling between the neutral atmosphere and ionospheric plasma. They further show that long-term and regionally distributed FPI observations are necessary for capturing the full complexity of upper atmospheric behavior.
Despite the scientific value of FPI measurements, observational coverage remains limited in many regions. In particular, expanded measurements are needed to improve our understanding of upper atmospheric variability over East Asia. The FPI installed at Bohyunsan Optical Astronomy Observatory (BOAO), hereafter referred to as BHO-FPI, provides a new opportunity to monitor thermospheric winds and temperatures from the Korean Peninsula. This new observational capability is expected to advance studies of regional upper atmospheric dynamics and to complement existing observations from nearby stations and satellites. In addition, BHO-FPI can provide valuable data for investigations of thermospheric variability under both geomagnetically quiet and disturbed conditions. As the first report of this instrument at BOAO, this study introduces the system configuration and presents initial observational results that demonstrate its measurement capability and scientific potential.
In this paper, we describe the newly installed FPI at BOAO and present its first observational results, with emphasis on its instrumental characteristics and reliability of thermospheric wind measurements. This study also demonstrates the capability of BHO-FPI for monitoring thermospheric winds over the Korean Peninsula.
2. FPI AND DATA DESCRIPTION
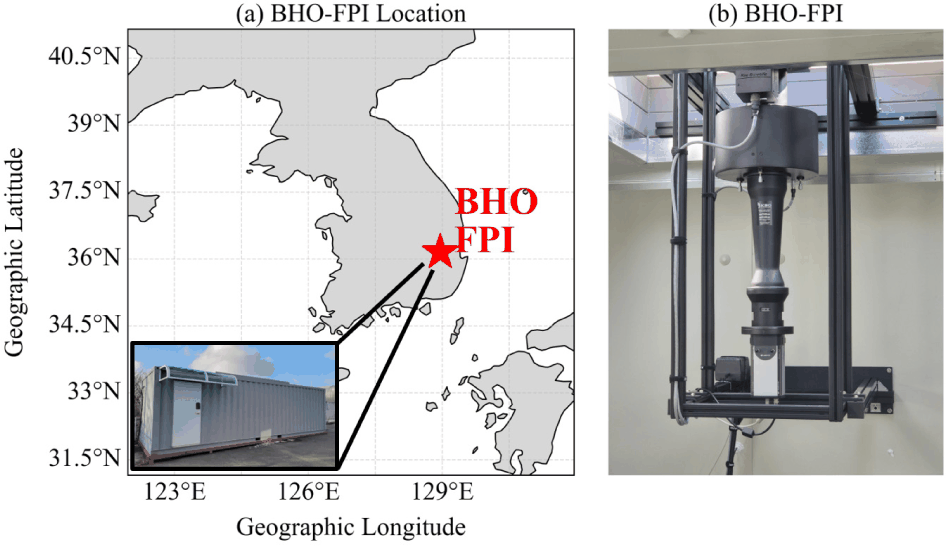
Korea Astronomy and Space Science Institute (KASI) has operated a Fabry-Perot interferometer (BHO-FPI) at Bohyunsan Optical Astronomy Observatory (BOAO) since January 2025. BHO-FPI is based on the Arinae-100 system manufactured by Keo Scientific Ltd. Following installation at BOAO, commissioning observations were conducted by Keo Scientific Ltd. to verify stable instrument operation and acceptable measurement uncertainties before routine scientific observations. Fig. 1 shows (a) the geographic location (geographic latitude: 36.15°N, geographic longitude: 128.96°E) and (b) the experimental setup of BHO-FPI.
Etalon size is a key factor in FPI performance. The BHO-FPI etalon has a 100 mm aperture and a cavity spacing of 15 mm. BHO-FPI has three wavelength filters (OI 557.7, OI 630.0, and OH 892.0 nm) with a full width at half maximum bandwidth of 0.8 nm. Each filter transmits a specific nightglow emission to the etalon. BHO-FPI scans the sky with a 3-minute exposure time in the regular sequence of north, east, zenith, west, and south. BHO-FPI repeats this sequence for each filter. After the airglow passes through the etalon, it is focused onto a 1,024 × 1,024 CCD (Andor iKon M-934 BEX-DD model) and forms an interference ring pattern (Fig. 2). The detailed lens and FPI design are described by Unick et al. (2019).
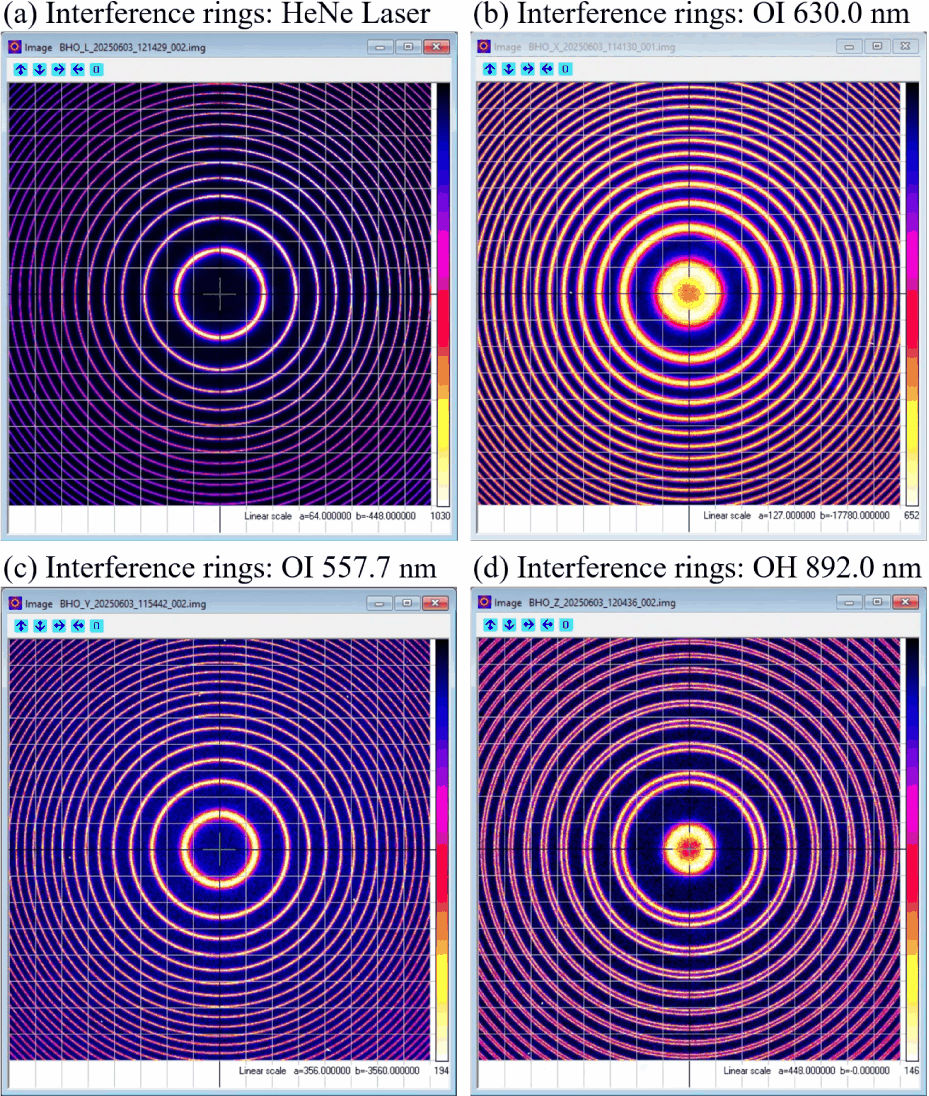
FPIs provide both neutral wind velocity and temperature along the line of sight (LOS) from the interference ring pattern. The LOS winds are calculated from the Doppler shift, which is determined from the difference between a reference interference ring pattern (HeNe laser with a wavelength of 632.8 nm) and the observed airglow interference ring pattern. Neutral temperatures are calculated from the Doppler broadening of the observed airglow interference ring pattern. Details of the calculation of LOS wind velocity and temperature can be found in Harding et al. (2014). Neutral winds and temperatures are obtained from the OH 892.0 nm, OI 557.7 nm, and OI 630.0 nm emissions, which originate from atmospheric layers centered at approximately 87, 96, and 250 km, respectively. The specifications of BHO-FPI are summarized in Table 1.
A cloud sensor is installed together with BHO-FPI to monitor the sky condition. The cloud sensor (Boltwood Cloud Sensor II) measures the sky temperature from infrared radiation in the wavelength range of 8–14 μm. It also measures the temperature near its lower surface, which is referred to as the ambient temperature. The cloud sensor classifies sky conditions according to the temperature difference between the sky and ambient temperatures (Table 2). The cloud sensor also provides additional meteorological parameters, such as rain, ground humidity, ground wind velocity, and ground dew point.
| Sky condition | Sky Temp. – Ambient Temp. |
|---|---|
| Clear | < –22°C |
| Partly Cloudy | –22°C to –10°C |
| Definitely Cloudy | > –10°C |
BHO-FPI provides data quality flags that describe the data condition as Good, Caution, or Bad. Fig. 3 shows the data quality flags of LOS winds derived from OI 630.0 nm airglow from January 2025 to March 2026. The flag numbers indicate the source of uncertainty in the winds, and Table 3 describes the meaning of each flag. For example, flag number 0 means that the data quality is Good and that the data can be used for analysis. Flag number 8 means that the data quality is Caution and that the data should be used carefully because no sky-condition information is available due to missing cloud sensor data. Flag number 16 means that the data quality is Caution and that the data should be used carefully because the cloud sensor detects partly cloudy conditions. Flag number 64 means that the data quality is Bad and that the data are not useful because the cloud sensor detects definitely cloudy conditions. And flag numbers 256 and 512 indicate unreliable fitting results for LOS wind and temperature estimates derived from the interference rings, respectively.
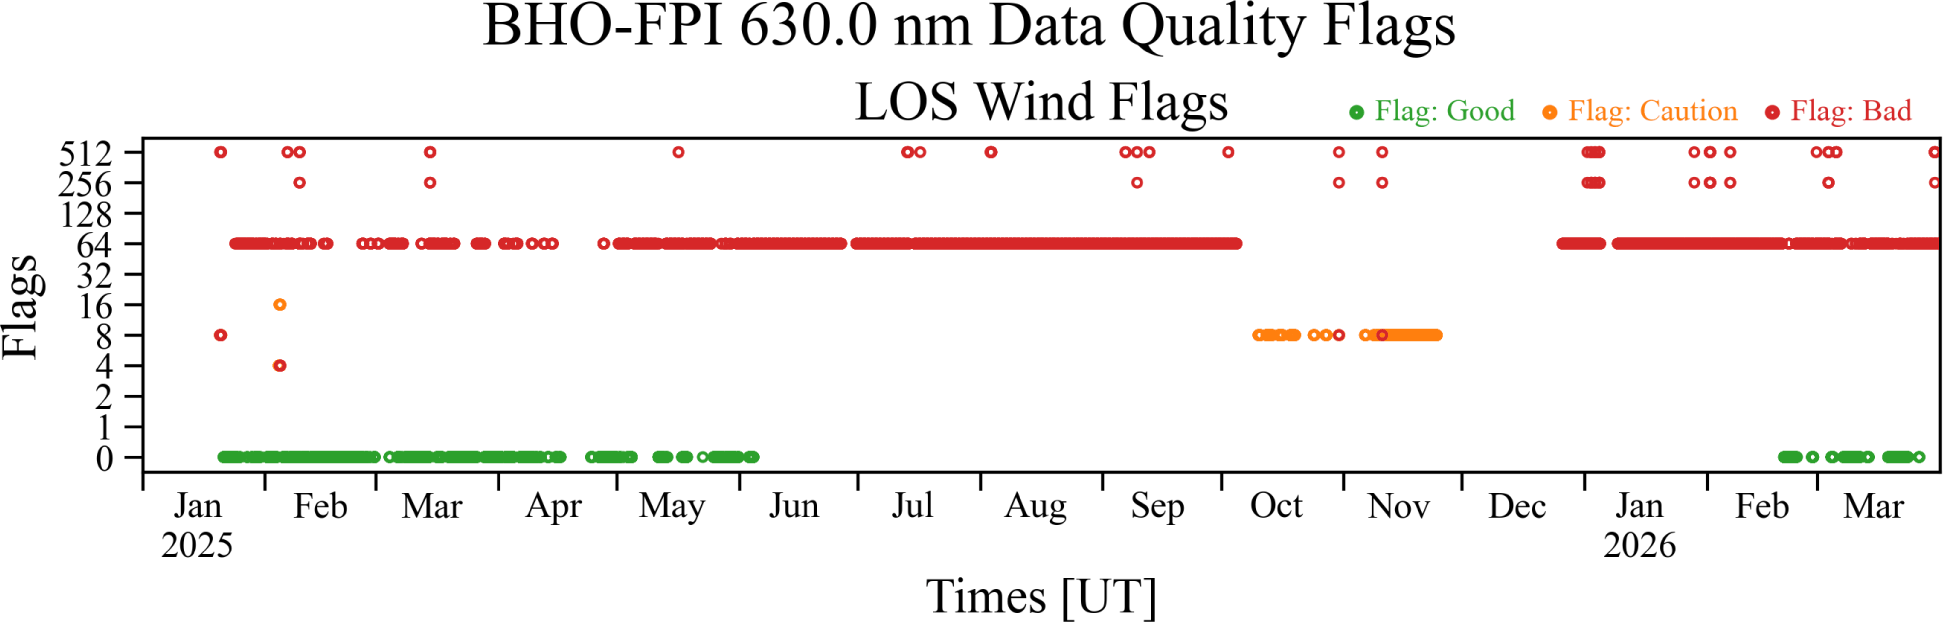
BHO-FPI currently has two technical issues. The first issue is related to the power distribution unit (PDU). This issue caused a data gap from late November to mid-December 2025, during which BHO-FPI was out of service. The second issue is the limited accuracy of the cloud sensor. The cloud sensor has frequently recorded Caution or Bad flags with data quality flags 16 and 64, even when the night sky was clear. Because of this cloud sensor issue, the data quality flags alone should not be used to determine which data are suitable for analysis. Therefore, users are recommended to evaluate wind error values rather than relying solely on quality flags when they use BHO-FPI data. In addition to the wind error, airglow intensity can be used as an additional indicator of measurement quality because weak airglow emission can reduce the signal-to-noise ratio and affect the reliability of the spectral fitting. However, a quantitative criterion based on airglow intensity requires further analysis, and no fixed intensity threshold is applied in this study.
3. RESULTS AND DISCUSSION
Fig. 4 displays the LOS winds derived from OI 630.0 nm airglow. Each colored circle represents a data quality flag. Green, orange, and red circles indicate Good, Caution, and Bad data quality flags, respectively. Positive LOS winds indicate motion away from BHO-FPI along the line-of-sight direction. Northward and southward winds are both present throughout the observation period, but southward winds are dominant (Fig. 4(a) and 4(b)). In contrast, the zonal winds are primarily eastward from November to April, whereas no clearly dominant zonal direction appears from May to October (Fig. 4(c) and 4(d)). LOS wind measurements occasionally exhibit unusually large values that are inconsistent with adjacent observations in all observation directions regardless of the data quality flags. These anomalous measurements occur most frequently from June to September.
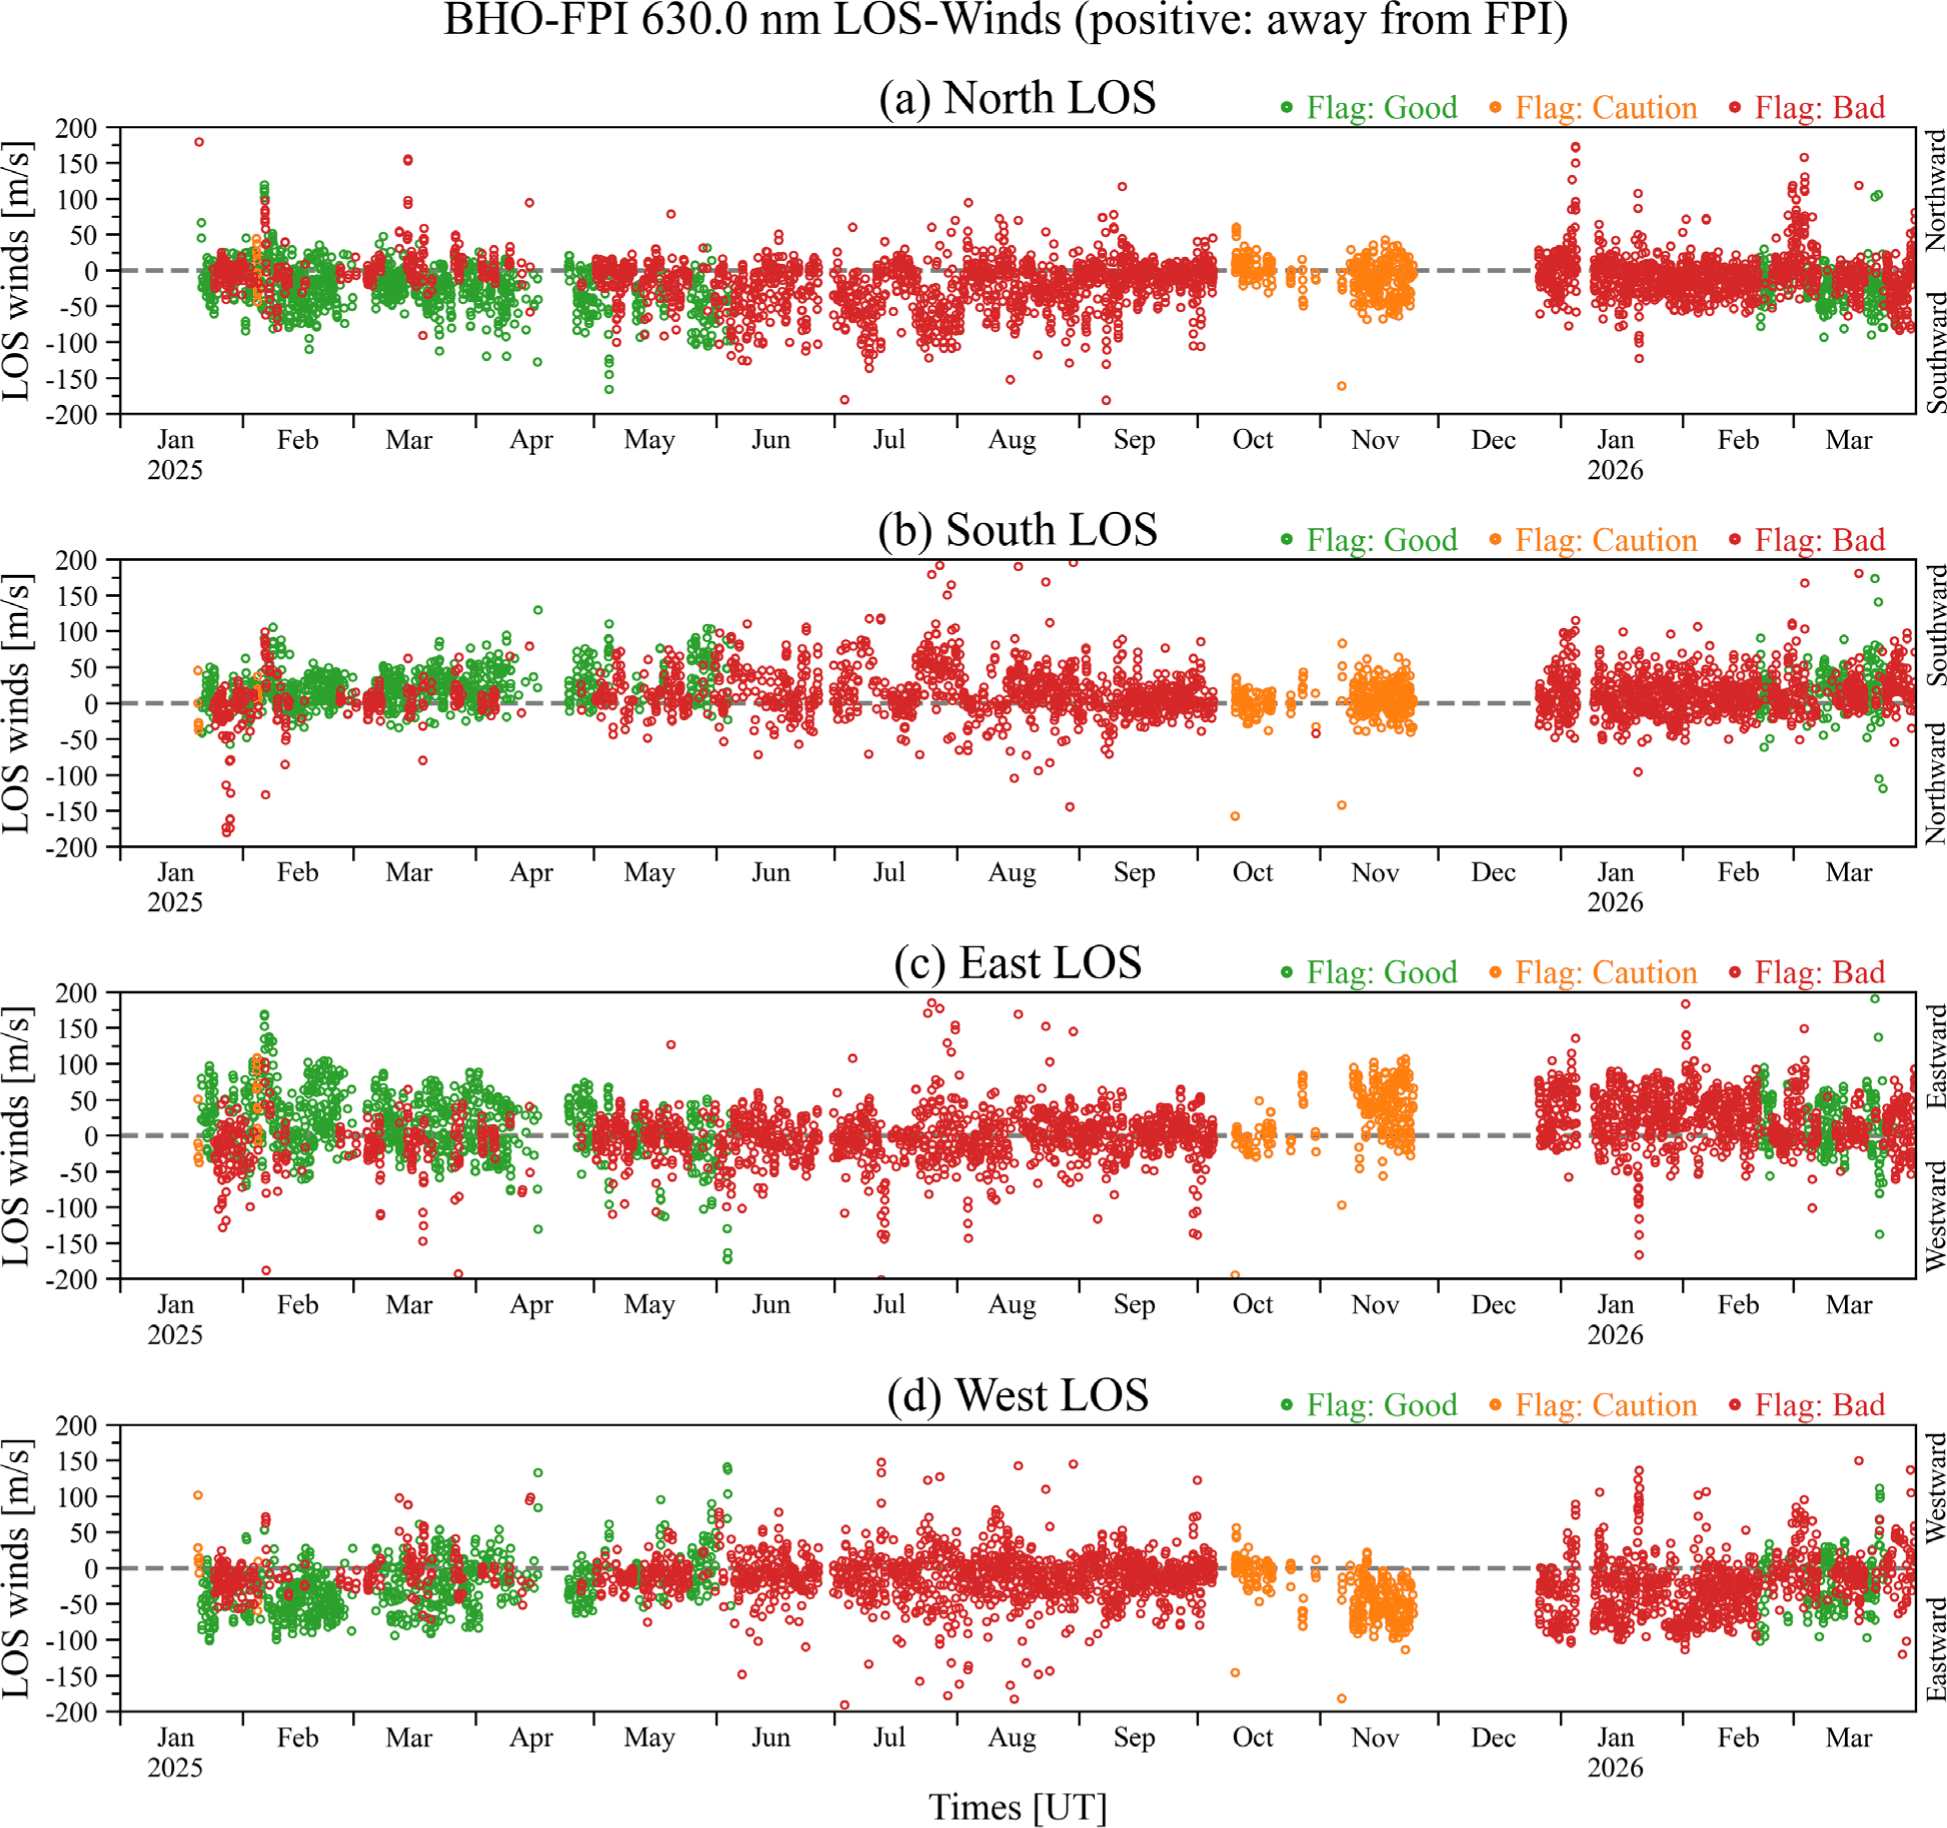
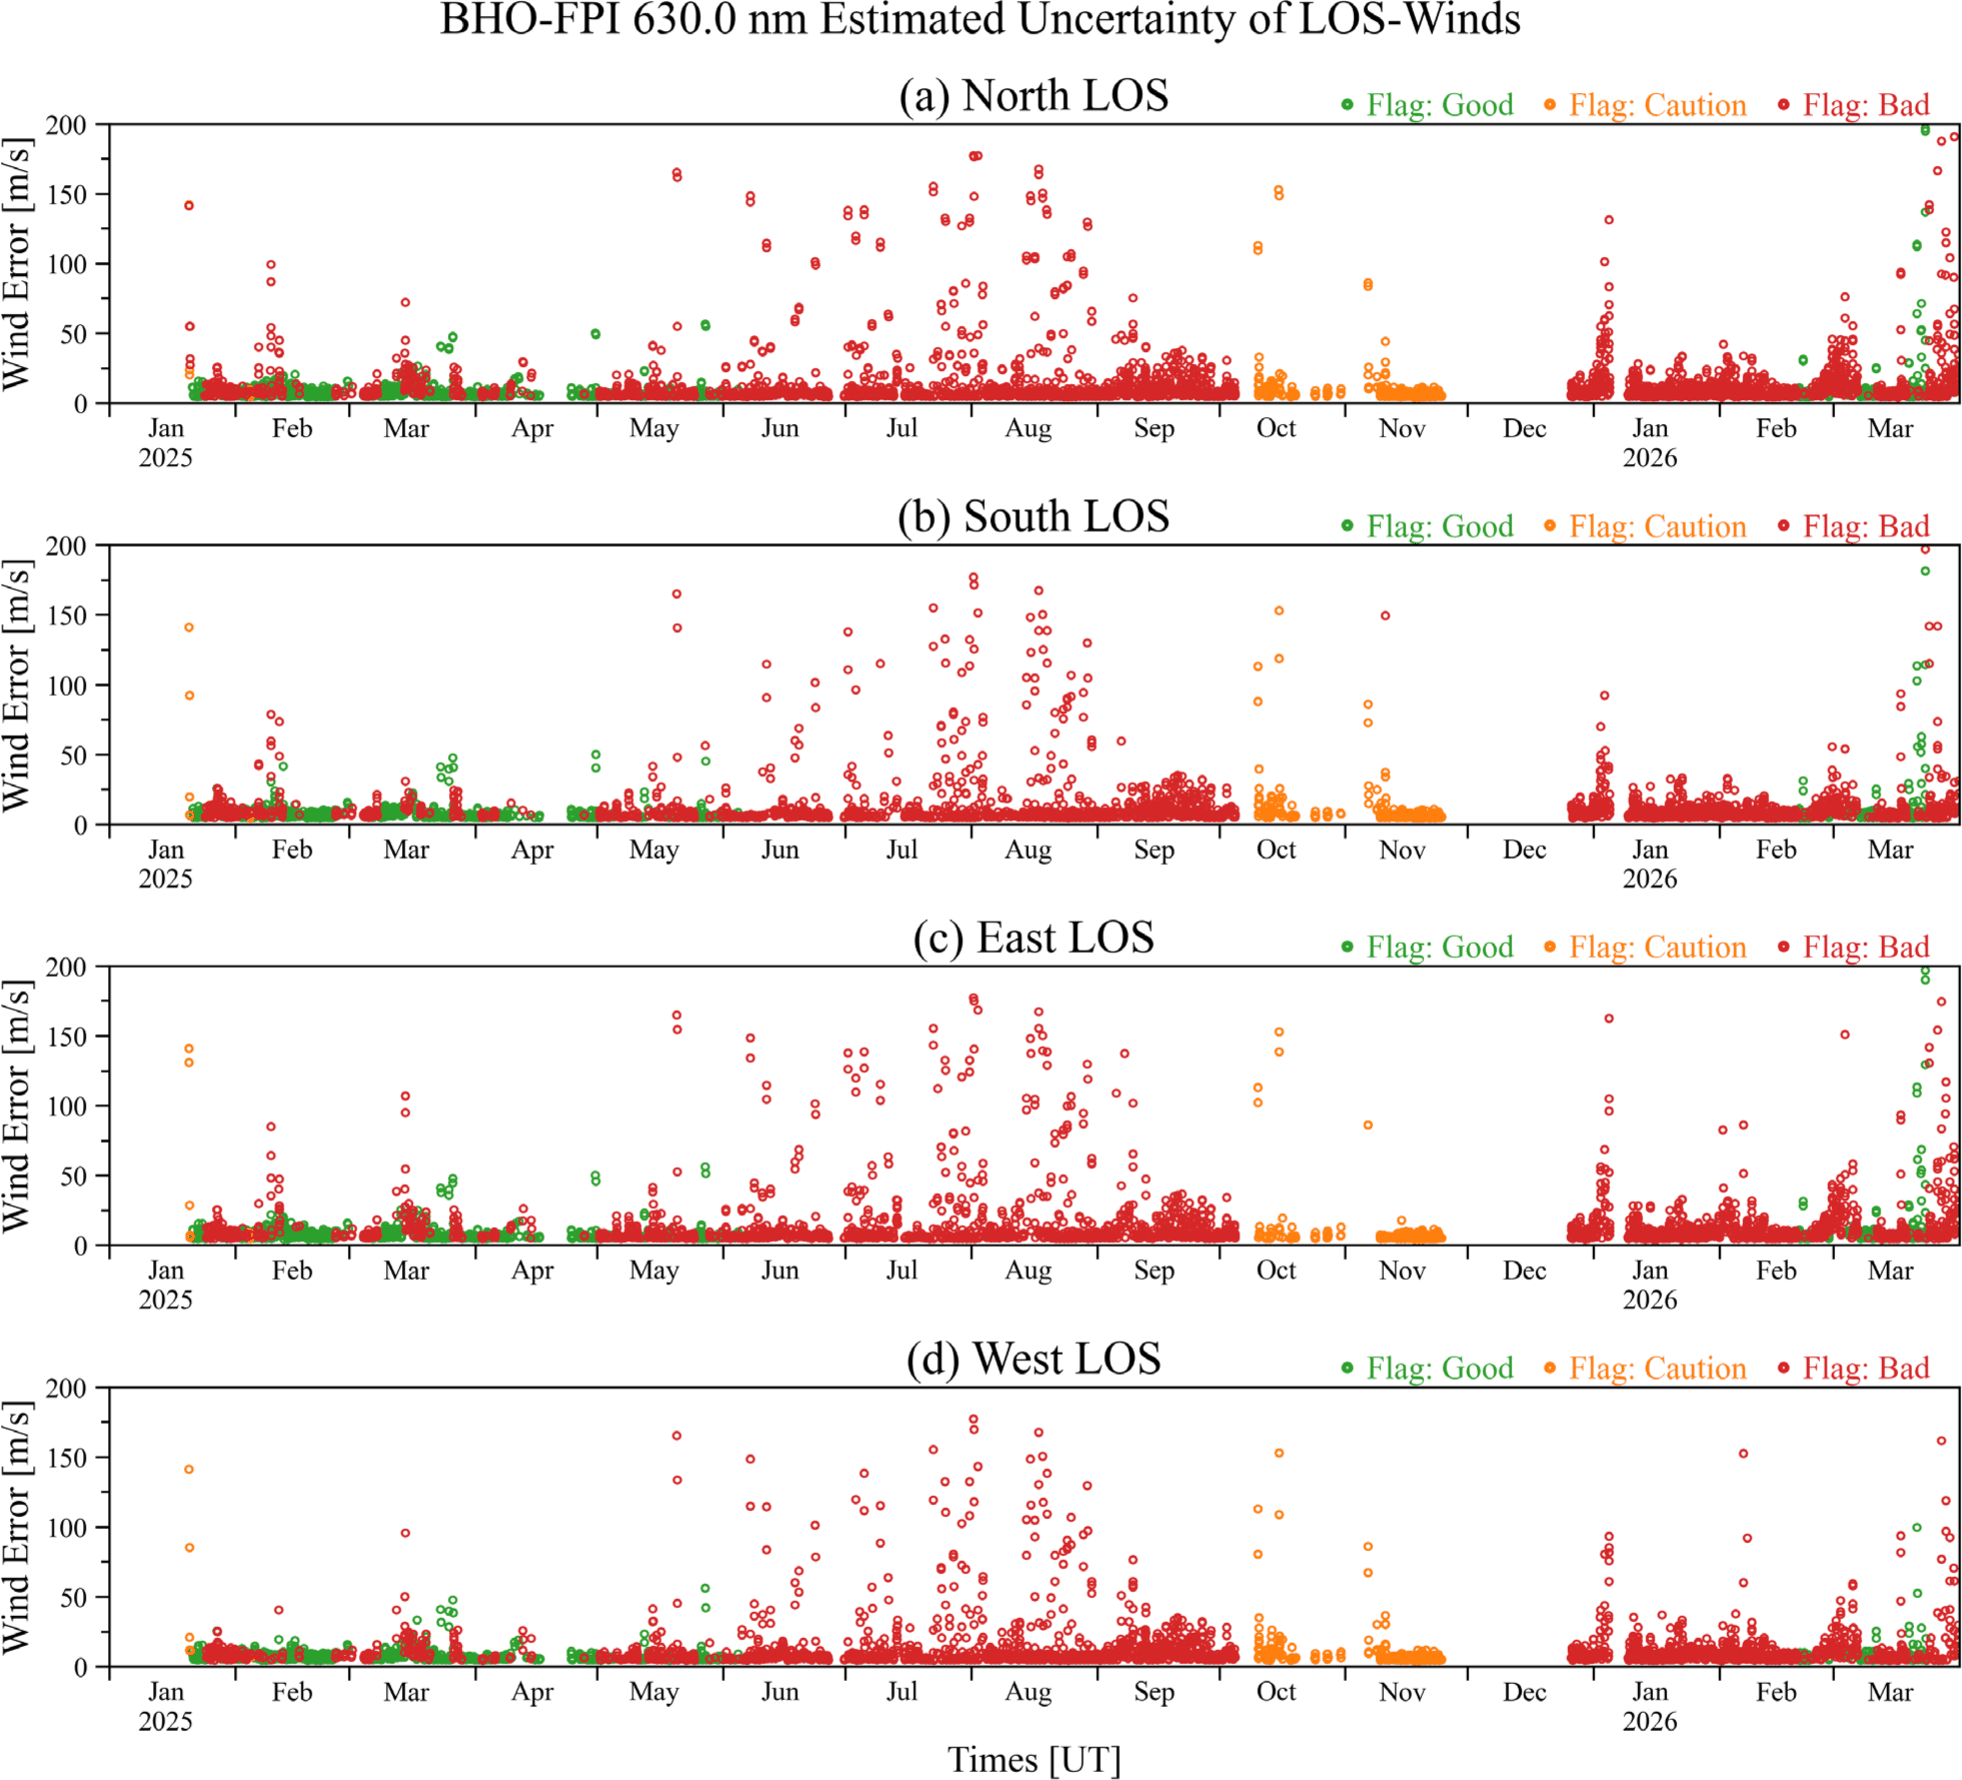
Fig. 5 shows the errors of LOS winds derived from OI 630.0 nm airglow. The LOS wind error, or uncertainty, was obtained during the spectral fitting used to estimate the Doppler shift of the airglow emission line. This value mainly describes how well the line center was constrained in the fitting, and should not be interpreted as the difference between the measured wind and the true atmospheric wind. Thus, large uncertainty values suggest that the corresponding wind estimates are less reliable, possibly because of weak airglow emission, poor signal-to-noise ratio, cloud contamination, or enhanced background light. Although only wind errors less than or equal to 200 m/s are shown, some data with a Bad flag produced unrealistically large error values. These values should be interpreted as failed or divergent spectral fits rather than physically meaningful wind errors. All flag categories include wind errors larger than 25 m/s, but Bad flag data contain an overwhelmingly large number of large wind errors. These large errors appear mainly from May to August. Because the cloud sensor has low reliability for assessing sky conditions, the actual sky conditions cannot be determined with confidence. However, Fig. 5 shows that the highest wind errors were recorded during summer. Thick clouds and rain can lead to biased or erroneous LOS wind measurements by BHO-FPI. Therefore, the unexpectedly large LOS winds in Fig. 4 are likely associated with thick clouds and rain.
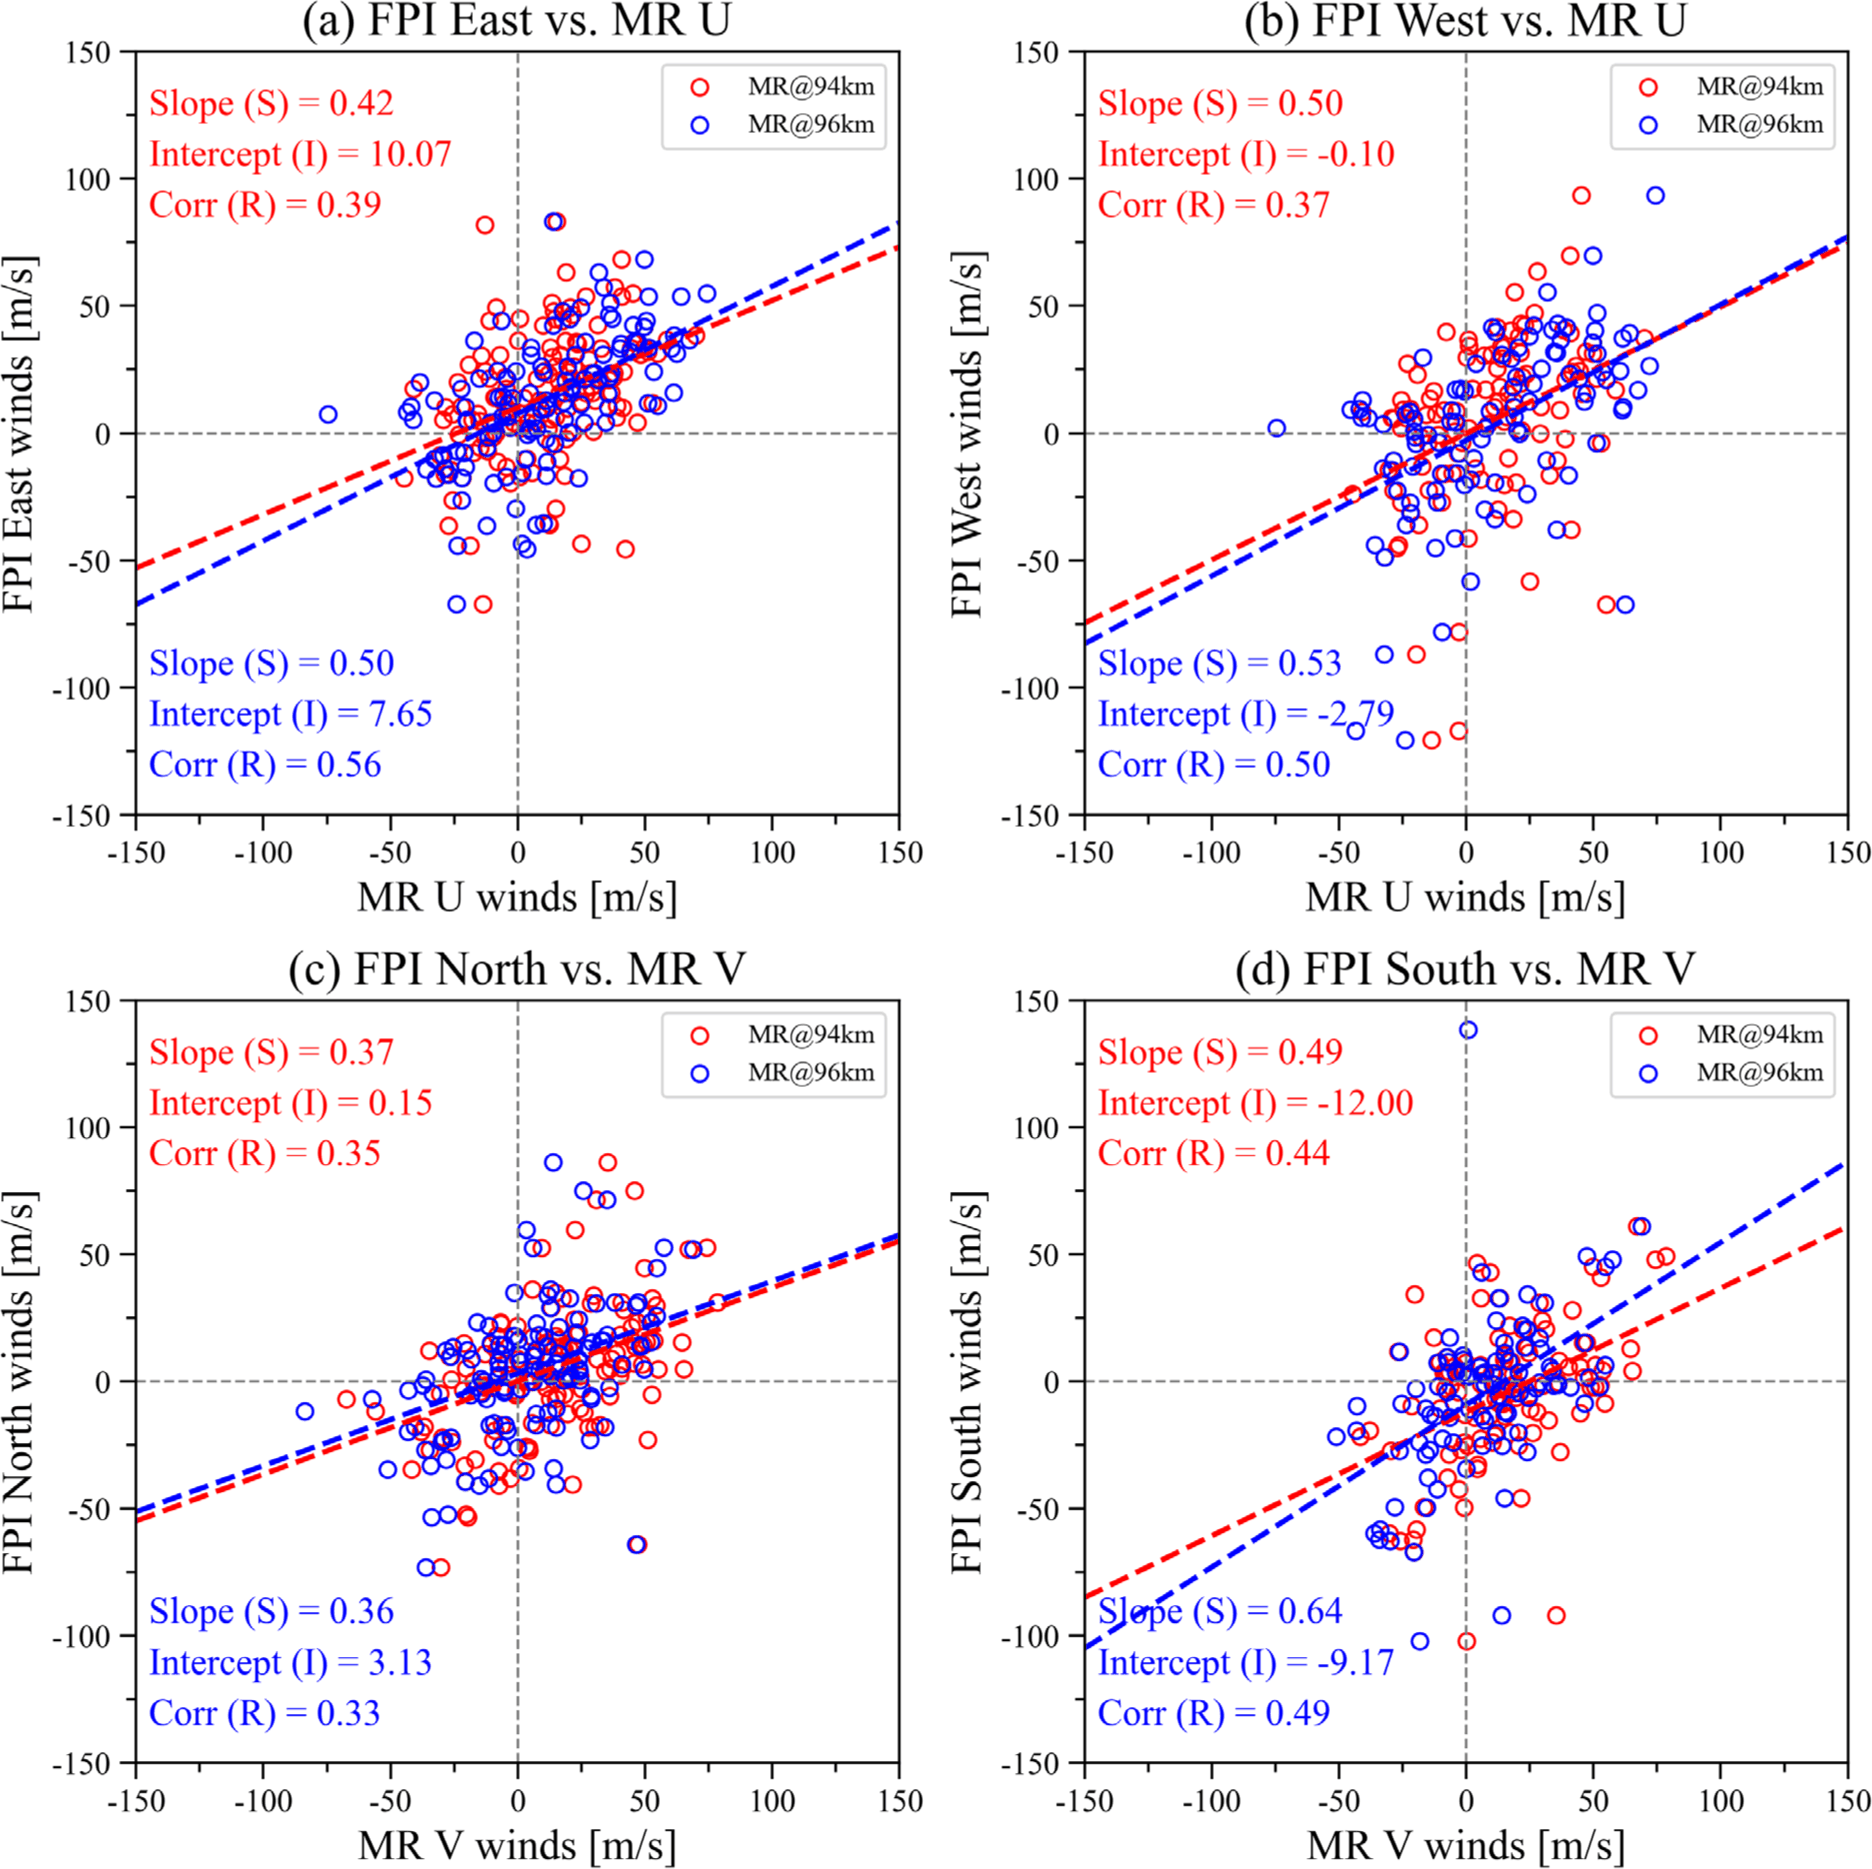
BHO-FPI measures LOS winds, whereas meteor radar observations provide horizontal winds. For a direct comparison between the two instruments, horizontal winds were calculated from the BHO-FPI LOS winds derived from OI 557.7 nm airglow observations. We compared hourly mean BHO-FPI horizontal winds derived from OI 557.7 nm airglow with hourly mean meteor radar winds estimated at altitudes of 94 and 96 km, and the results are shown in Fig. 6. Fig. 6(a) and 6(b) show comparisons between the BHO-FPI eastward- and westward-looking horizontal winds and the meteor radar zonal winds, respectively. Fig. 6(c) and 6(d) show comparisons between the BHO-FPI northward- and southward-looking horizontal winds and the meteor radar meridional winds, respectively. The meteor radar is located in Gyeryong (Geographic latitude: 36.2°N, Geographic longitude: 127.1°E) and the detailed description can be found in Kam et al. (2021). Because thick clouds and rain are widely recognized as factors that compromise the reliability of FPI wind data, we manually classified clear nights and cloudy nights. For the wind comparison, we used only measurements obtained during clear nighttime conditions in March. The red and blue circles represent the meteor radar winds at altitudes of 94 and 96 km, respectively. For the comparison between BHO-FPI horizontal winds in the east and west directions and meteor radar zonal winds, the regression slopes at 94 km (96 km) are 0.42 (0.50) and 0.50 (0.53), respectively. For the comparison between BHO-FPI horizontal winds in the north and south directions and meteor radar meridional winds, the slopes at 94 km (96 km) are 0.37 (0.36) and 0.49 (0.64), respectively. Although BHO-FPI and the meteor radar are both installed in South Korea, they measure different winds because their sites and observation volumes differ. The OI 557.7 nm winds measured by BHO-FPI represent an emission-weighted average over the airglow layer near 96 km altitude, whereas the meteor radar winds are estimated at narrower altitude bins. Previous studies showed that FPI wind magnitudes are often smaller than meteor radar winds, particularly for OI 557.7 nm observations (Lee et al. 2021). One possible reason is that vertical wind shear exists within the airglow layer. Because the FPI wind is averaged over the emission layer, the observed wind magnitude can be smaller than the wind measured at a specific altitude by the meteor radar. Differences in the observation volumes of the two instruments may also contribute to the disagreement. In addition, the two instruments are separated by approximately 170 km horizontally. Gravity waves and tides can produce spatial variations in winds over this distance. Similar differences between airglow-derived winds and meteor radar winds were also reported by Kristoffersen et al. (2024). Despite these differences, the comparison results show better agreement with the meteor radar winds at 96 km. This suggests that the BHO-FPI horizontal winds derived from OI 557.7 nm airglow are representative of neutral winds near 96 km altitude.
In addition, we investigated the influence of a G4-level geomagnetic storm that occurred on January 19, 2026, on neutral winds by using BHO-FPI observations. Fig. 7 shows (a) meridional and (b) zonal winds derived from OI 630.0 nm airglow during the G4 geomagnetic storm together with the Dst index. Before the G4 storm, the meridional winds were northward in the early evening. They then gradually weakened and reached their maximum southward velocity around 18 UT. Afterward, the winds weakened again and turned northward near sunrise, which produced a V-shaped pattern. During the G4 geomagnetic storm, this V-shaped pattern disappeared and southward winds dominated. The V-shaped pattern recovered during the storm recovery phase (Fig. 7(a)). Similar behavior was found in the zonal wind patterns. Before the G4 geomagnetic storm, the zonal winds showed a reverse V-shaped pattern, with eastward winds in the early evening and weak westward winds near sunrise. BHO-FPI measured strong westward winds during the G4 geomagnetic storm. The reverse V-shaped pattern was restored during the storm recovery phase (Fig. 7(b)). These clear wind reversals measured by BHO-FPI provide evidence that strong geomagnetic storms affect global wind circulation.
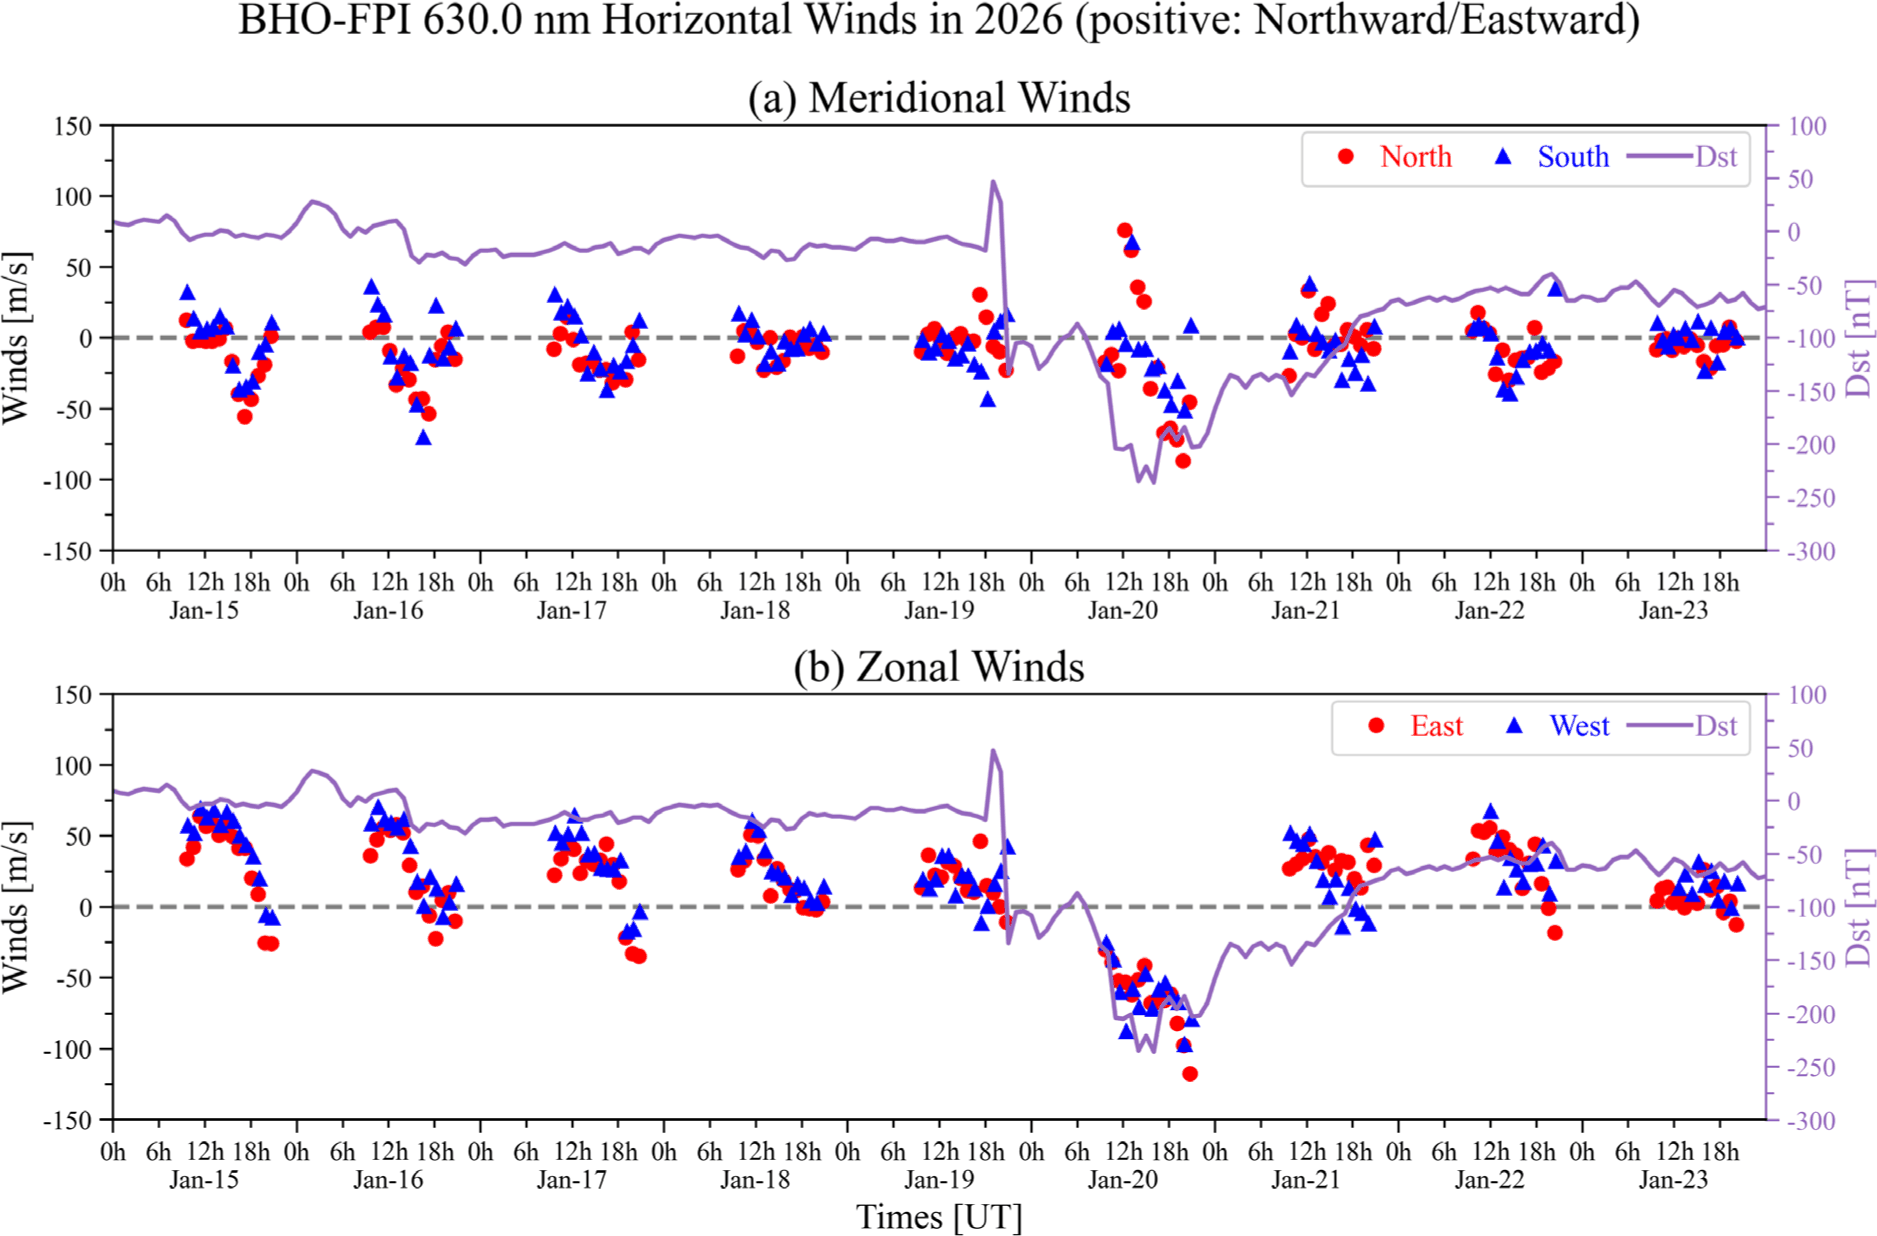
These wind reversals can be explained by enhanced energy input into the high latitude thermosphere during intense geomagnetic storms. For extreme geomagnetic storms at G3 level or higher, Kwak et al. (2024) showed that enhanced energy flux into the high latitude region increases auroral and joule heating. Enhanced auroral and joule heating are well-known sources of thermospheric heating and modify thermospheric wind circulation (Roble 1987). In the northern hemisphere, auroral and joule heating can enhance southward and westward thermospheric winds. Similar storm time modifications of thermospheric winds were reported by Kim et al. (2023) for the G3 geomagnetic storm that occurred on November 3, 2021. Therefore, the wind reversals shown in Fig. 7 are consistent with the prevailing physical interpretation of storm time thermospheric wind disturbances.
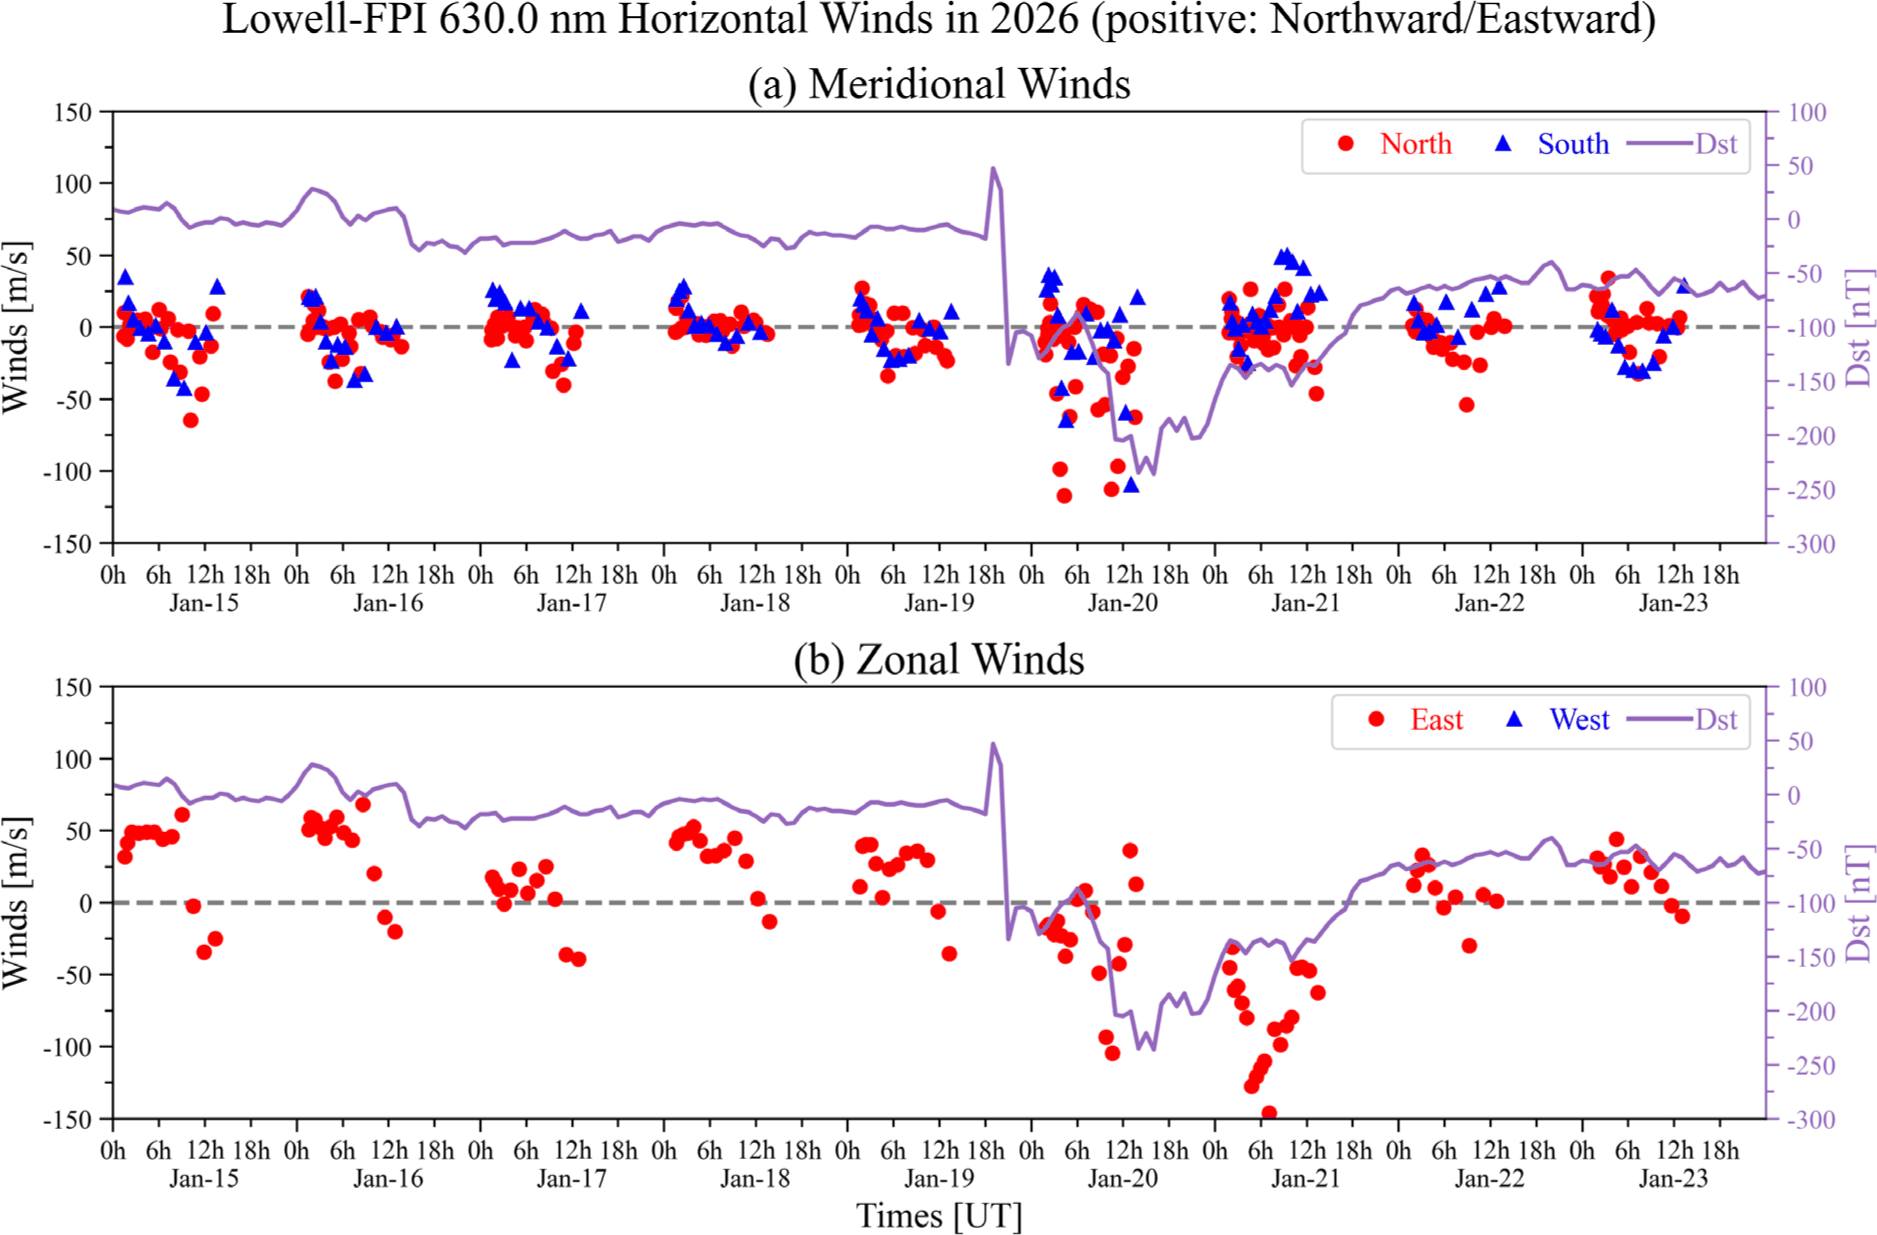
To confirm the wind reversal at another site during the G4 geomagnetic storm, we examined thermospheric winds derived from the FPI installed at Lowell Observatory (Lowell-FPI). The geographic location of Lowell Observatory is 34.75°N latitude and 248.57°E longitude, with a geographic latitude similar to that of BHO-FPI but a different geographic longitude. The horizontal winds derived from OI 630.0 nm airglow by Lowell-FPI and the Dst index during the same period as in Fig. 7 are displayed in Fig. 8. Lowell-FPI also observed a clear wind reversal similar to that observed by BHO-FPI, although westward-looking zonal wind measurements were not available during this period. Figs. 7 and 8 confirm that the G4 geomagnetic storm changed the global wind circulation. These results also confirm that BHO-FPI estimated reliable thermospheric winds during this event.
4. CONCLUSIONS
KASI has operated a Fabry-Perot interferometer at Bohyunsan Optical Astronomy Observatory (geographic latitude: 36.15°N, geographic longitude: 128.96°E) since January 2025. BHO-FPI, which has an etalon diameter of 100 mm and a cavity spacing of 15 mm, observes OI 630.0 nm, OI 557.7 nm, and OH 892.0 nm airglow emissions. These emissions provide measurements of thermospheric and mesospheric neutral winds and temperatures, representing atmospheric layers near 250 km, 96 km, and 87 km altitudes, respectively. BHO-FPI uses a HeNe laser with a wavelength of 632.8 nm as the reference source for estimating neutral winds. Although BHO-FPI provides sky-condition information at the measurement time, wind errors and additional observational parameters, such as airglow intensity, should also be considered when assessing data quality.
We selected clear nights in March 2025 and compared BHO-FPI horizontal winds derived from OI 557.7 nm airglow with winds estimated by the KASI meteor radar (geographic latitude: 36.2°N, geographic longitude: 127.1°E) at altitudes of 94 and 96 km. Differences were found between the BHO-FPI horizontal winds and meteor radar winds because the two instruments sample different atmospheric volumes and are located at different sites. Although disagreements existed between the BHO-FPI horizontal winds and meteor radar winds, the regression results indicate that BHO-FPI horizontal winds derived from OI 557.7 nm airglow are representative of winds near 96 km altitude.
Furthermore, BHO-FPI detected wind reversals in both zonal and meridional winds during the G4-level geomagnetic storm that occurred on January 19, 2026. When the G4 geomagnetic storm reached its main phase, the thermospheric winds clearly turned southward and westward. Similar wind changes were also observed by Lowell-FPI (geographic latitude: 34.75°N, geographic longitude: 248.57°E). Therefore, we confirm that BHO-FPI can successfully monitor thermospheric winds over South Korea and that its measurements can be used to investigate the effects of space weather on mid-latitude thermospheric dynamics. Future studies will focus on detailed wind analyses under both quiet and storm-time conditions to better understand global thermospheric circulation and its response to geomagnetic disturbances.


