
 PDF Download
 PubReader
 Export Citation
 Email the Author
 Share Facebook
 Share Twitter
 Cited by 0 Article
 Metrics (View:3,098)










1. INTRODUCTION
Since entering the 2020s, the manufacturing and launch costs of small and microsatellites have decreased rapidly, and large-scale low Earth orbit (LEO) constellation systems such as Starlink, OneWeb, Kuiper, and Planet have begun full-scale operational deployment. As a result, research on mission design and operations based on satellite constellations has emerged as a core research topic in the space systems field. Within this context, satellite constellations have attracted significant attention as an effective alternative capable of achieving short revisit times, high spatial and temporal coverage, and enhanced mission flexibility—capabilities that are difficult to realize with a single satellite. Accordingly, extensive research efforts have been devoted to constellation orbit design, deployment configurations, performance evaluation, and operational efficiency analysis.
In Korea, various studies on satellite constellations have also been conducted in response to these technological and industrial developments. Early research approached the problem of improving the average revisit time for ground targets by repositioning existing on-orbit satellite assets within limited fuel constraints using genetic algorithm–based methods (Kim & Bang 2009). Subsequent studies focused on sun-synchronous orbit (SSO) constellations, defining operational performance metrics that quantify ground station communication efficiency and imaging acquisition efficiency, and improving these metrics through numerical optimization techniques (Kim et al. 2015). In addition, several studies geometrically modeled the realistic observation constraints of synthetic aperture radar (SAR) payloads and analyzed access frequency and revisit time distributions as a function of Walker-Delta constellation configurations, thereby identifying constellation architectures suitable for intelligence, surveillance, and reconnaissance (ISR) missions (Kim et al. 2017; Song et al. 2019).
More recently, research has extended beyond single-sensor-based performance analysis to define performance metrics for evaluating operational efficiency in constellation systems simultaneously operating heterogeneous payloads, such as electro-optic (EO) and SAR sensors. New operation-oriented metrics—including cross-revisit time, overlapping observation frequency, and system response time—have been proposed (Ko et al. 2025). Furthermore, studies have defined surveillance and reconnaissance missions over specific regions, such as the Korean Peninsula, as discontinuous coverage problems and compared Walker-Delta and repeat ground track (RGT) constellations using unified performance metrics to analyze their structural advantages and limitations for region-specific missions (Shin et al. 2022; Jeon et al. 2024). While these studies have contributed to expanding the theoretical foundation of constellation design and performance analysis, they remain limited in that they often focus on specific orbit configurations or sensor types and typically rely on separated simulation and data analysis environments.
Meanwhile, many constellation simulation studies conducted domestically have adopted a dual-analysis framework in which orbit propagation and access analysis are performed using Ansys Systems Took Kit (STK), followed by post-processing and data analysis using MATLAB (Kim & Bang 2009; Kim et al. 2015). However, with the continuous expansion of the MATLAB Satellite Communications Toolbox and related orbit and sensor modeling capabilities, the potential to perform integrated constellation orbit configuration, payload modeling, ground observation site definition, and revisit time analysis within a single environment has significantly increased (Kim et al. 2025).
Motivated by these research trends, this research further distinguishes itself from previous work in terms of payload performance modeling. While many prior studies determined ground observation opportunities using built-in STK sensor models or conic sensor–based coverage representations, this work extends and applies MATLAB’s Conical Sensor model to simulate the observation coverage and mission characteristics of diverse payloads, including automatic identification system (AIS), electro-optic/infra-red (EO/IR), radio-frequency (RF), and SAR, within a unified framework. This approach enables quantitative comparison of revisit time distributions under identical orbital conditions as the payload type varies and additionally allows discussion of the effectiveness of simultaneously operating multiple payloads onboard a single satellite.
Also, this research introduces a differentiated methodology for constellation revisit time analysis. Whereas prior studies have primarily evaluated performance using single statistical metrics—such as average or maximum revisit time per regional grid cell provided by STK—this work combines ground track visualization with revisit time data to analyze revisit characteristics simultaneously in both temporal and spatial dimensions. Revisit times for individual ground observation points are organized over the simulation timeline and interpreted alongside ground track patterns, enabling multi-faceted analysis of how revisit time distributions vary with orbital configuration and ground track structure. This approach provides an intuitive analytical basis for understanding coverage gaps and regional performance disparities that are difficult to capture using average performance metrics alone.
Moreover, when applying a J2 perturbation model during orbit propagation, this research addresses the issue that relative satellite positions in a constellation gradually degrade over time if standard Walker-Delta initial orbits are used without modification. To mitigate this effect, a Walker-Delta–based initialization strategy is adopted in which the initial orbital elements are redefined so that all satellites share an identical orbital period. This approach ensures stable maintenance of the constellation geometry even under J2 perturbations. By minimizing relative position drift caused by orbital dynamics, this initialization strategy allows the effects of payload performance and observation geometry on revisit time analysis to be more clearly isolated and evaluated, distinguishing this work from previous studies.
Finally, this research proposes an integrated simulation framework that enables consistent execution of constellation orbit configuration, payload modeling, ground observation site setup, and revisit time analysis entirely within a single MATLAB environment, departing from the conventional separation between STK-based orbit simulation and MATLAB-based post-processing. In particular, this paper leverages the orbit propagation, satellite–ground access calculation, and sensor modeling capabilities provided by MATLAB Satellite Communications Toolbox, demonstrating that constellation simulation and performance analysis can be conducted without reliance on external commercial simulators. By performing the entire analysis workflow from orbit design to performance evaluation and post-processing within a unified platform, the proposed framework aims to improve the consistency and reproducibility of the research and design process.
2. METHODS
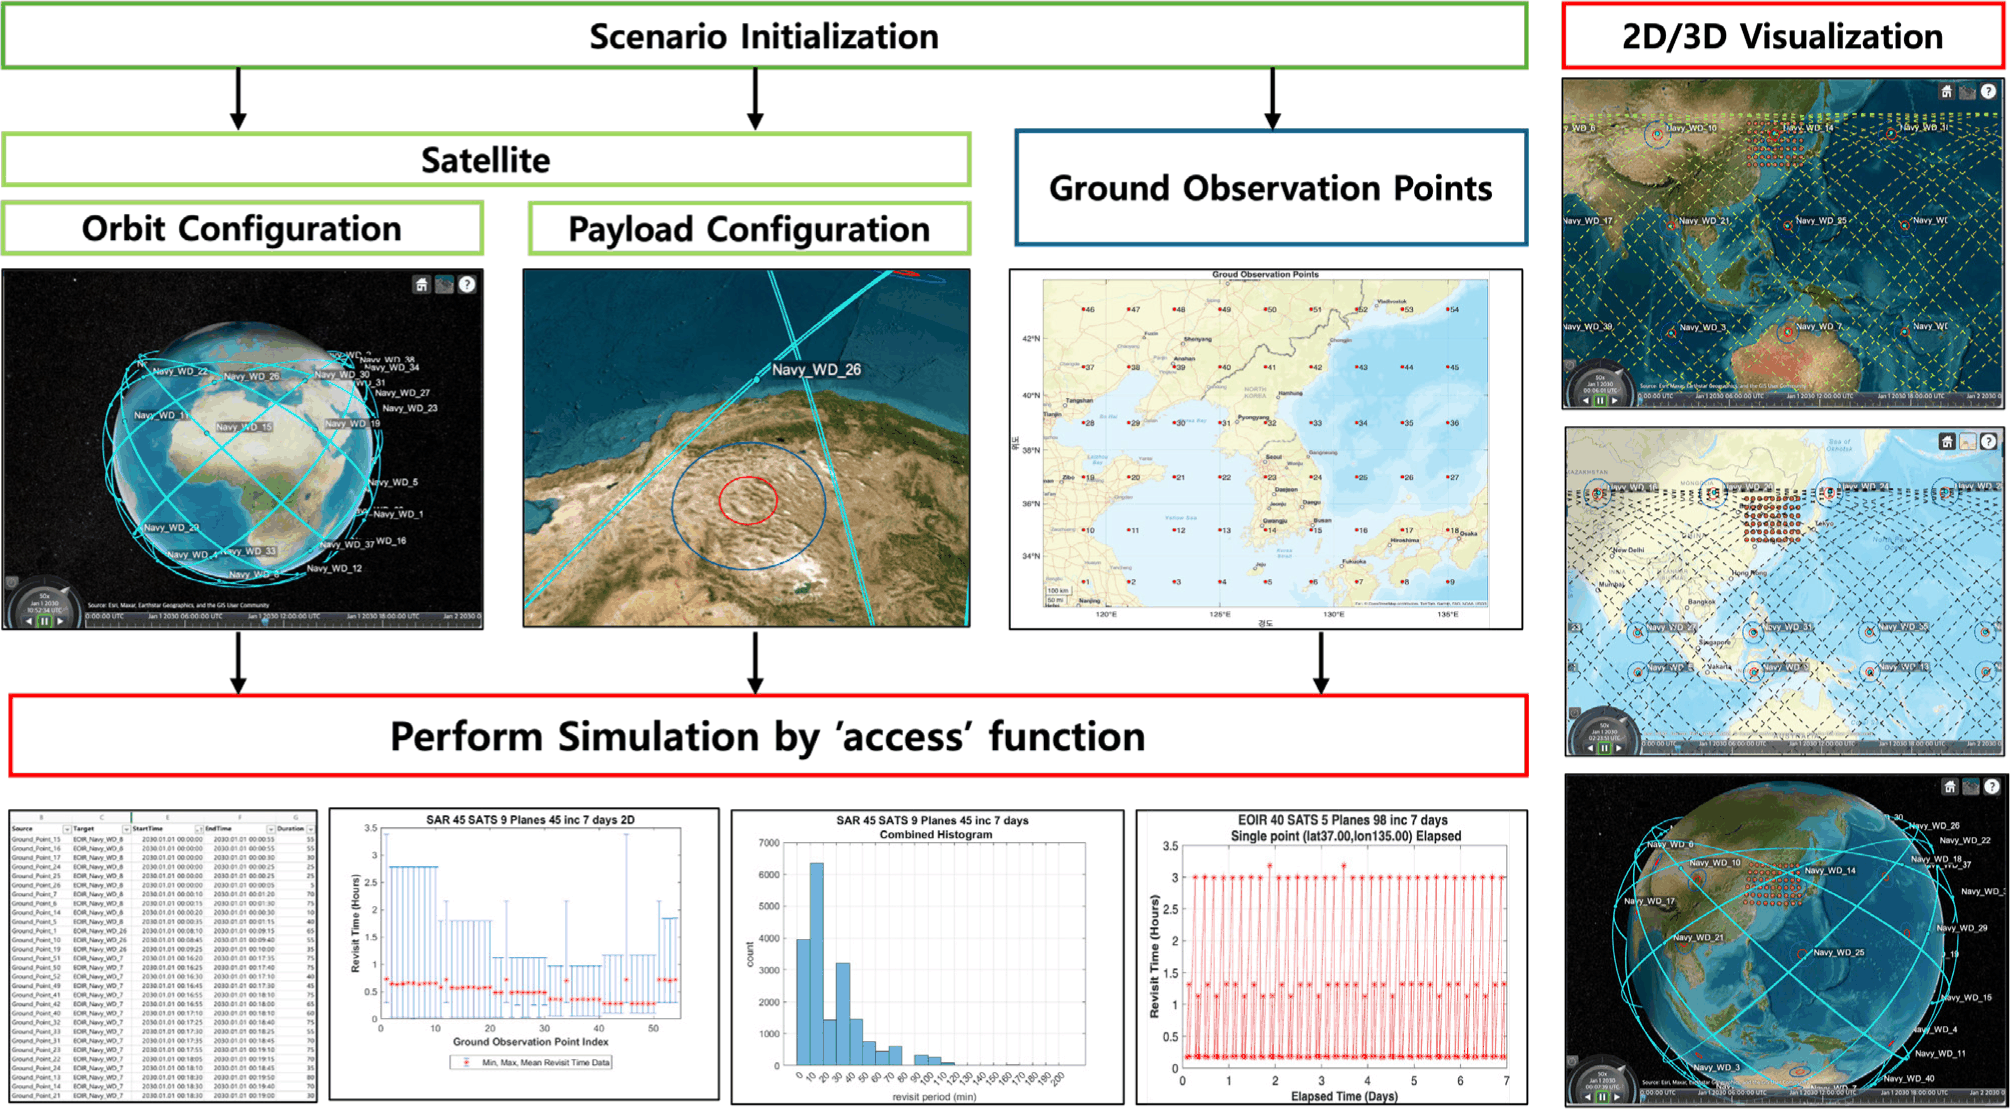
This research proposes an integrated simulation framework for evaluating the coverage performance and revisit characteristics of Earth-observation satellite constellations equipped with heterogeneous payloads. The overall structure of the proposed framework is illustrated in Fig. 1, and the representative visualization outputs are summarized in Fig. 2.
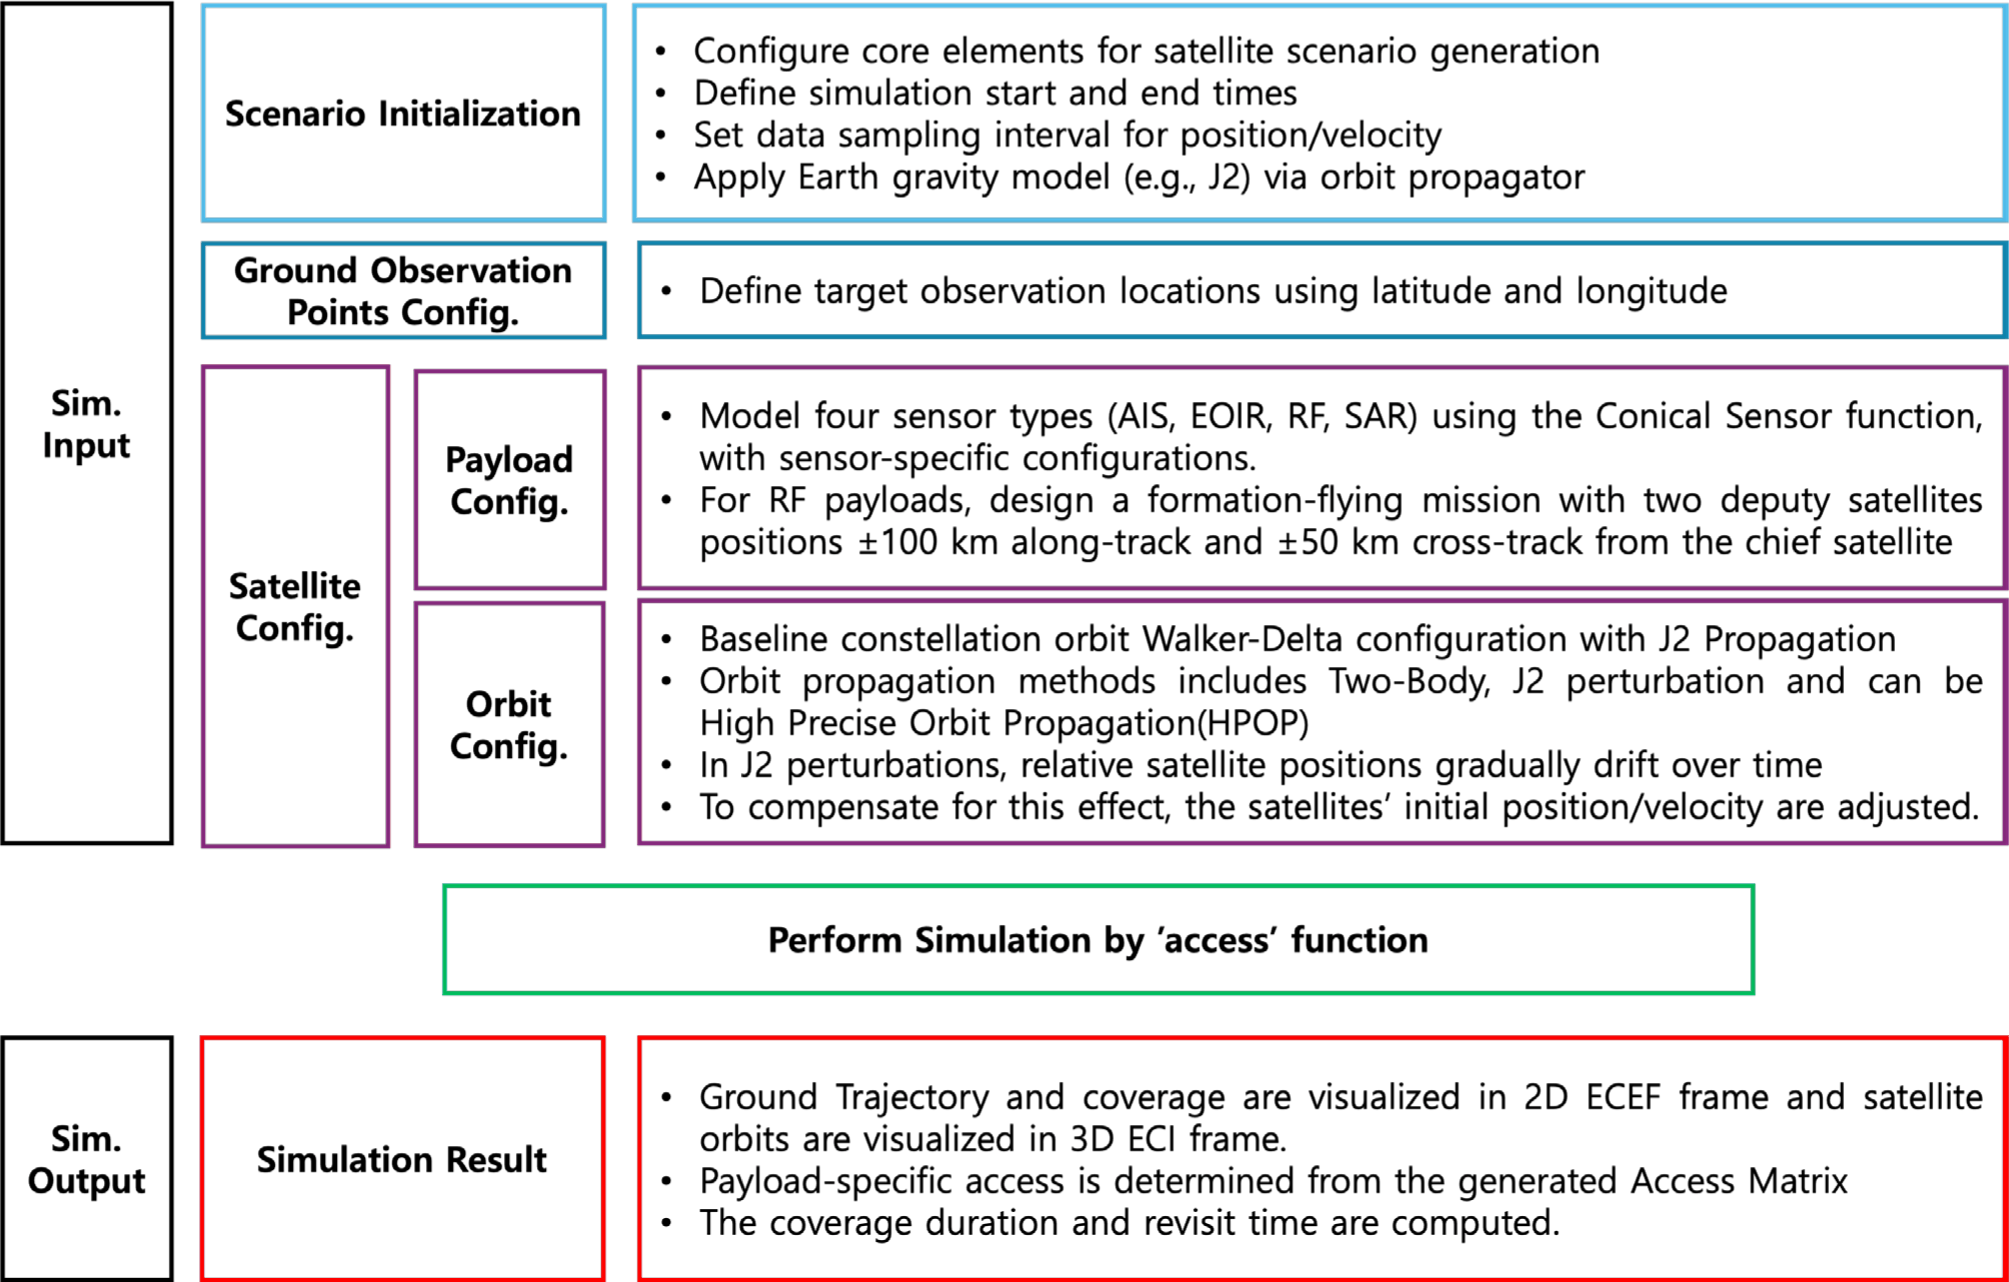
As illustrated in Fig. 1, the framework consists of three large segments: simulation input configuration, access-based simulation execution, and result analysis. The simulation begins with scenario initialization, where the simulation time span, state sampling interval, and orbit propagation model are defined. Earth’s oblateness effect is considered by applying a J2-perturbed orbit propagator.
Ground observation points are then specified using latitude and longitude coordinates. Satellite configurations include both payload and orbit definitions. Four sensor types (AIS, EO/IR, RF, and SAR) are modeled using the Conical Sensor function with payload-specific parameters. For RF missions, a formation-flying configuration is considered, in which two deputy satellites are positioned relative to a chief satellite in the along-track and cross-track directions. The baseline constellation orbit follows a Walker-Delta configuration, and initial satellite states are adjusted to compensate for relative drift induced by J2 perturbations.
After satellite and ground station configuration, satellite-to-ground visibility is evaluated using the access function. Payload-specific access opportunities are identified from the generated access matrix, from which coverage duration and revisit time metrics are computed.
Fig. 2 illustrates the integrated simulation architecture and example outputs with representative visualization, including 2D ground coverage maps, 3D orbit visualization, access tables, and revisit-time statistics.
Table 1 describes the overall input–output structure of the proposed simulation framework and identifies the MATLAB functions used at each stage of the workflow.
The satellite input parameters including orbit elements, ground observation points, and conical sensor characteristics are summarized in Table 2. These parameters are selected because they directly determine the geometric visibility between satellites and ground targets, which fundamentally governs the access opportunities and revisit-time characteristics of the constellation. In particular, orbital altitude and inclination define the global ground trajectory pattern of satellites, while the sensor field-of-view determines the effective ground footprint of each payload.
The utilization of conical sensor models and corresponding field-of-view inputs for each payload type is explained in Section 2.2. The generation and processing of contact sequence charts derived from the access function are detailed in Section 2.3, where payload-specific post-processing strategies are introduced. Finally, the constellation configuration parameters, such as the number of satellites and the number of orbital planes, are described in Sections 3.1 and 3.2 in the context of geometric ground trajectory analysis and proposed constellation design.
The proposed MATLAB-based simulation framework provides several advantages compared to conventional revisit-time analysis approaches commonly performed using STK. First, MATLAB integrates orbit propagation, access analysis, and sensor modeling within a single computational environment. This allows flexible implementation of various sensor types (AIS, EO/IR, SAR, RF) without requiring separate external modules. Also, multiple heterogeneous sensors can be simulated simultaneously within a unified scenario. The built-in visualization tools enable users to inspect satellite orbits, ground tracks, sensor footprints, and access intervals at arbitrary time instants through an interactive interface. Moreover, MATLAB provides a cost-effective and accessible platform for academic research. Compared to STK, which requires separate licensing for advanced modules, MATLAB allows universities to perform constellation revisit-time analysis with relatively lower software cost. Finally, the proposed framework enables direct post-processing of access results using MATLAB’s numerical computing capabilities. This facilitates customized performance metric evaluation, statistical analysis of revisit-time distributions, and algorithmic extensions for future optimization-based constellation design studies.
Table 2 shows the key input parameters used in the constellation simulation framework. The simulation duration is set to 7 days, which allows us to observe potential orbital parameter variations under the J2 perturbation propagation model. The orbital altitude is set to a 500 km circular orbit, a commonly adopted configuration for many LEO satellite constellations. The inclination angle for AIS, SAR, and RF payloads is set to 45°, which is suitable for surveillance over the Korean Peninsula. In contrast, the EO/IR payload is assumed to operate in a 98° sun-synchronous orbit to maintain a consistent solar illumination condition for imaging missions.
The sensor-related parameters, including the conical sensor model and its corresponding field-of-view (FOV) or incidence-angle constraints, define the effective observation footprint of each payload. Since different payload types operate under distinct sensing geometries, these parameters significantly influence the spatial extent and frequency of accessible observations. The detailed modeling approach for each payload type, including how the conical sensor representation is applied and how the sensor footprint is interpreted for AIS, EO/IR, SAR, and RF payloads, is described in Section 2.2.1.
The spatial sampling of the observation region is defined through a set of ground observation points distributed across the target region. These points provide the reference locations for evaluating coverage performance and revisit-time statistics across the region of interest. The configuration and rationale of these ground observation points are presented in Section 2.2.2.
In this research, 4 payloads (AIS, RF, EO/IR, and SAR) are modeled using a unified geometric framework based on conical sensor representations. While a common modeling structure is adopted for consistency in access analysis, payload-specific FOV definitions and ground footprint construction methods are applied to reflect the distinct sensing characteristics of each payload type.
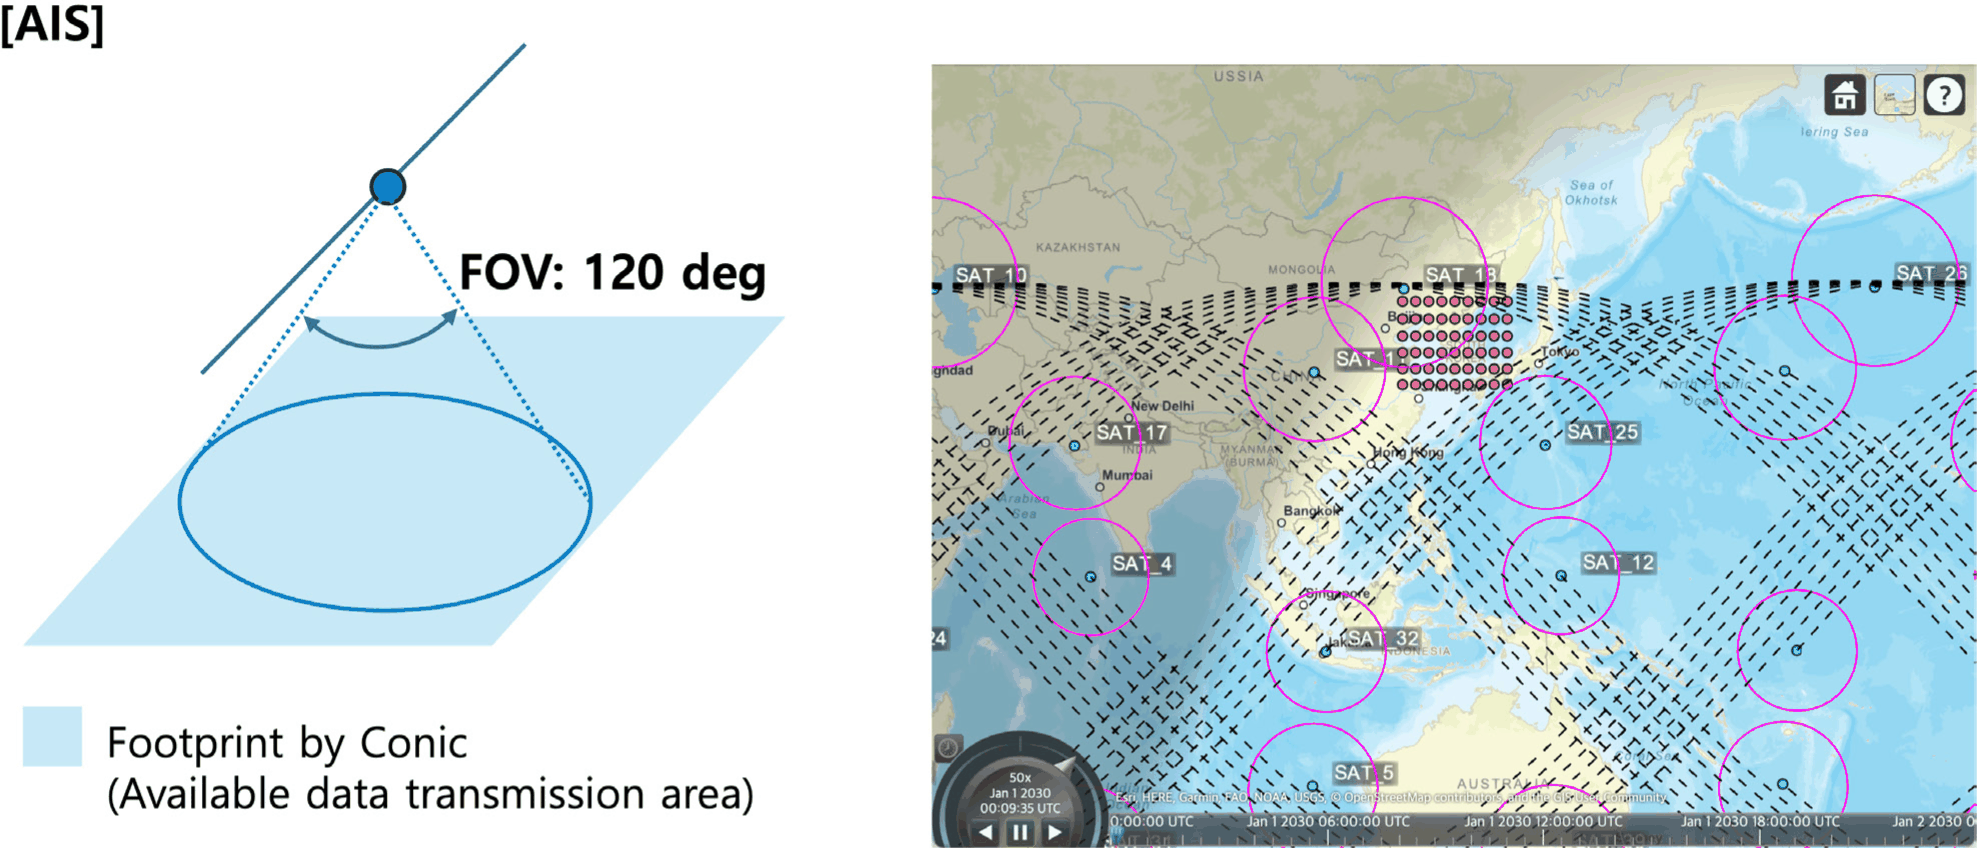
The AIS payload is primarily a signal reception–based sensor operating in the very high frequency (VHF) band, rather than an imaging system. Its performance is therefore governed by the spatial extent over which AIS messages transmitted from maritime targets can be successfully received. To represent this wide-area reception capability, a large sensor field of view of 120 degrees is assumed.
The ground footprint of the AIS payload is constructed by intersecting a wide conical sensor, centered along the satellite boresight direction, with the Earth’s surface. This intersection results in a large circular footprint, as illustrated in Fig. 3, representing the available AIS data reception area. All ground observation points located within this footprint are considered accessible for AIS reception.
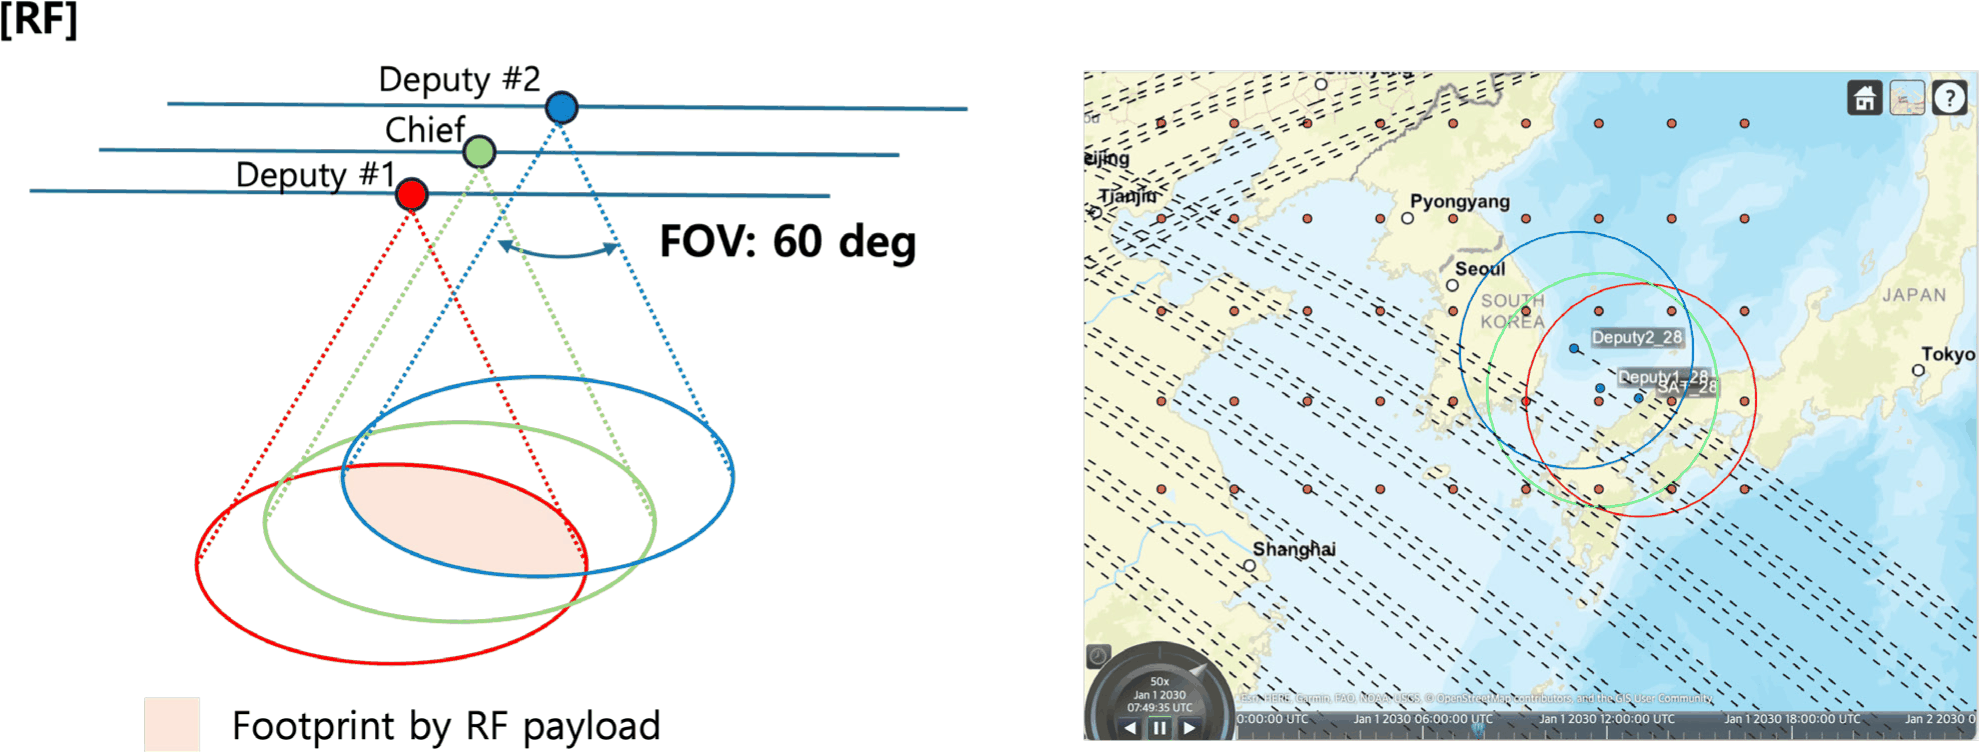
The RF payload is modeled with a moderate field of view of 60 degrees, reflecting the directional characteristics of typical RF antennas and beam patterns. Unlike AIS, RF sensing performance is closely tied to antenna directivity, signal-to-noise ratio, and geometric diversity, making excessively wide FOV assumptions less representative.
In this study, the RF payload operates in a formation-flying configuration consisting of one chief satellite and two deputy satellites. Each satellite generates its own conical footprint, and the resulting ground coverage is determined by the spatial relationship among these overlapping footprints, as shown in Fig. 4. The formation geometry enables cooperative sensing effects, such as enhanced coverage robustness and improved geometric diversity. Depending on the mission definition, RF accessibility may be evaluated using either the union or intersection of the individual footprints, allowing the framework to represent different cooperative RF sensing concepts.
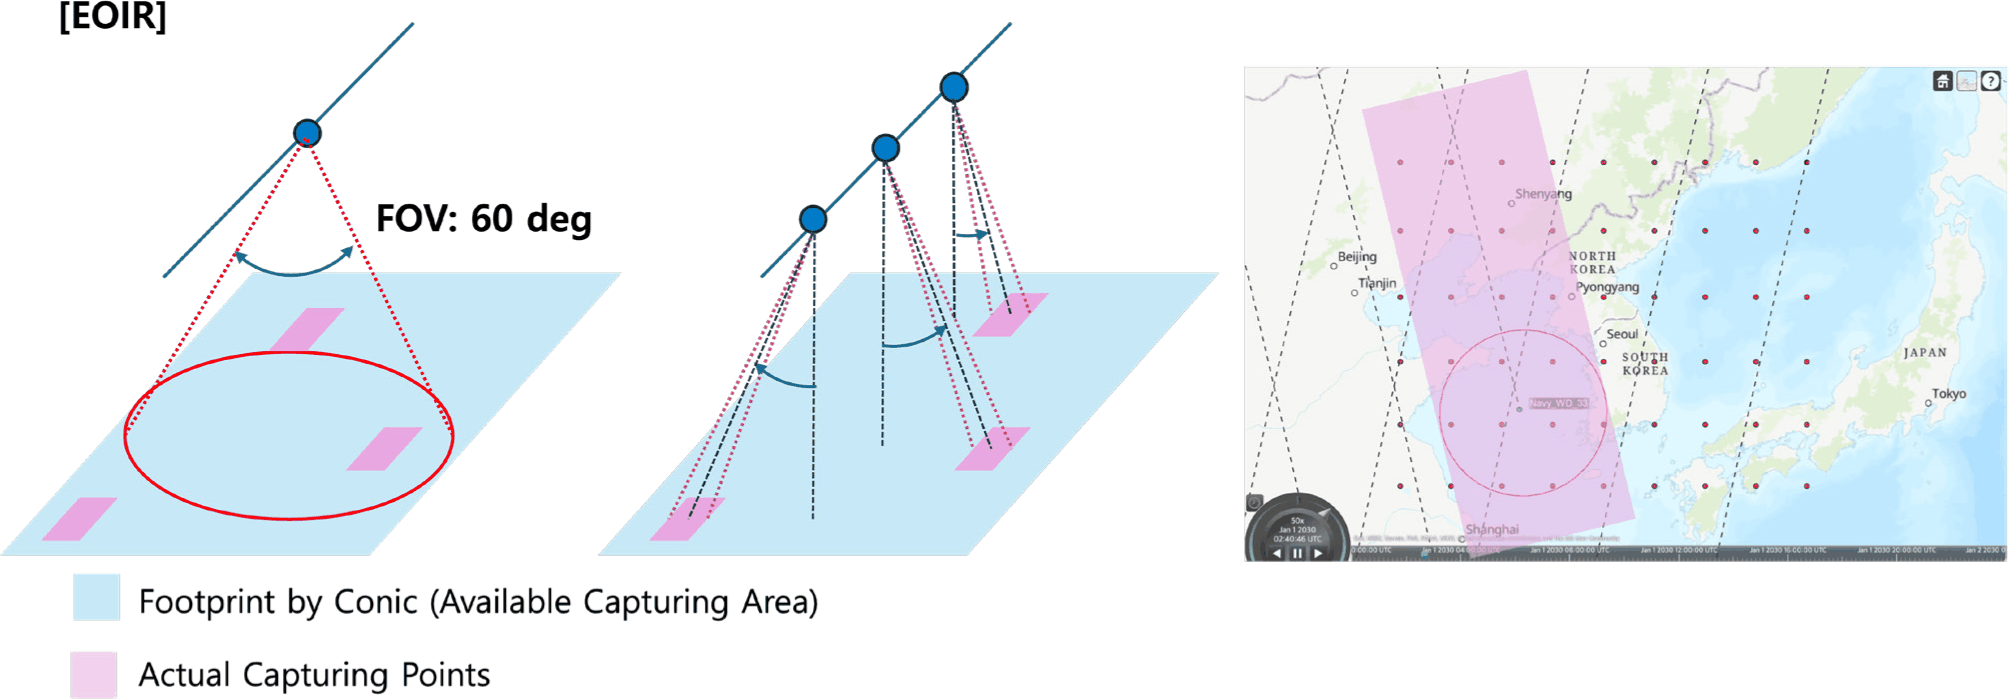
The EO/IR payload represents an optical imaging sensor whose observation capability is constrained by optical design limits, achievable ground sampling distance, and pointing constraints. A field of view of 60 degrees is selected to represent a realistic trade-off between spatial coverage and imaging performance.
The EO/IR ground footprint is obtained by intersecting the conical sensor with the Earth’s surface, defining a continuous region in which imaging is geometrically feasible. However, unlike signal reception–based payloads, EO/IR imaging does not occur continuously across the entire footprint. Instead, actual image acquisition is performed at discrete time instances and locations, depending on mission tasking and operational constraints. As illustrated in Fig. 5, the model therefore distinguishes between the available imaging footprint and the actual observational points selected within this region. This distinction enables a more realistic representation of EO/IR mission execution while preserving a simple geometric access model.
The SAR payload fundamentally differs from the other payloads due to its side-looking imaging geometry and swath-based observation characteristics. SAR ground coverage is primarily defined by the incidence angle, which is the angle between the radar line of sight and the local surface normal at the ground target. Operational SAR systems typically image targets within a bounded incidence angle range, corresponding to near-range and far-range limits of the radar swath.
To capture this behavior, the SAR footprint is modeled using two conical sensors corresponding to lower and upper incidence angle bounds. In this study, incidence angles of 15 degrees and 35 degrees are selected to represent the near-range and far-range limits of the SAR swath, respectively, which is equivalent 30 degrees and 70 degrees FOV in conical sensor. The SAR ground footprint is then constructed as the region between these two conical intersections with the Earth’s surface, effectively forming an elongated strip-shaped footprint, as shown in Fig. 6.
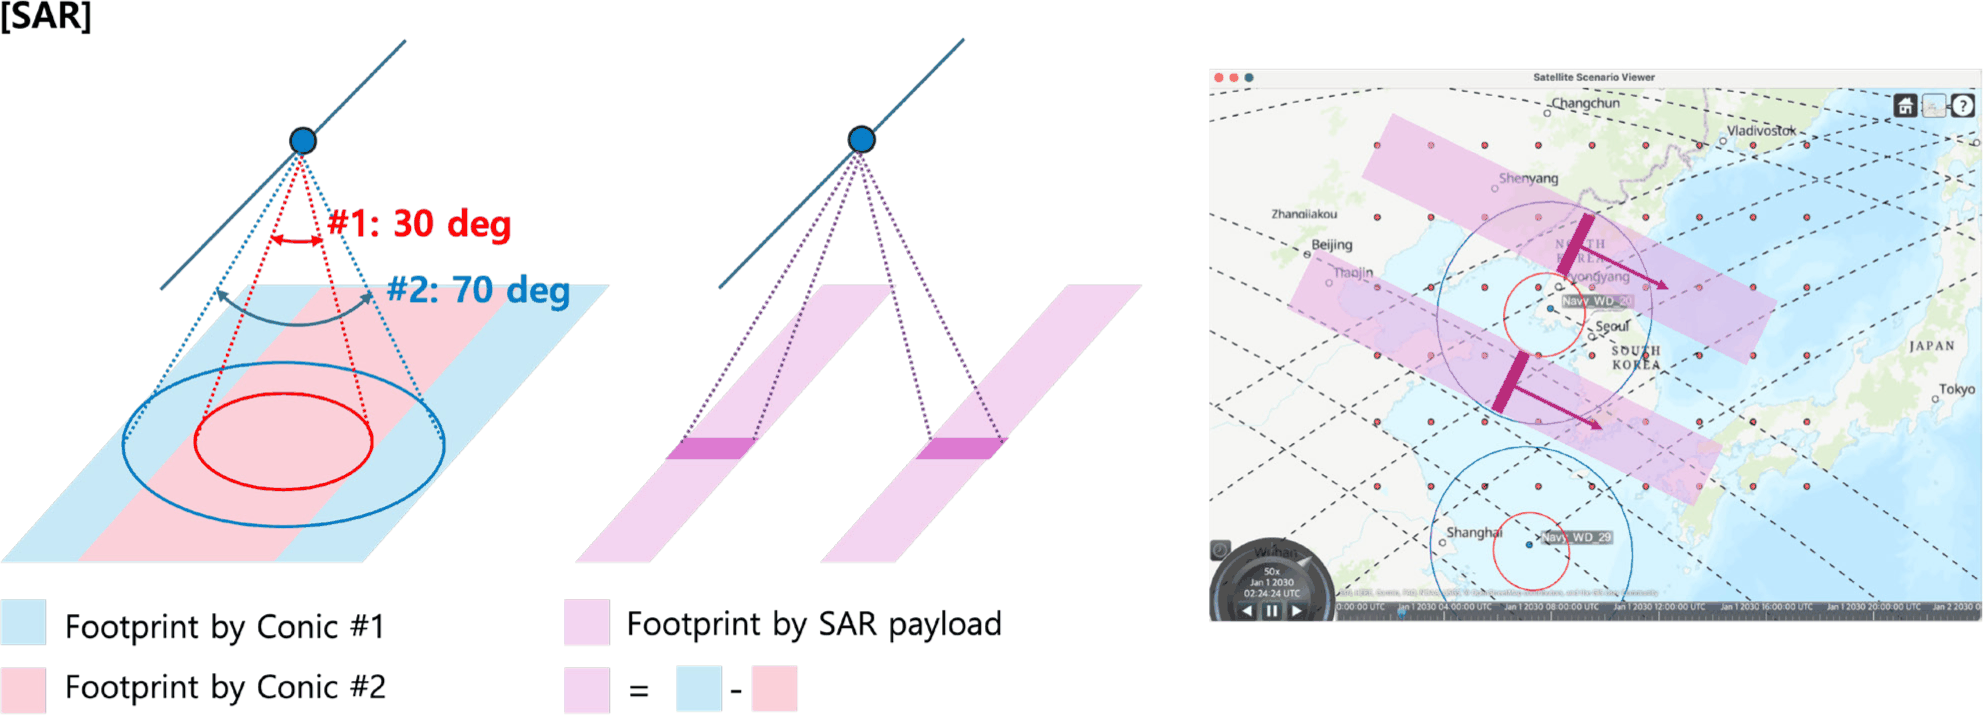
This approach approximates a stripmap SAR observation geometry, where the swath width is determined by the incidence angle range, and the along-track extent of the footprint emerges naturally through satellite motion over time. By explicitly incorporating incidence angle constraints, the model captures the essential geometric characteristics of SAR observations while remaining compatible with the unified conical sensor–based access analysis framework.
Ground observation points are defined to evaluate satellite coverage and revisit performance over regions of interest. Each observation point is specified by its latitude and longitude coordinates and represents a fixed target location for access analysis.
As shown in Fig. 7, a total set of ground observation points is distributed over the Korean Peninsula and surrounding maritime regions, including the Yellow Sea, East China Sea, and East Sea. Also, as shown in Table 3. The points are arranged on a structured latitude–longitude grid to ensure spatially uniform coverage and to enable systematic comparison of revisit time and coverage duration across different locations.
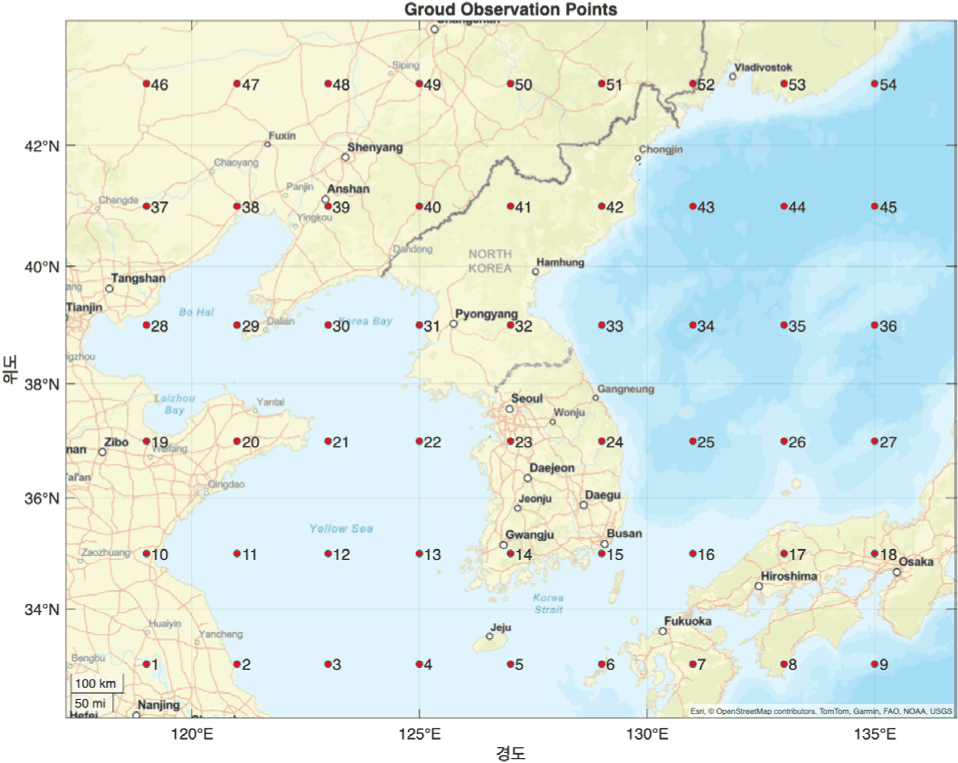
The use of a 2° grid spacing represents a deliberate balance between spatial resolution and computational tractability. While excessively dense grids may lead to redundant sampling and unnecessary computational overhead, overly coarse grids may fail to capture spatial variations in revisit characteristics across the region. The selected spacing ensures spatially uniform sampling of the entire observation region while maintaining a manageable number of observation points for large-scale constellation simulations.
Beyond evaluating revisit time at individual locations, the primary objective of this grid-based configuration is to assess region-level revisit performance. By distributing observation points uniformly over both the Korean Peninsula and its surrounding seas, the proposed setup enables the measurement of how long it takes for a satellite constellation to re-observe all areas within the region. In particular, the distribution of revisit times across all ground points provides insight into spatial coverage consistency, while the maximum revisit time among all points represents the worst-case time required to re-cover the entire region.
In low Earth orbit environments, the Earth’s oblateness effect, represented by the J2 perturbation, induces secular variations in orbital elements such as the right ascension of the ascending node and the argument of perigee. These perturbations result in gradual changes in the effective orbital period and relative phasing among satellites, which can significantly degrade the intended geometric structure of a constellation when classical idealized deployment methods are applied.
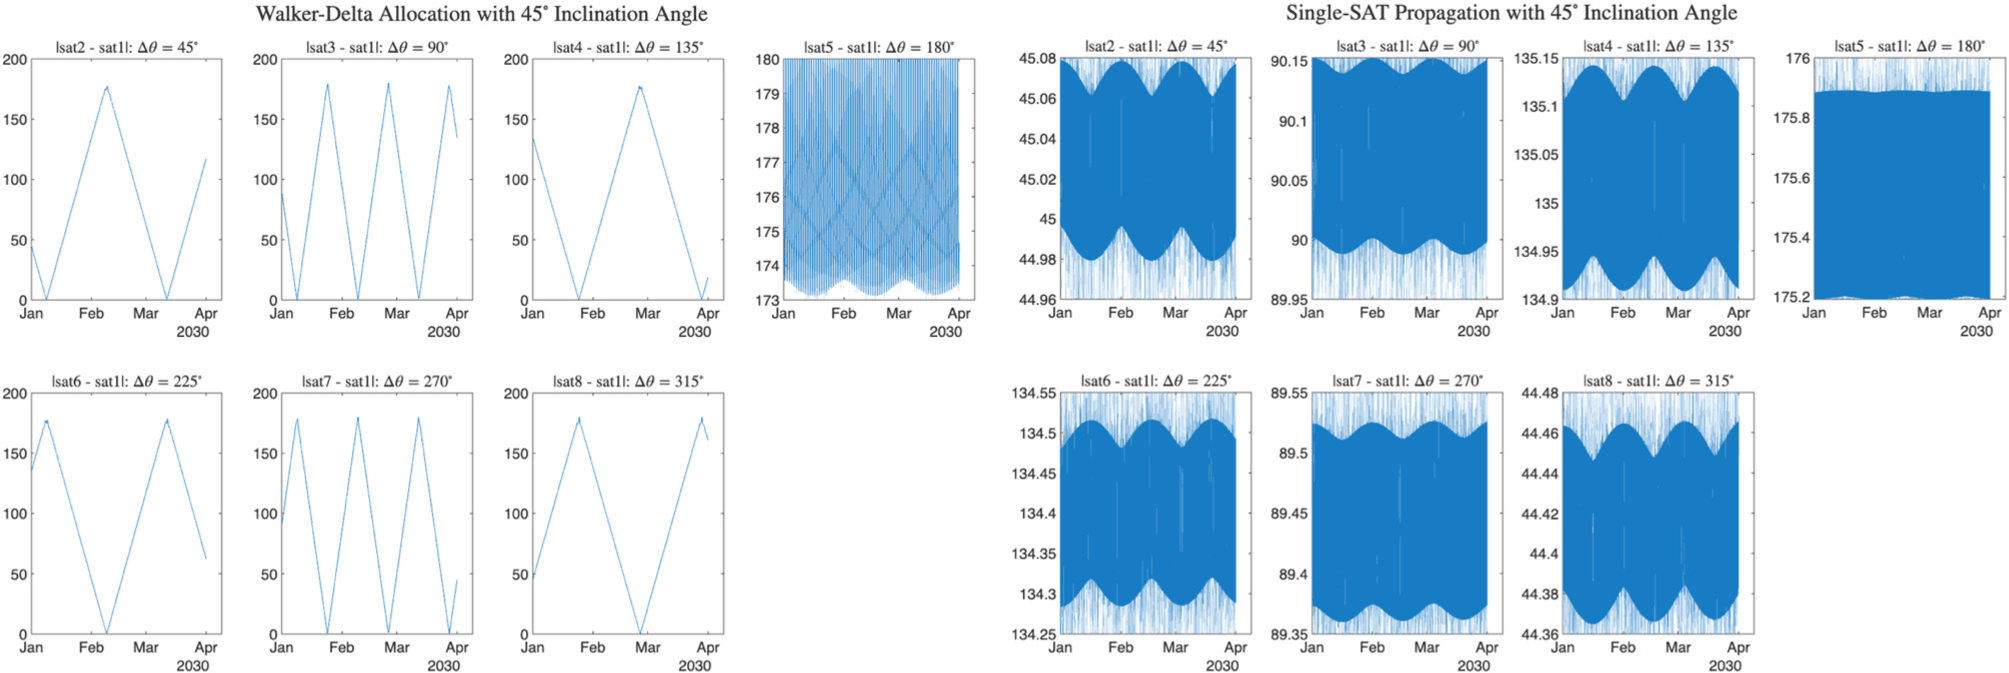
The conventional Walker–Delta constellation design assumes idealized Keplerian motion and assigns satellites using uniform phase spacing based on prescribed orbital elements. While this approach ensures uniform distribution in a two-body environment, it does not guarantee identical realized orbital periods under J2-perturbed dynamics. As a result, satellites initialized using classical Walker–Delta parameters experience differential along-track drift over time, leading to the loss of uniform spacing and temporal synchronization. This behavior is illustrated in Fig. 8, where satellites deployed using the standard Walker–Delta function exhibit noticeable phase divergence when propagated under J2 perturbations.
To address this limitation, this study proposes a pilot-satellite-based initial deployment algorithm that explicitly accounts for J2-perturbed orbital dynamics. The overall procedure is summarized in Fig. 9.
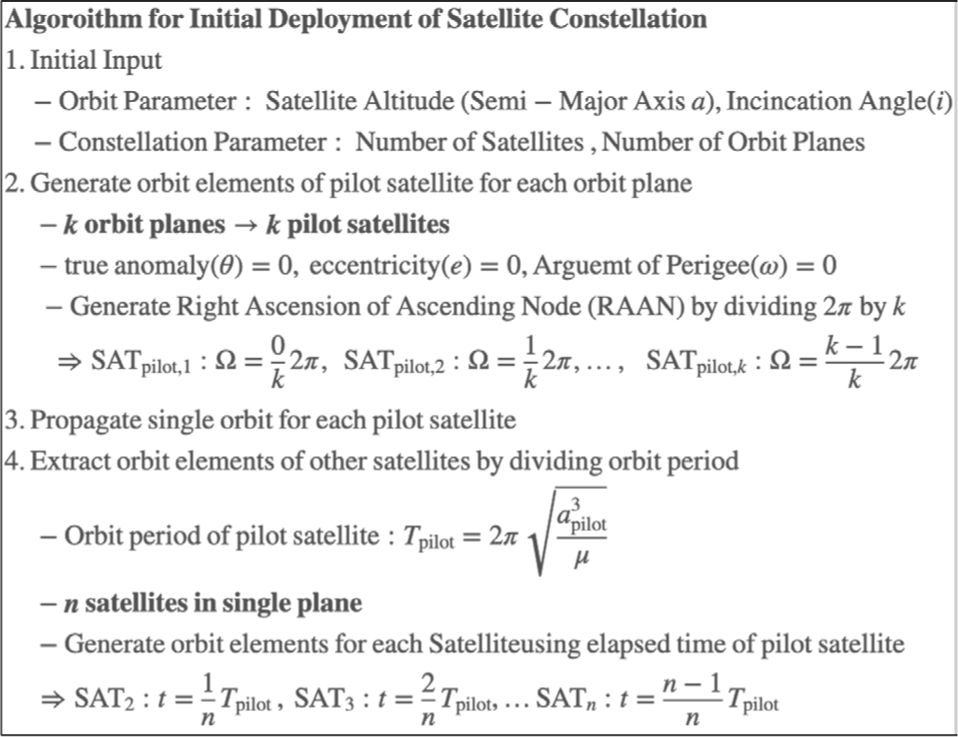
For each orbital plane, a pilot satellite is first initialized using conventional Walker–Delta plane spacing, particularly uniform right ascension of ascending node (RAAN) separation across planes. The pilot satellite is then numerically propagated for one full orbital period using the selected orbit propagator, ensuring that realistic perturbation effects are captured.
After propagation, the elapsed-time history of the pilot satellite is used as a reference trajectory. The remaining satellites within the same orbital plane are generated by extracting orbital states or orbital elements at evenly spaced time fractions of the pilot satellite’s propagated trajectory.
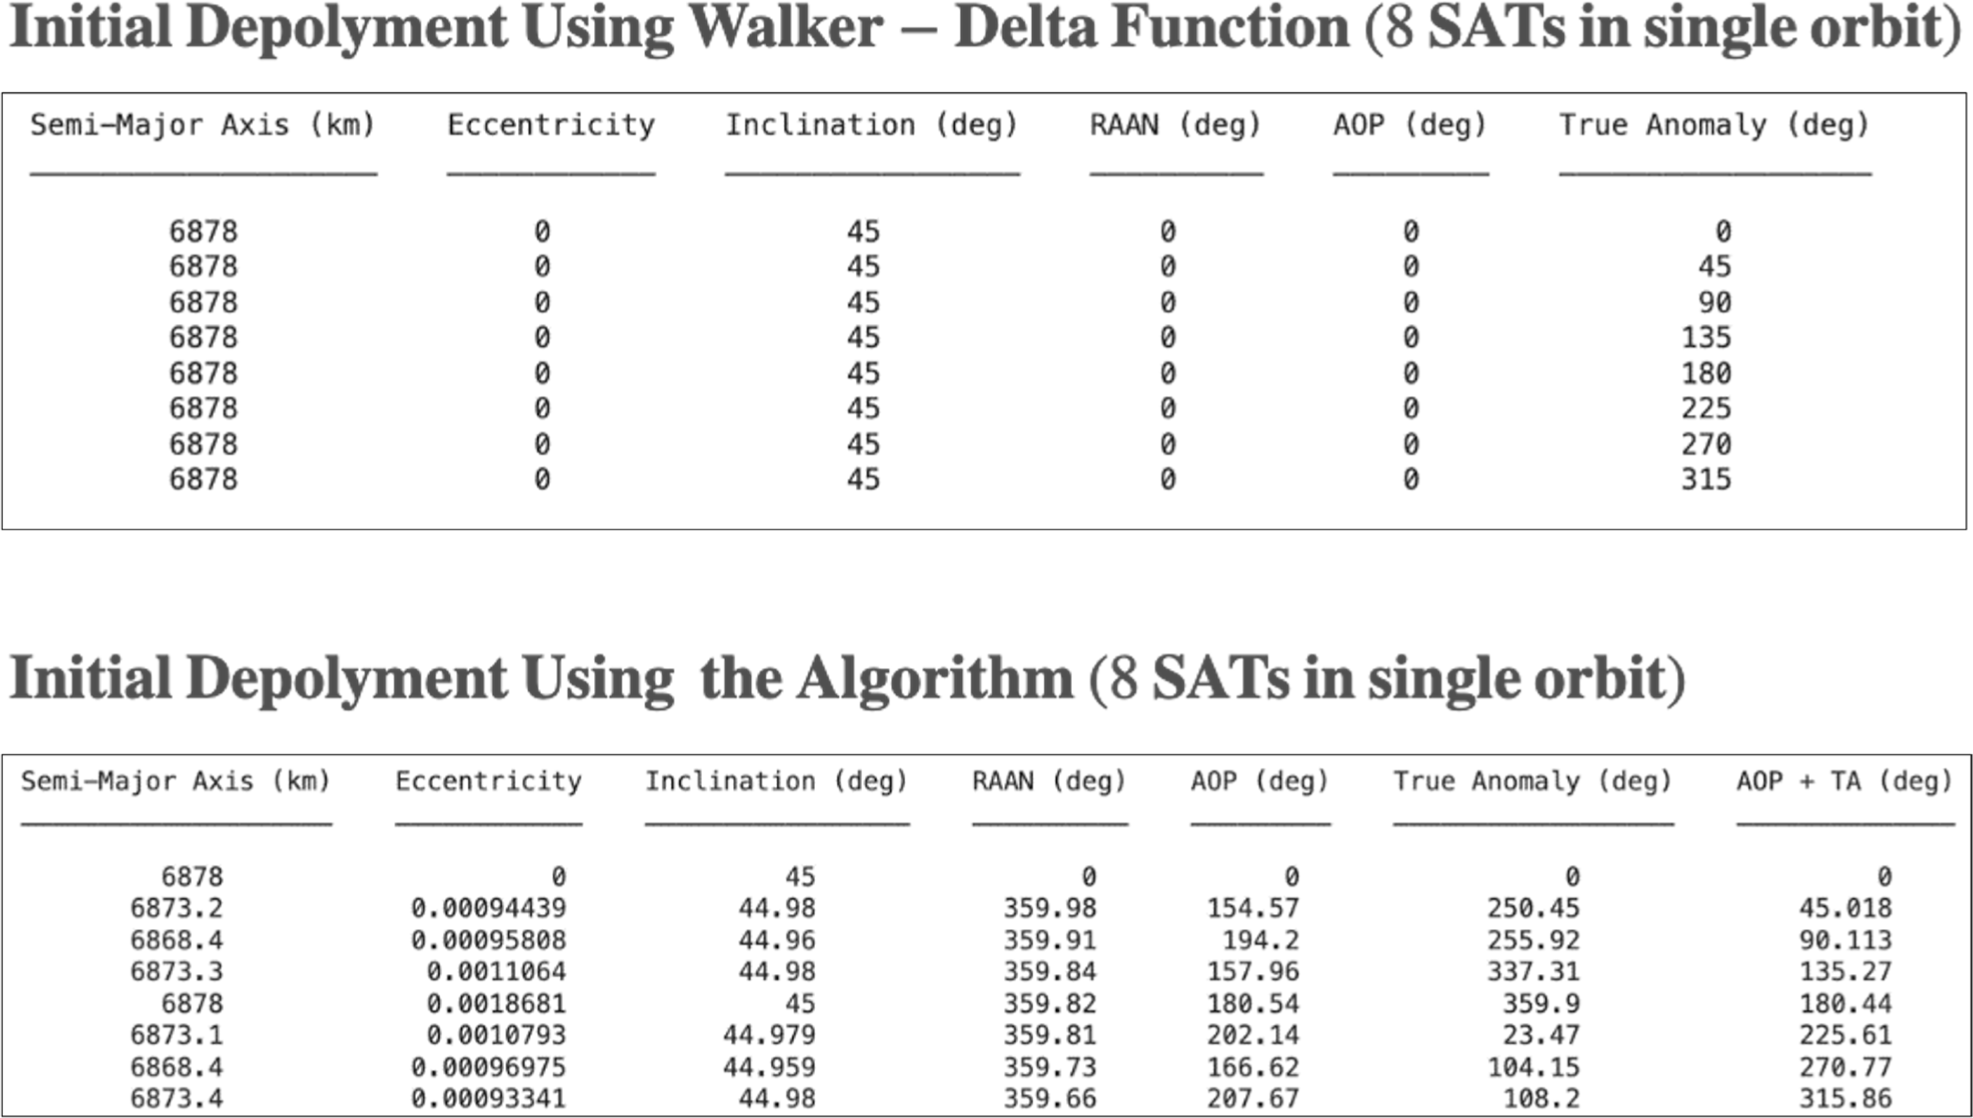
Fig. 10 describes the difference between conventional Walker-Delta deployment and proposed pilot satellite propagation method. 8 Satellites are deployed in single orbit. The figure indicates that every orbital parameter which were constant in Walker-Delta has certain perturbation in Pilot-based Algorithm.
This approach guarantees uniform along-track spacing while enforcing identical realized orbital periods for all satellites within the plane, since all satellites are constructed from a single numerically propagated trajectory.
By deriving satellite placements directly from propagated orbits rather than from idealized orbital elements, the proposed method preserves constellation geometry under J2 perturbations. As demonstrated in Fig. 8, satellites deployed using the pilot-satellite-based approach maintain stable relative phasing and consistent orbital periods, in contrast to the classical Walker–Delta deployment.
Consequently, the proposed orbit design method provides a more realistic and robust initialization strategy for constellation simulations in perturbed environments. This is particularly important for coverage and revisit-time analyses, where long-term temporal consistency and relative satellite spacing directly affect mission performance metrics.
The contact sequence charts are generated from the access analysis results and provide a time-ordered representation of satellite–ground visibility for each payload type. These charts serve as the basis for subsequent coverage and scheduling analyses.
AIS contact sequence chart is shown in Table 4. Each row in the table represents a single access event between a satellite and a ground observation point. The table consists of five columns: Source, Target, StartTime, EndTime, and Duration.
Here, Source denotes the ground observation point, Target represents the satellite or payload identifier, and StartTime and EndTime indicate the beginning and end of the access interval, respectively. The Duration column specifies the total contact time for each event.
The EO/IR contact sequence chart, shown in Table 5, contains all geometrically feasible observation opportunities derived from the access analysis. As discussed previously, no satellite-level operational constraints—such as minimum imaging interval or task prioritization—are imposed at this stage. Consequently, the chart represents the complete set of potential EO/IR capture events allowed by geometry alone.
In practice, EO/IR missions require additional scheduling constraints, including minimum time gaps between consecutive imaging operations and onboard resource limitations. Therefore, a subsequent selection process is required to extract a feasible observation schedule from this contact sequence chart by applying mission-specific constraints.
For the RF payload, the contact sequence chart focuses on cooperative reception events involving multiple satellites. As illustrated in Table 6, only access intervals during which a single ground observation point is simultaneously observed by three or more satellites are considered valid. This condition reflects the requirement that signals must be received concurrently by the chief satellite and at least two deputy satellites.
To generate this chart, contact sequences for the chief satellite and both deputy satellites are first computed independently. These individual contact intervals are then merged at the ground observation point level, and only time intervals where three or more overlapping contacts exist are extracted. The resulting chart therefore highlights RF contact events that satisfy the cooperative sensing requirement imposed by the formation-flying configuration.
The SAR contact sequence chart, shown in Fig. 11, is constructed by combining two incidence-angle-based access results. As described earlier, SAR1 corresponds to contacts obtained using a smaller field of view (near-range incidence angles), while SAR2 represents contacts derived from a larger field of view (far-range incidence angles).
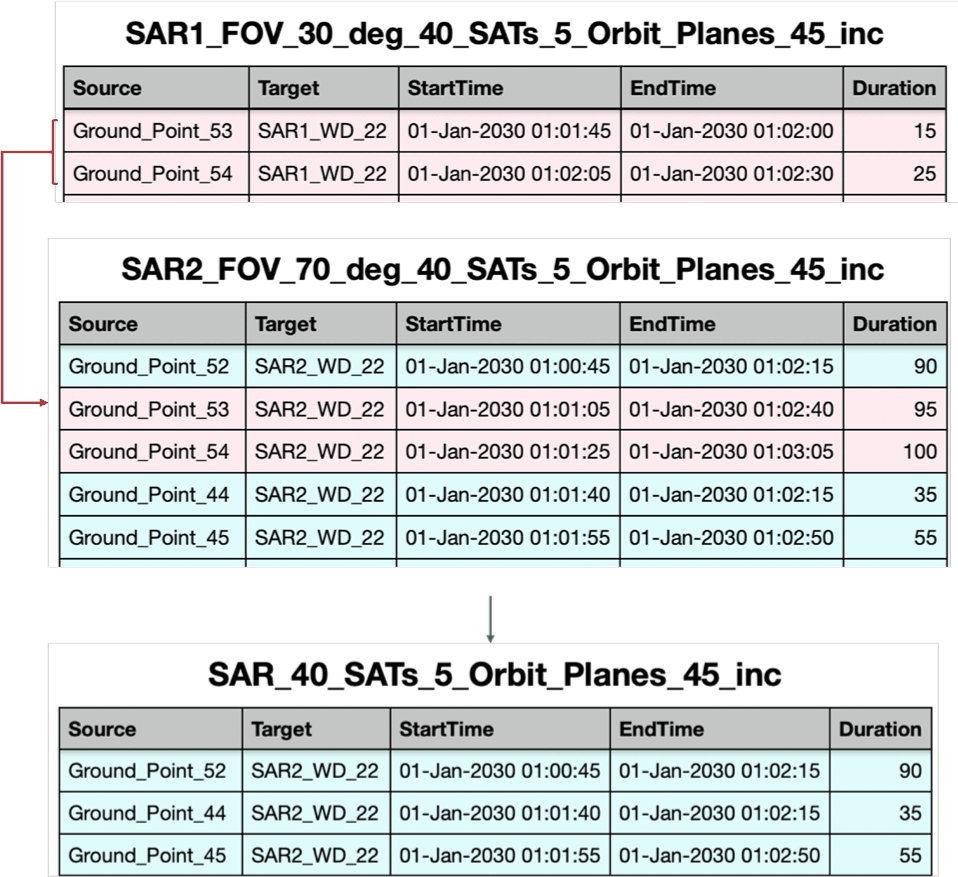
To form the final SAR contact sequence, SAR1 contact intervals are removed from the SAR2 contact set. This operation yields a contact chart that represents the effective SAR swath corresponding to the desired incidence angle range, while excluding regions associated with near-range observations. The resulting contact sequence therefore captures the strip-shaped SAR coverage consistent with the payload’s side-looking imaging characteristics.
3. SIMULATION SETUP
LEO satellite constellations generate characteristic ground trajectories due to the combined effects of orbital motion and Earth rotation. Understanding the geometric structure of these ground trajectories and their associated coverage footprints is essential for analyzing revisit performance and designing an efficient constellation configuration.
Fig. 12 illustrates the ground trajectories of LEO constellations for two representative cases: a near-polar inclination (98°) with an EO/IR payload and a mid-inclination orbit (45°) with a SAR payload. In both cases, the constellation consists of 16 satellites deployed in 4 orbit planes, with 4 satellites per plane. The yellow curves in the figure represent the ground trajectory traced by each satellite over one orbital period.
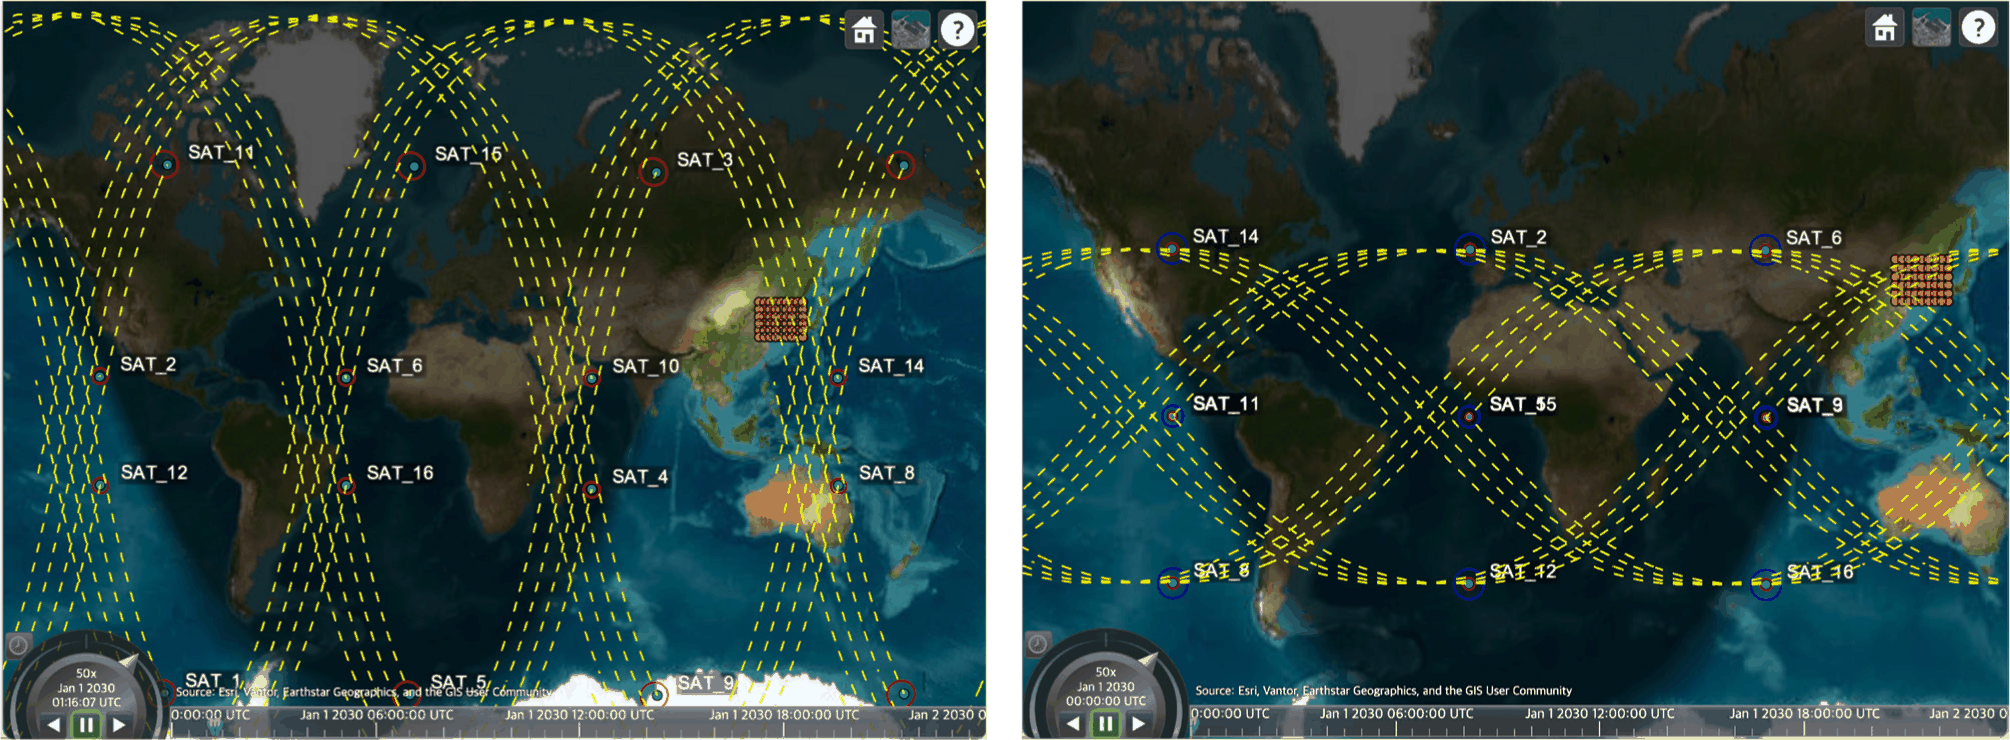
As shown in Fig. 12, satellites within the same orbit plane generate a set of closely spaced, nearly parallel ground trajectories, forming a trajectory band. Multiple such bands appear globally, each corresponding to a different orbit plane. The spacing between adjacent trajectories within a single band is determined by the number of satellites deployed in that orbit plane, while the spacing between neighboring bands is governed by the number of orbit planes in the constellation.
Due to Earth rotation, these trajectory bands translate westward at an approximately constant angular speed. As a result, a fixed ground point experiences alternating periods of observation opportunities and observation gaps. When a trajectory band passes over a given ground location and the satellite FOV is sufficiently wide, the ground point may experience very short revisit times between successive satellite passes. Conversely, when the ground point lies between neighboring trajectory bands, a relatively long observation gap may occur until the next band arrives.
This qualitative behavior highlights that revisit performance is not solely determined by the total number of satellites, but rather by the geometric arrangement of satellites in orbit planes and the resulting spatial distribution of ground trajectories. Therefore, to quantitatively evaluate revisit characteristics and to design proposed constellation, it is necessary to extract meaningful geometric parameters from the ground trajectory structure.
Fig. 13 summarizes the key geometric structure underlying the ground trajectory patterns observed in Fig. 12. When multiple satellites are deployed in the same orbit plane, each satellite generates a nearly parallel ground trajectory, and the collection of these trajectories forms a trajectory band. The internal spacing of trajectories within a single band is primarily determined by the number of satellites assigned to that orbit plane.
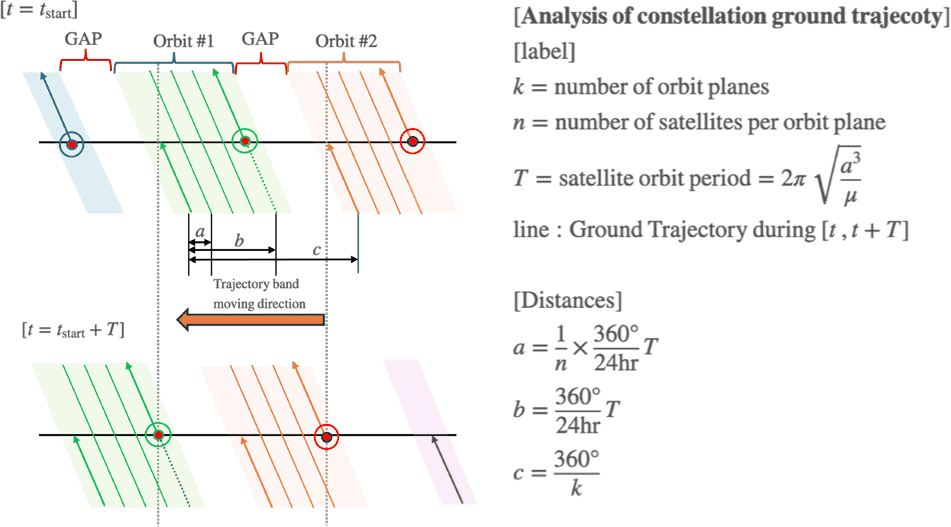
As Earth rotates beneath the satellite orbits, each trajectory band shifts westward at a nearly constant rate. Over one orbital period, this shift defines the longitudinal displacement of the entire band. Meanwhile, neighboring orbit planes generate adjacent trajectory bands, whose separation is governed by the total number of orbit planes in the constellation.
From a geometric perspective, three distances fully characterize the ground trajectory structure:
a: the spacing between adjacent trajectories within the same band
b: the longitudinal shift of a band over one orbital period
c: the angular separation between neighboring orbit planes
The relative magnitudes of these distances determine whether coverage gaps exist between trajectory bands. If the spacing between neighboring bands is larger than the effective width covered by the trajectories and the sensor footprint, ground points located between bands will experience observation gaps. Conversely, when the longitudinal spacing between bands closely matches the combined width of the trajectory band and its westward shift, the ground trajectory pattern becomes quasi-periodic, and coverage gaps are minimized.
This geometric interpretation provides a direct and intuitive link between constellation design parameters, i.e., the number of orbit planes and the number of satellites per plane, and the resulting revisit-time characteristics observed at the ground level.
Based on the geometric interpretation introduced in Section 3.2, proposed constellation configuration can be derived from the payload FOV, orbital altitude, and the latitude of the ground observation region. The objective is to minimize the maximum revisit time by eliminating coverage gaps both within and between ground trajectory bands.
Fig. 14 shows the proposed EO/IR constellation operating in a 500 km circular LEO, consisting of 48 satellites distributed across 12 orbit planes, with four satellites per plane. For this altitude, the ground trajectory pattern exhibits a longitudinal shift of approximately 23.6 degrees over one orbital period. With four satellites in the same orbit plane, the spacing between adjacent ground trajectories within a single band is approximately 5.9 degrees in longitude.
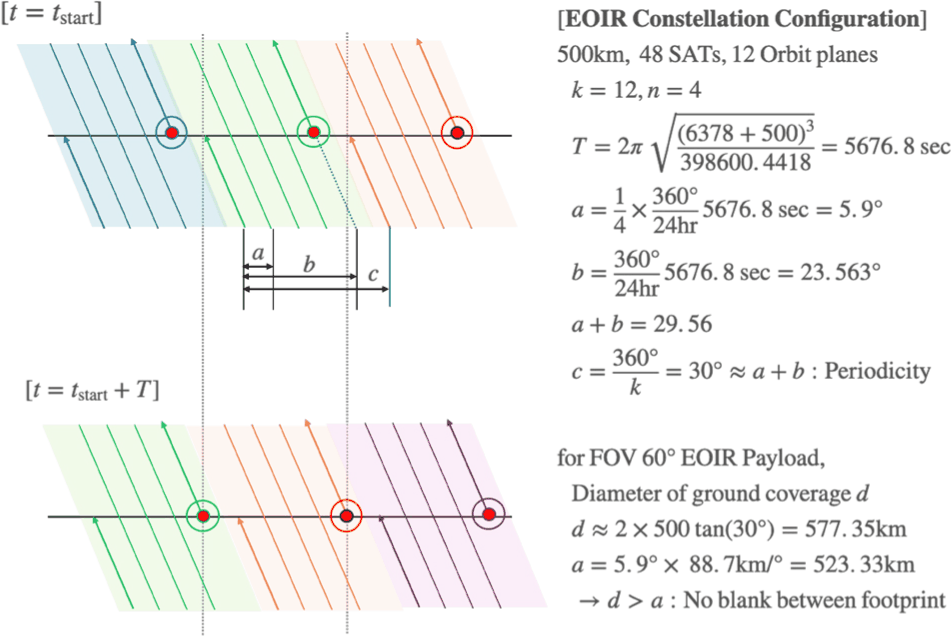
At a representative ground observation latitude of 37 degrees, 1 degree of longitude corresponds to approximately 88.7 km. Therefore, the intra-band spacing between neighboring ground trajectories translates to about 523 km on the Earth’s surface. For an EO/IR payload with a 60-degree FOV, the resulting ground footprint diameter at 500 km altitude is approximately 577 km, which is larger than the spacing between adjacent trajectories. This ensures continuous coverage within each trajectory band without intra-band gaps.
The selection of 12 orbit planes is motivated by the spacing between neighboring trajectory bands. With this configuration, the longitudinal separation between adjacent orbit planes is 30 degrees, which closely matches the combined effect of the trajectory band width and its westward shift over one orbital period (i.e., the condition c ≈ a + b). As a result, neighboring trajectory bands align without leaving uncovered regions between them, effectively eliminating inter-band coverage gaps.
By simultaneously satisfying the conditions that the sensor footprint exceeds the intra-band trajectory spacing and that adjacent trajectory bands connect without gaps, the proposed 48-satellite, 12-plane constellation achieves a near-continuous ground coverage pattern. This geometric alignment directly leads to a reduction in the maximum revisit time at the target latitude and explains the rationale behind selecting this constellation configuration for the EO/IR mission.
Fig. 15 extends the analysis to constellations with 12 orbit planes for both high-inclination (98°) EO/IR missions and mid-inclination (45°) SAR missions. In both cases, the ground trajectory patterns exhibit the desired band-like structure predicted by the geometric analysis, confirming the generality of the proposed framework.
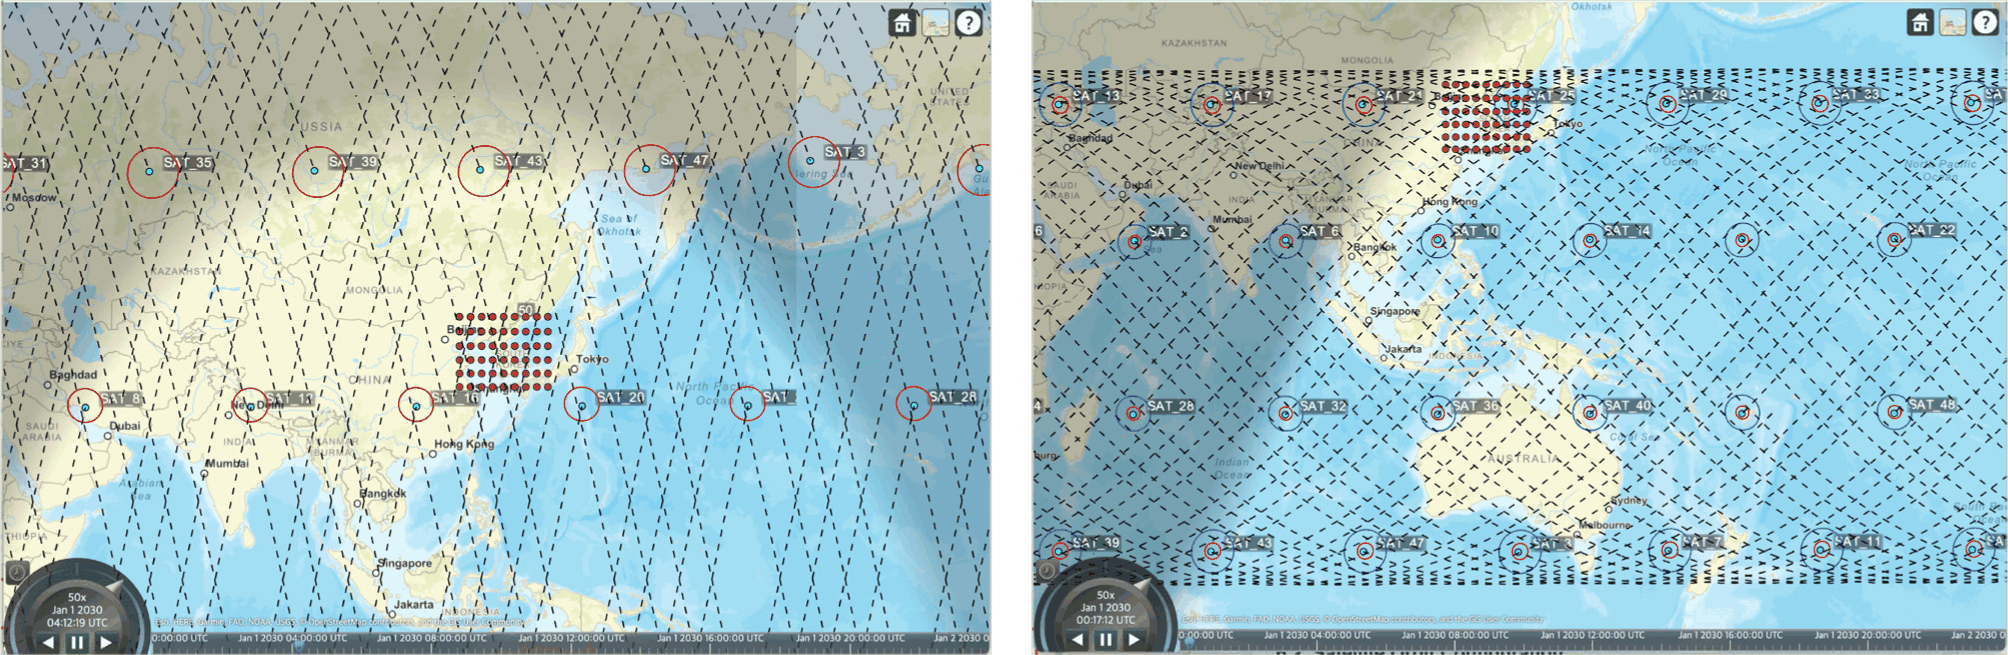
While the EO/IR case prioritizes minimizing revisit time at specific ground locations, SAR and RF payloads often emphasize different performance metrics, such as global coverage uniformity or revisit distribution over broader regions. Therefore, the same constellation geometry can produce distinct revisit-time histories depending on orbit inclination and payload characteristics. This motivates a comparative analysis of revisit-time distributions across payload types, which is addressed in the subsequent sections.
Table 7 summarizes the overall simulation setup adopted in this study to evaluate revisit-time characteristics across different payload types.
The AIS payload was configured differently from the other payload types due to its inherently wide field-of-view and broad-area monitoring objective. With an effective FOV of 120°, AIS coverage is less sensitive to fine orbit-plane spacing, as a single satellite pass can cover a large ground swath. Therefore, AIS simulations focused on relatively sparse constellations consisting of 10 to 16 satellites, distributed with two satellites per orbit plane. In contrast, EO/IR, SAR, and RF payloads were simulated using a common constellation configuration of 48 satellites deployed across 12 orbit planes with four satellites per plane. This configuration was selected based on the geometric analysis presented in Section 3, which showed that this arrangement minimizes coverage gaps between neighboring ground trajectory bands while maintaining continuous coverage within each band.
4. SIMULATION RESULTS
Fig. 16 shows the revisit-time distribution for AIS payloads with increasing constellation sizes at 45° inclination. As the number of satellites and orbit planes increases from 10 satellites (5 planes) to 12 satellites (6 planes), a noticeable reduction in maximum revisit time is observed across most ground observation points.
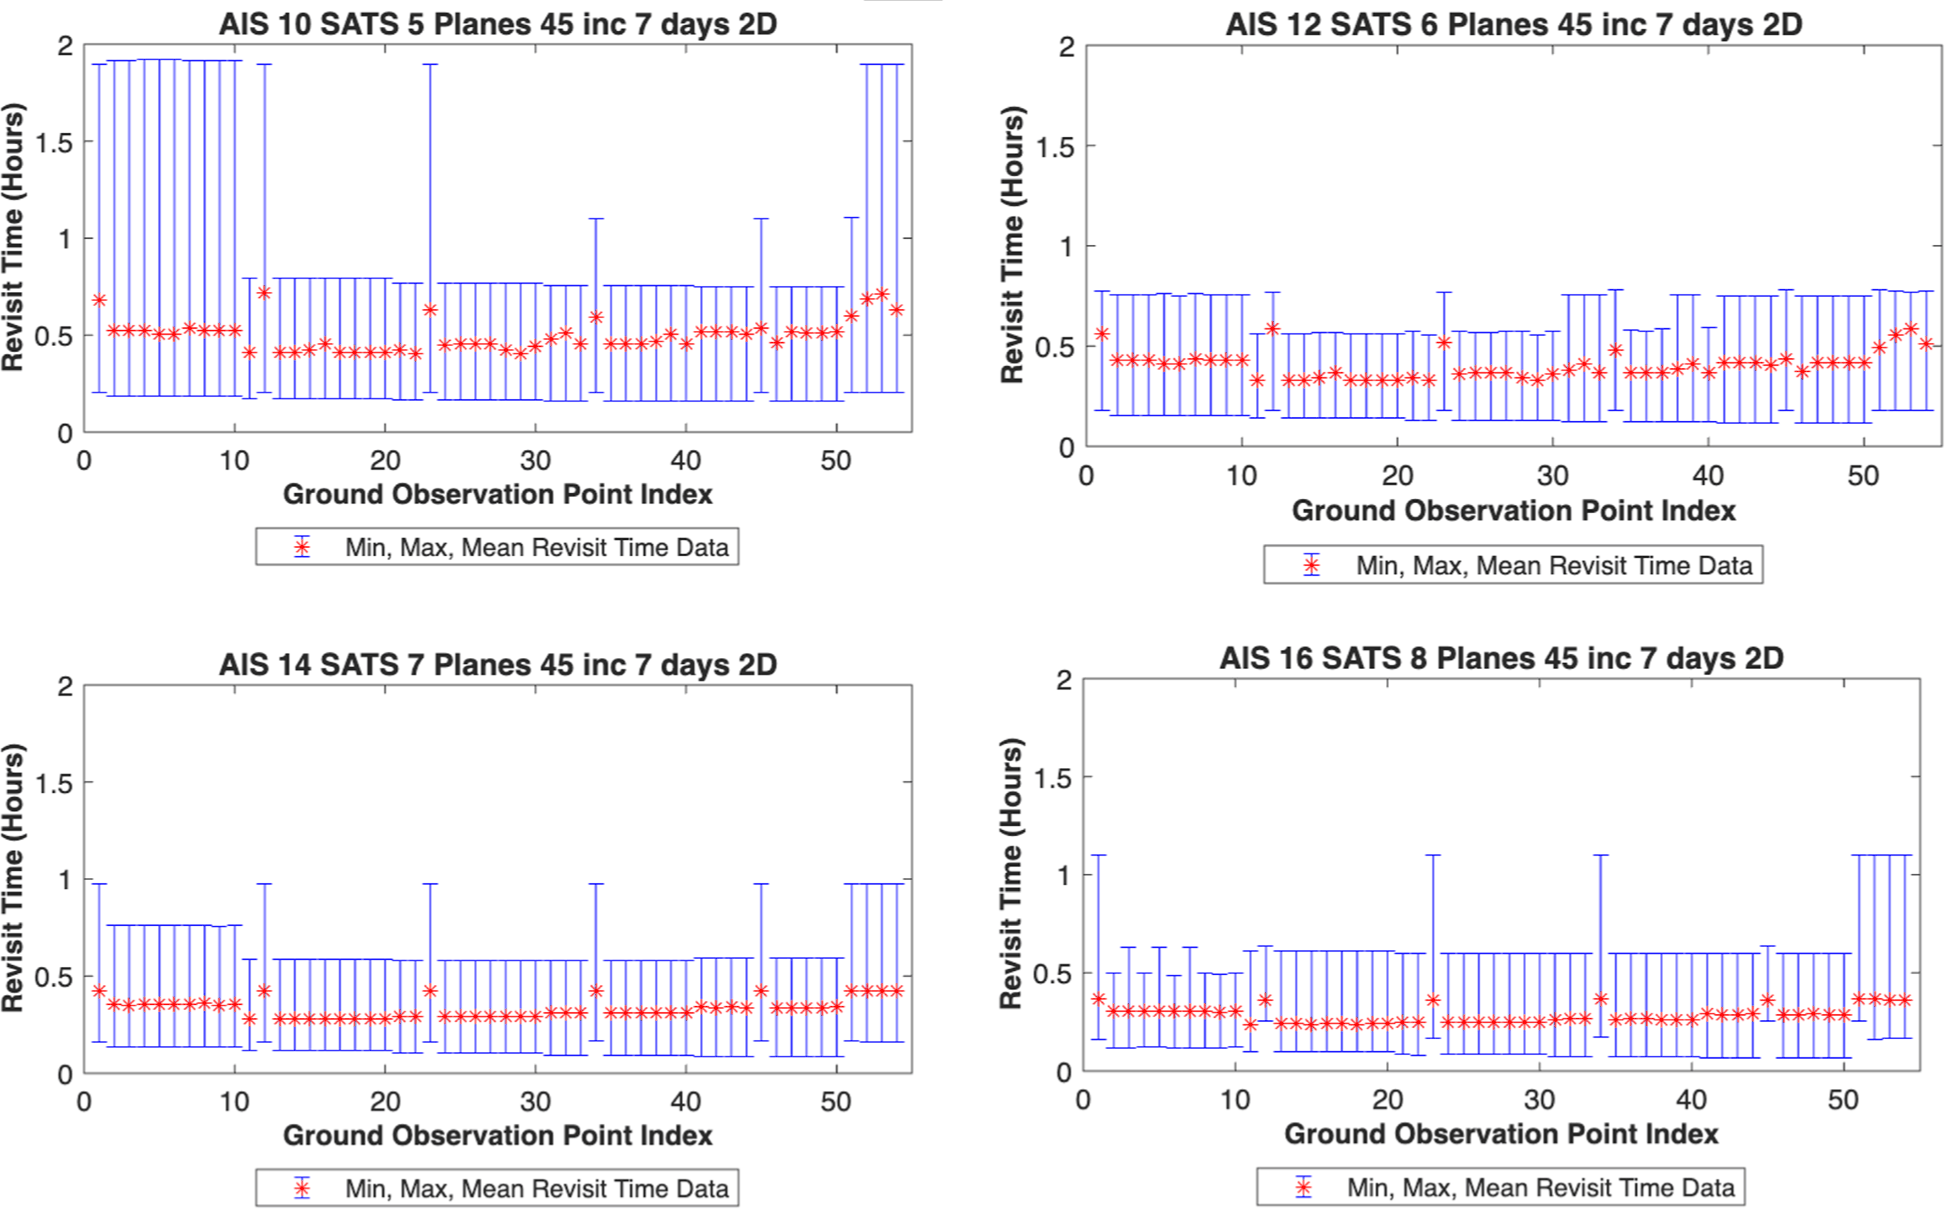
However, beyond the 12-satellite, 6-plane configuration, further increases in the number of satellites yield diminishing improvements in maximum revisit time. The mean revisit time becomes relatively uniform, and the upper bound of revisit intervals no longer decreases significantly. This behavior indicates a saturation effect, where the ground trajectory bands already sufficiently overlap due to Earth rotation and wide AIS FOV, and additional satellites do not fundamentally alter the ground coverage geometry.
Fig. 17 presents the revisit-time distribution for the EO/IR payload using the 48-satellite, 12-plane constellation at 98° inclination. The distribution shows relatively consistent mean revisit times across all ground observation points, with bounded minimum and maximum values, indicating uniform coverage performance over the region of interest. The combined histogram reveals that revisit times cluster around several discrete intervals rather than forming a continuous distribution.
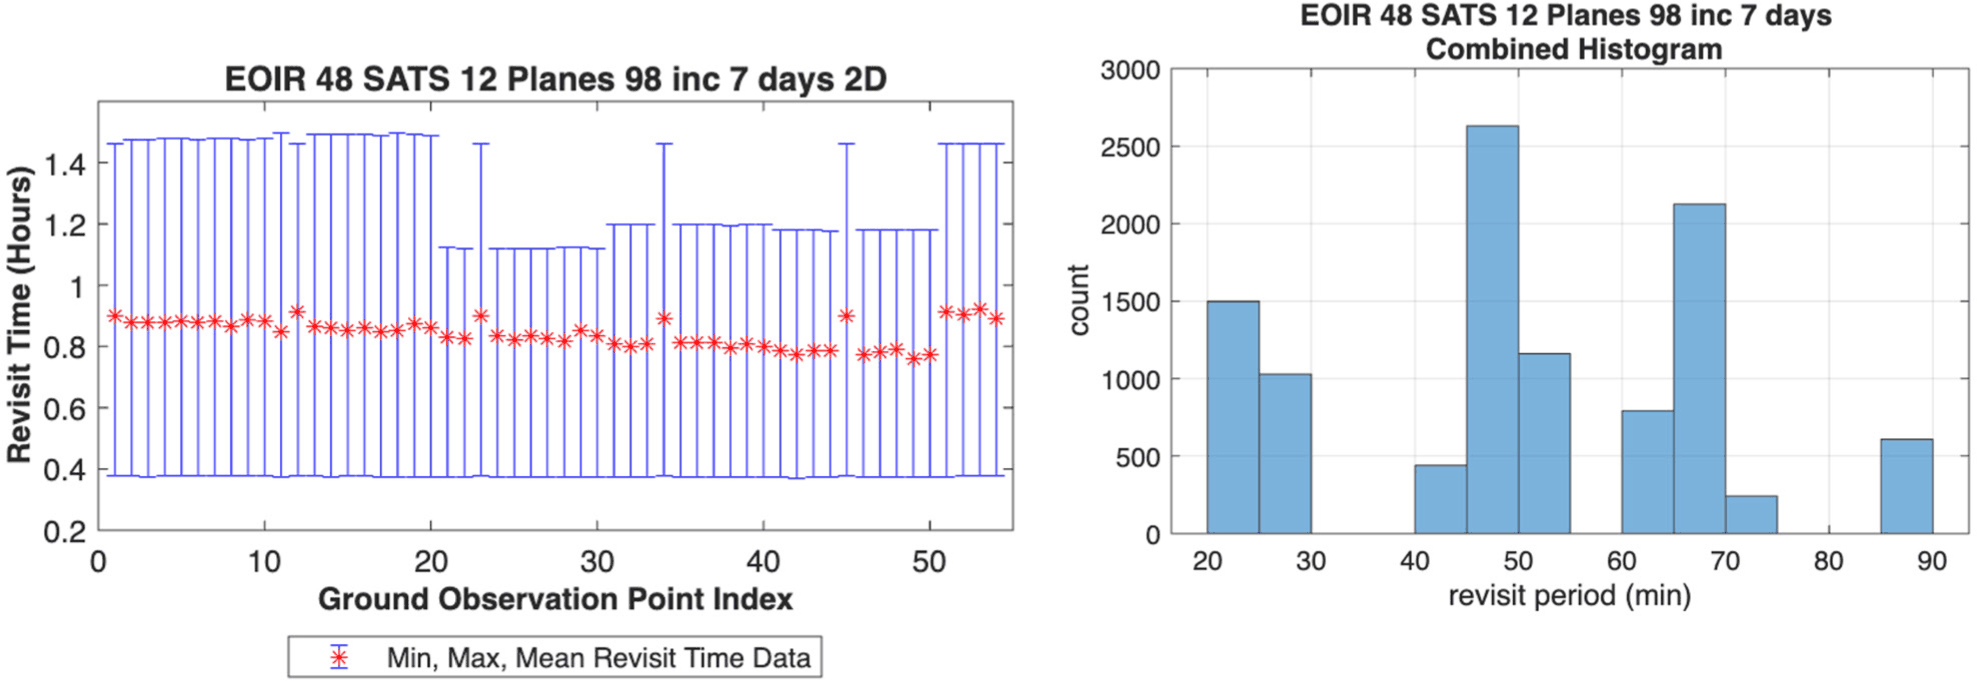
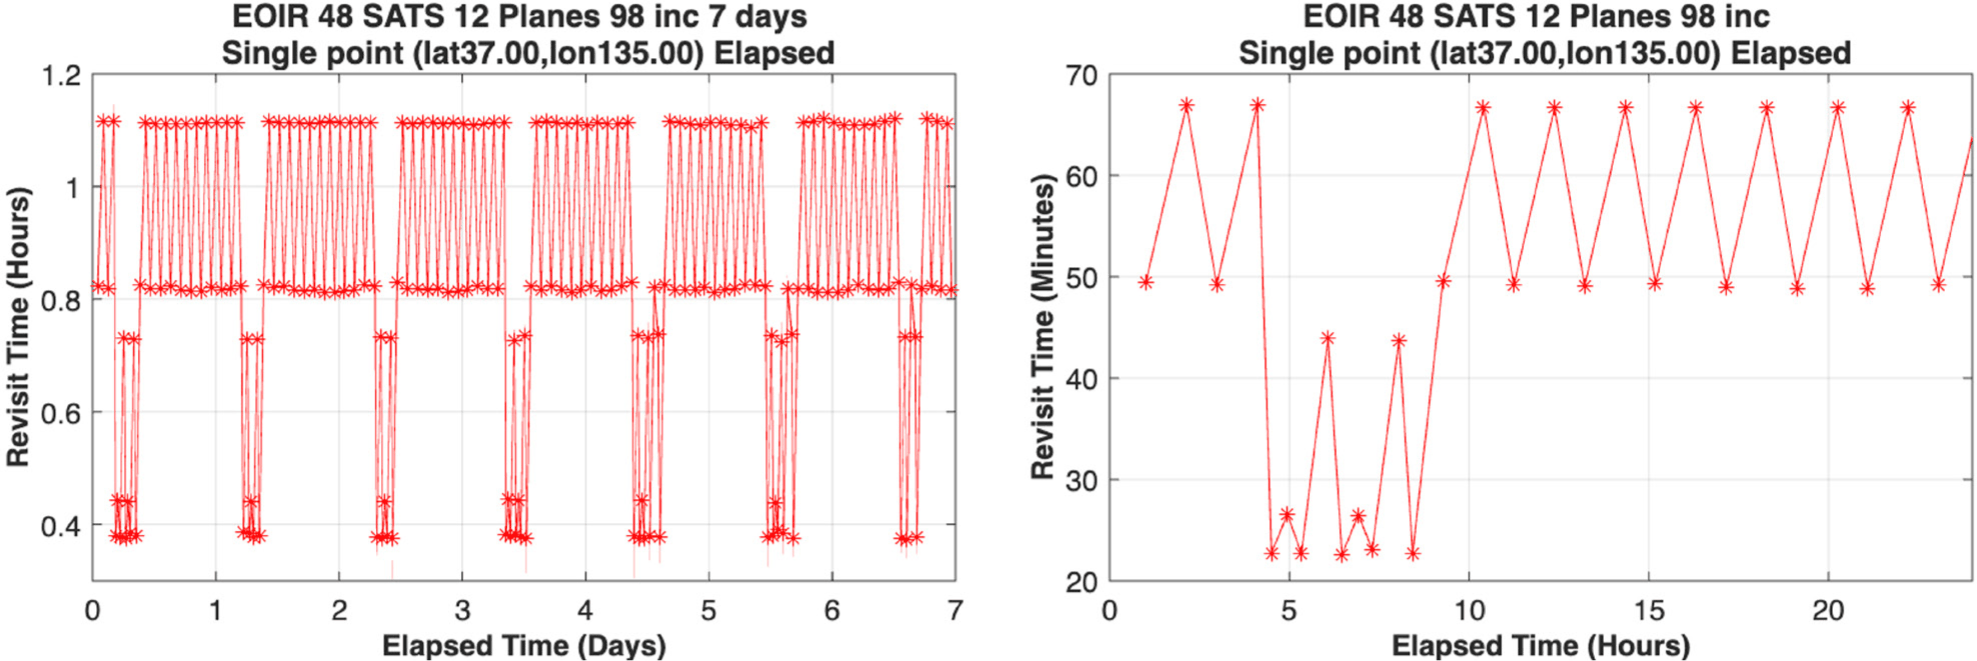
This behavior becomes more evident in the single-point revisit-time history shown in Fig. 18. For a fixed ground location, revisit times repeat in a structured, quasi-periodic. This periodicity arises from the regular passage of trajectory bands over the ground point, as discussed in Section 3.1. When a trajectory band passes directly over the location, short revisit intervals occur due to successive satellites within the same band. Between band passages, longer revisit intervals appear, corresponding to the gap before the next orbit plane arrives. As Earth rotation causes this pattern to repeat, the revisit-time history exhibits recurring peaks and valleys with nearly constant spacing. This explains why revisit time distribution forms several discrete intervals, which is for single, Ground station, 3–4 constant revisit time repeats over time.
Figs. 19 and 20 show the revisit-time distribution and single-point history for the SAR payload at 45° inclination. In contrast to the EO/IR payload, the SAR payload exhibits a markedly different revisit-time distribution. While the EO/IR results show revisit times clustered around a small number of discrete values, reflecting the relatively simple access geometry of a single conic sensor, the SAR revisit-time distribution is significantly more dispersed. Rather than forming a few dominant peaks, SAR revisit times spread across multiple intervals. This behavior is attributed to the SAR access modeling approach, in which contact opportunities are generated by the composite interaction of two conic constraints rather than a single simple conic. The resulting access geometry introduces greater variability in feasible observation opportunities, leading to a broader and less discretized revisit-time distribution.
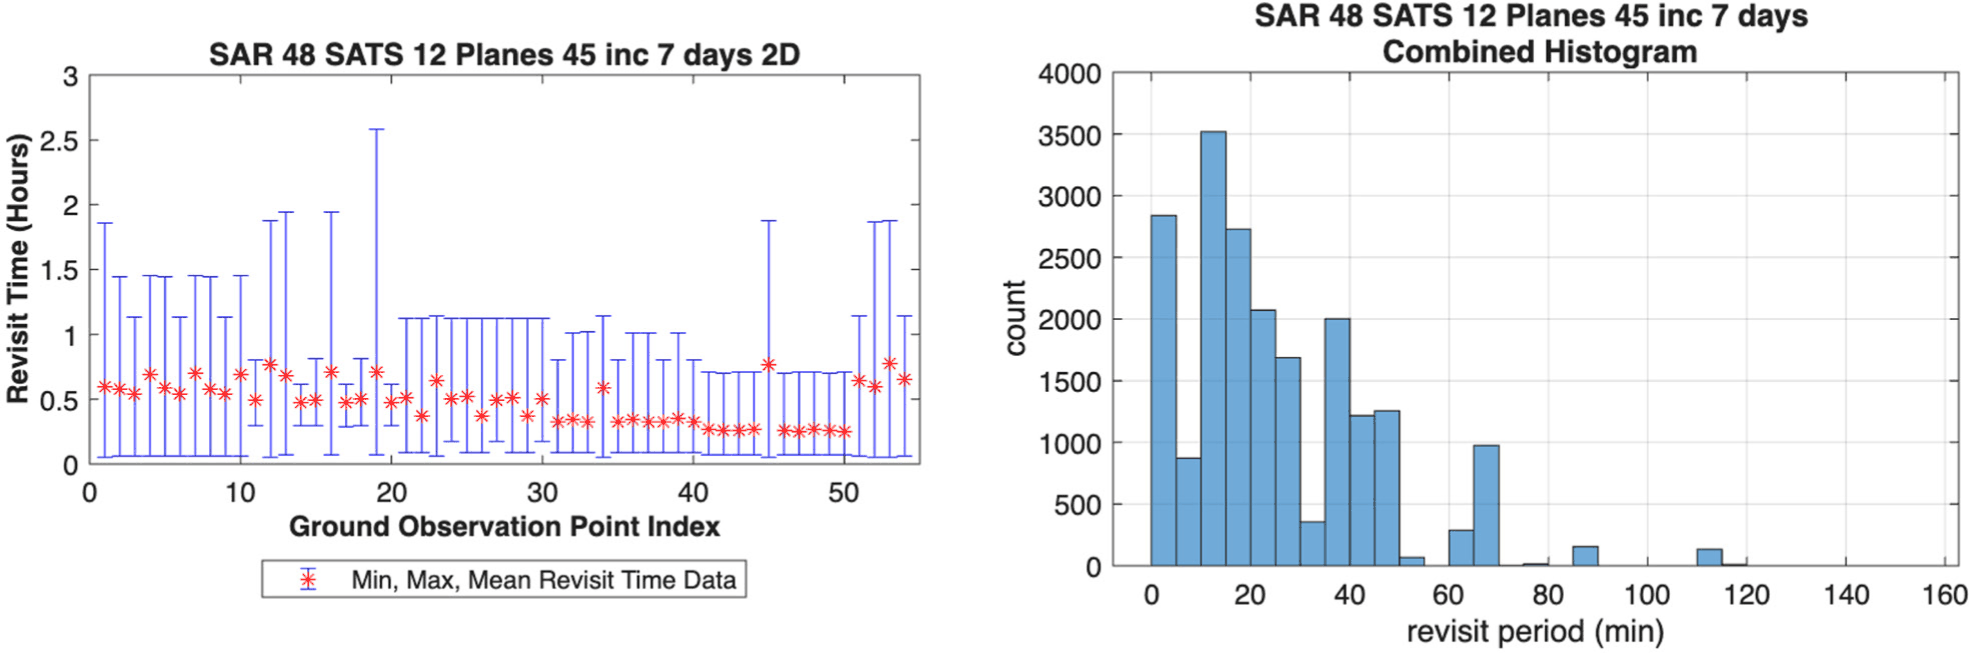
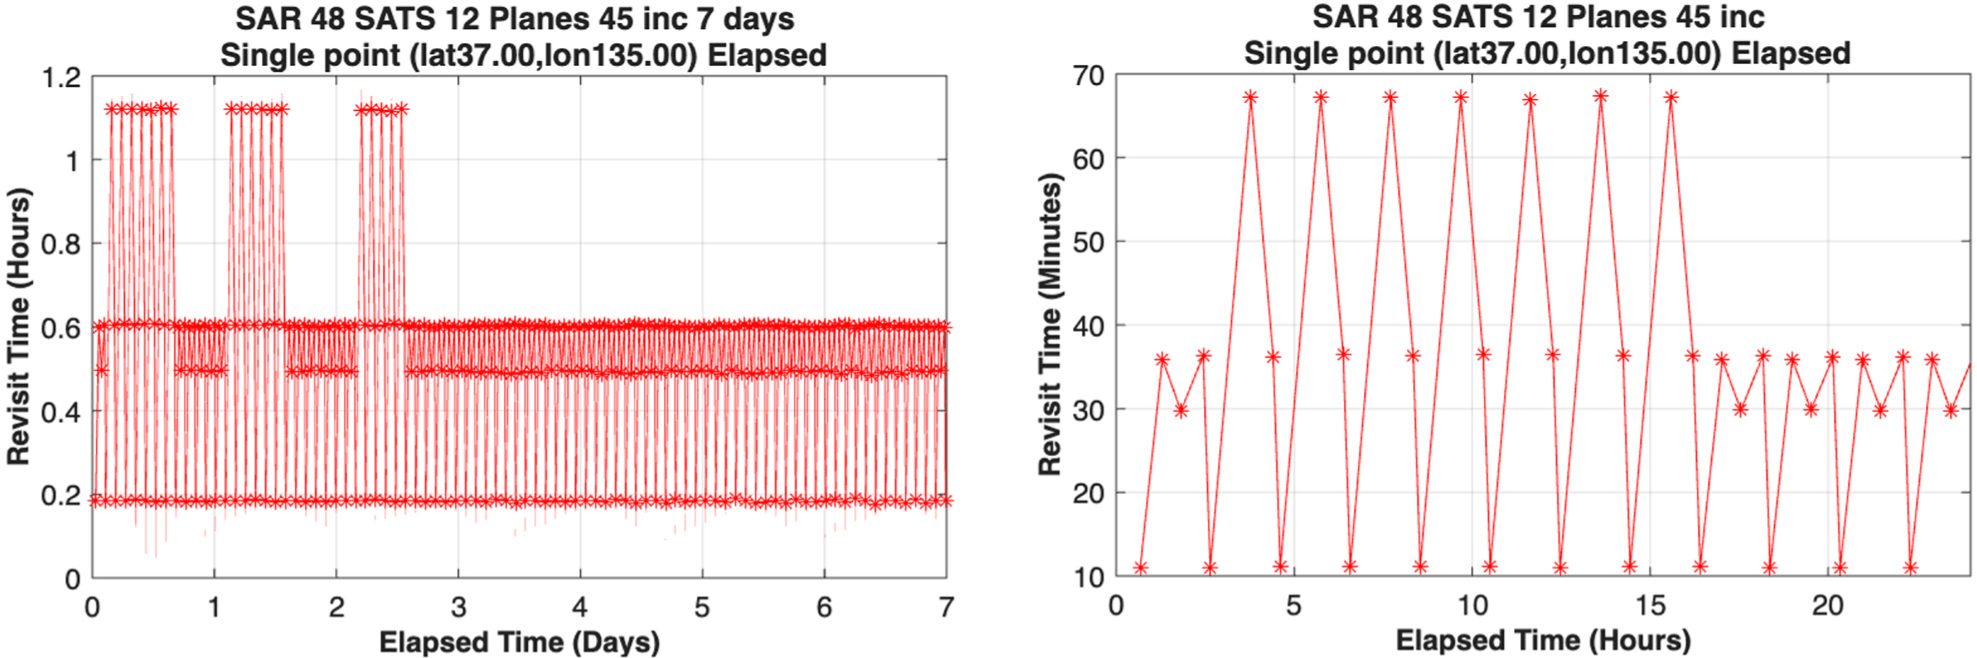
Another notable distinction from the EO/IR case is observed in the maximum revisit times across ground observation points. For EO/IR, the 48-satellite, 12-plane configuration maintains revisit times below approximately 1.5 hours across all ground locations, indicating uniform temporal coverage. In contrast, the SAR results reveal that some ground points experience maximum revisit times exceeding 3 hours. This demonstrates that the same constellation configuration, while sufficient for EO/IR coverage, is unable to guarantee a comparable upper bound on revisit time for SAR payloads. This outcome highlights an inherent limitation of the current constellation architecture when applied to SAR missions, suggesting that additional satellites, different plane spacing, or alternative orbital parameters may be required to constrain SAR maximum revisit times to the same level as EO/IR.
Despite this increased variability in the revisit-time distribution, the SAR revisit-time history for a fixed ground point still exhibits a clear and structured temporal pattern. Similar to the EO/IR payload, several distinct revisit intervals repeat quasi-periodically over time. These repeating patterns arise from the regular passage of trajectory bands with favorable SAR viewing geometry, interspersed with longer gaps between successive band crossings. The presence of these recurring structures indicates that, although SAR revisit times are more widely distributed, their temporal evolution remains highly predictable.
Consequently, while SAR payloads differ from EO/IR in terms of revisit-time dispersion and worst-case performance, the underlying periodic structure of revisit-time histories remains comparable. This suggests that pattern-based modeling or prediction of ground-station revisit-time schedules which is previously demonstrated to be effective for EO/IR payloads can also be meaningfully applied to SAR payloads, albeit with a larger set of characteristic revisit intervals and increased variability.
Figs. 21 and 22 present revisit-time results for the RF payload operating in a formation-flight configuration. Compared to the EO/IR and SAR payloads, the RF payload exhibits a revisit-time distribution with noticeably tighter clustering of mean values across ground observation points. While EO/IR revisit times concentrate around a small number of discrete intervals and SAR revisit times spread over a wider range due to more restrictive imaging geometry, the RF payload shows a comparatively compact distribution with a dominant concentration at shorter revisit periods. This behavior reflects the formation-flight operation of the RF payload, where simultaneous or near-simultaneous reception by multiple satellites expands effective access opportunities relative to single-platform sensing.
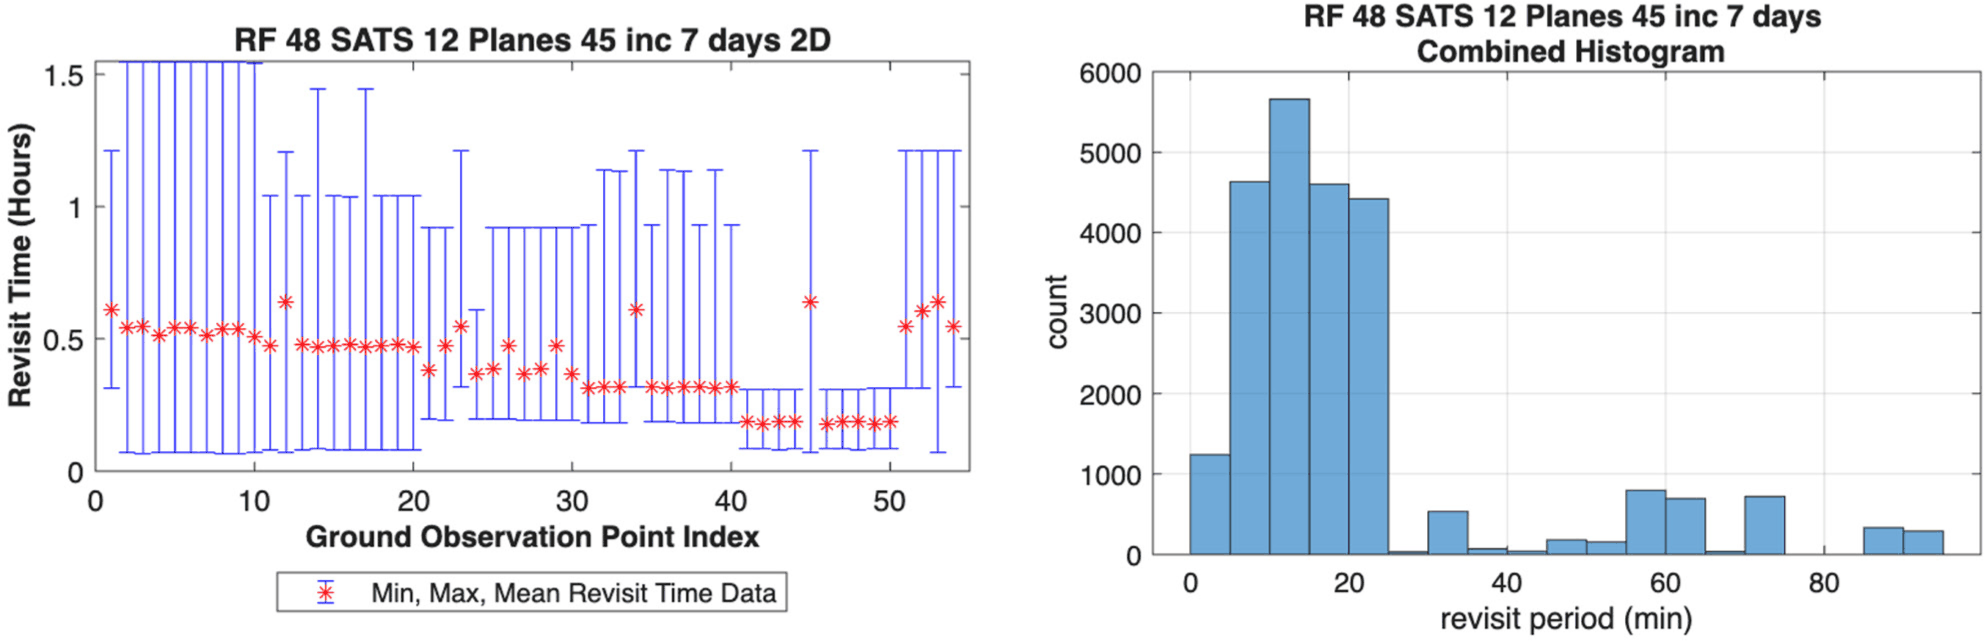
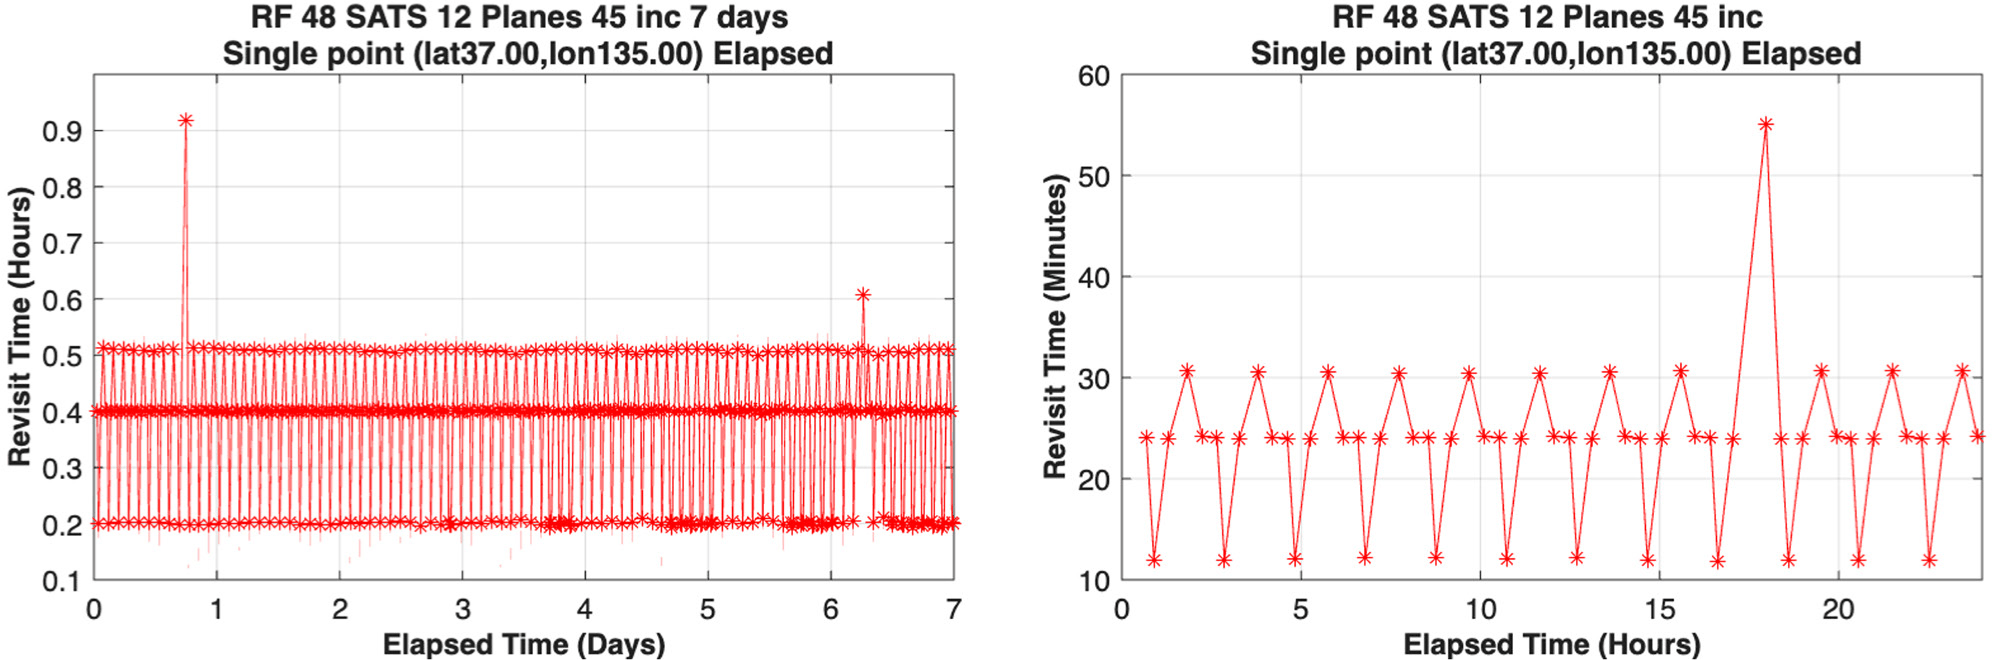
Unlike the SAR case, the RF revisit-time distribution does not exhibit a pronounced long tail across most ground points, and maximum revisit times remain relatively bounded for the majority of locations. Although occasional longer revisit intervals appear in the combined histogram, these events are sparse and do not dominate the overall distribution. This indicates that, for the given 48-satellite, 12-plane configuration, the RF payload can achieve more consistent temporal coverage than SAR, despite operating under a requirement for multi-satellite geometric alignment.
The single-point revisit-time history further reinforces this observation. Similar to EO/IR and SAR payloads, the RF payload demonstrates a clear repeating temporal structure at a fixed ground location. Distinct revisit intervals recur quasi-periodically, corresponding to repeated alignments of the formation geometry with the ground point. Short revisit times occur when the relative configuration of the chief and deputy satellites satisfies the simultaneous reception requirement, while longer gaps emerge between successive favorable alignments.
Overall, although the RF payload operates under more complex formation-flight constraints than EO/IR, its revisit-time characteristics remain highly structured and predictable. The repetition of a limited set of revisit intervals suggests that, as with EO/IR and SAR payloads, ground-station revisit performance for RF missions can be effectively characterized and anticipated using pattern-based scheduling models. This highlights that periodic geometric recurrence—rather than isolated access events—dominates revisit behavior across all payload types considered, with the RF payload offering a favorable balance between geometric complexity and temporal consistency.
5. CONCLUSIONS
This study presented an integrated simulation framework for analyzing the revisit-time characteristics of LEO satellite constellations equipped with heterogeneous payloads, implemented entirely within a single MATLAB environment. A key finding of this study is that revisit-time histories for EO/IR, SAR, and RF payloads exhibit quasi-periodic patterns at individual ground observation points. These repeating revisit intervals arise from the periodic passage of trajectory bands and the regular recurrence of favorable geometric alignments driven by Earth rotation. While payload-specific characteristics influence the spread and minimum achievable revisit time, the dominant temporal structure of revisit behavior is dictated by the constellation’s ground track geometry.
Also, departing from conventional workflows that rely on external commercial simulators for orbit propagation and access analysis, the proposed framework demonstrates that constellation configuration, payload modeling, access evaluation, and revisit-time analysis can be consistently performed using the MATLAB Satellite Communications Toolbox.
Furthermore, this research demonstrates that meaningful insight into constellation performance cannot be obtained solely from aggregated metrics such as average or maximum revisit time. Instead, combining ground trajectory visualization with temporal revisit-time histories provides a more intuitive and physically grounded understanding of coverage gaps, periodicity, and regional performance variations. The proposed simulation framework and geometric analysis methodology offer a flexible and extensible foundation for future studies on constellation design, payload integration, and operation-oriented performance evaluation.
Future work will extend the framework to incorporate mission scheduling constraints, onboard resource limitations, and cooperative multi-payload tasking, enabling more realistic assessment of operational performance for next-generation Earth observation and maritime surveillance satellite constellations.

