


1. INTRODUCTION
Space telescopes operating at optical/visible wavelengths require mirror surface with nanometer-scale figure accuracy, because surface errors introduce phase errors and degrade the wavefront. A common rule of thumb is that an optical surface functions as a high-quality element when its figure error is controlled to approximately one-thirtieth of the target wavelength (≈ λ/30). For visible-band observations, this corresponds to a wavefront error on the order of 20 nm, motivating nanometric control of the mirror surface. Because post-launch maintenance or corrective processing is practically impossible, the required accuracy must be achieved during fabrication. Deterministic polishing removes material through interactions between abrasive particles and the substrate; therefore, quantitative control of the material removal depth is essential. This spatial removal profile is described by the tool influence function (TIF), which is often modeled using Preston's equation, relating removal to pressure, relative velocity, and dwell time (Preston 1927). However, at nanometric removal depths the TIF becomes highly sensitive to process variations, making accurate prediction difficult using an analytic equation alone. In practice, non-uniform pressure distributions (Li et al. 2025), nonlinear process behavior (Zhao & Lu 2013), tool edge effects (Kim et al. 2009), and material-property variations limit the achievable accuracy of equation-based models. Motivated by these limitations, we adopt a data-driven approach based on deep learning.
With advances in computational power and machine learning methods, artificial intelligence (AI)-based prediction has been actively explored across scientific and engineering domains. In polishing and chemical mechanical planarization, several studies have used machine learning to predict material removal, for example deep neural networks based on pad topography (Jeong et al. 2023), tree-based ensemble learning (Li et al. 2019), physics-informed machine learning (Yu et al. 2019), and genetic algorithm–assisted neural networks (Wang et al. 2023). While these approaches improve prediction accuracy by incorporating additional process information beyond Preston's equation, the role of data augmentation has been less studied. Under nanometric precision requirements, acquiring a sufficiently large experimental dataset for regression is inherently challenging because experiments are costly and time consuming. Accordingly, this study addresses data scarcity by applying a data augmentation strategy tailored to the observed experimental variability.
This paper is organized as follows. Section 2 describes the polishing experiments based on Preston's equation. Section 3 presents the data augmentation method and the deep learning model architecture. Section 4 reports the results, and Section 5 concludes the paper.
2. PRESTON’S EQUATION BASED EXPERIMENT
To obtain TIF data for developing the prediction model, we conducted polishing experiments guided by Preston's equation, which can be written as:
where κ (kappa) denotes the Preston coefficient, P represents the applied pressure, V is the wheel rotation velocity, and T corresponds to the dwell time. In the experiments, P, V, and T were treated as adjustable parameters. To obtain TIF data under controlled conditions, an orthogonal velocity tool (OVT) polishing head was employed (Fig. 1; Seo et al. 2016).
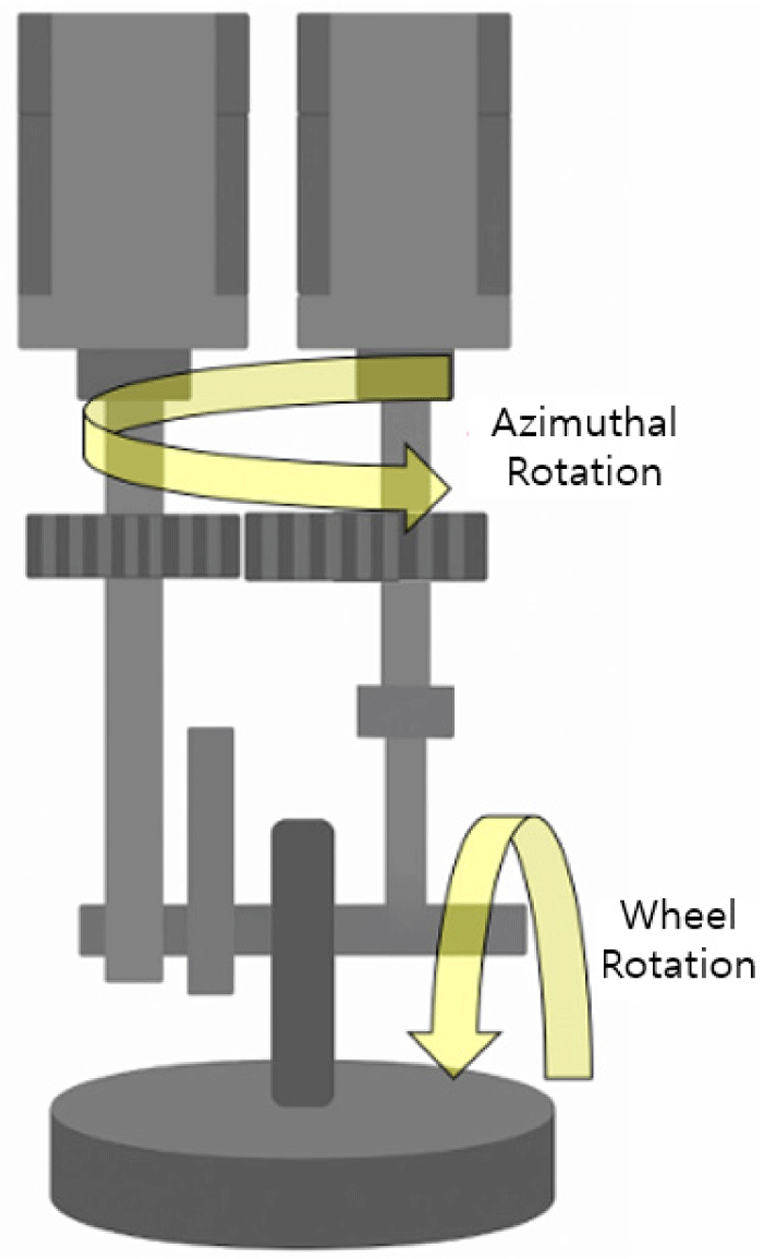
The key characteristic of the OVT is its two independent rotational axes (radial and azimuthal). Simultaneous rotation about these axes generates a pseudo-Gaussian-shaped TIF on the mirror surface. The rotational speeds of both axes and the x-, y-, and z-axis positions are adjustable within the ranges listed in Table 1. Within these ranges, polishing experiments were conducted on Silicon Carbide (SiC) mirror surfaces.
| Parameters | Values |
|---|---|
| X-axis position (mm) | up to 150 |
| Y-axis position (mm) | up to 100 |
| Z-axis position (mm) | up to 90 |
| Radial rotation speed (m/s) | up to 15.2 |
| Azimuthal rotation speed (m/s) | up to 9.42 |
SiC was selected as the workpiece material because its high hardness and thermal stability are desirable for space optics. The experimental procedure was as follows: the SiC sample was mounted on the polishing table, slurry was applied, and polishing was performed after setting all process parameters. The experimental parameter levels are summarized in Table 2 and were used as inputs to the deep learning model. Although slurry particle size is not an explicit variable in Preston's equation, its effect can be implicitly reflected in the Preston coefficient κ. Larger particles generally increase κ due to enhanced mechanical interaction between abrasive particles and the mirror surface, leading to increased TIF depth. Two particle sizes (3 and 6 μm) were used.
| Parameters | Values |
|---|---|
| Pressure, P (MPa) | 0.12, 0.14, 0.16 |
| Wheel rotation velocity, V (m/s) | 0.081, 0.086, 0.116, 0.121, 0.146, 0.242 |
| Dwell time, ΔT (s) | 5, 10, 15 |
| Slurry particle size (μm) | 3, 6 |
After experiments, the polished TIF data were measured using an aspheric stitching interferometer (ASI) from QED Technologies (Han et al. 2013; QED Technologies 2025).
3. DEEP-LEARNING MODEL FOR TIF PREDICTION
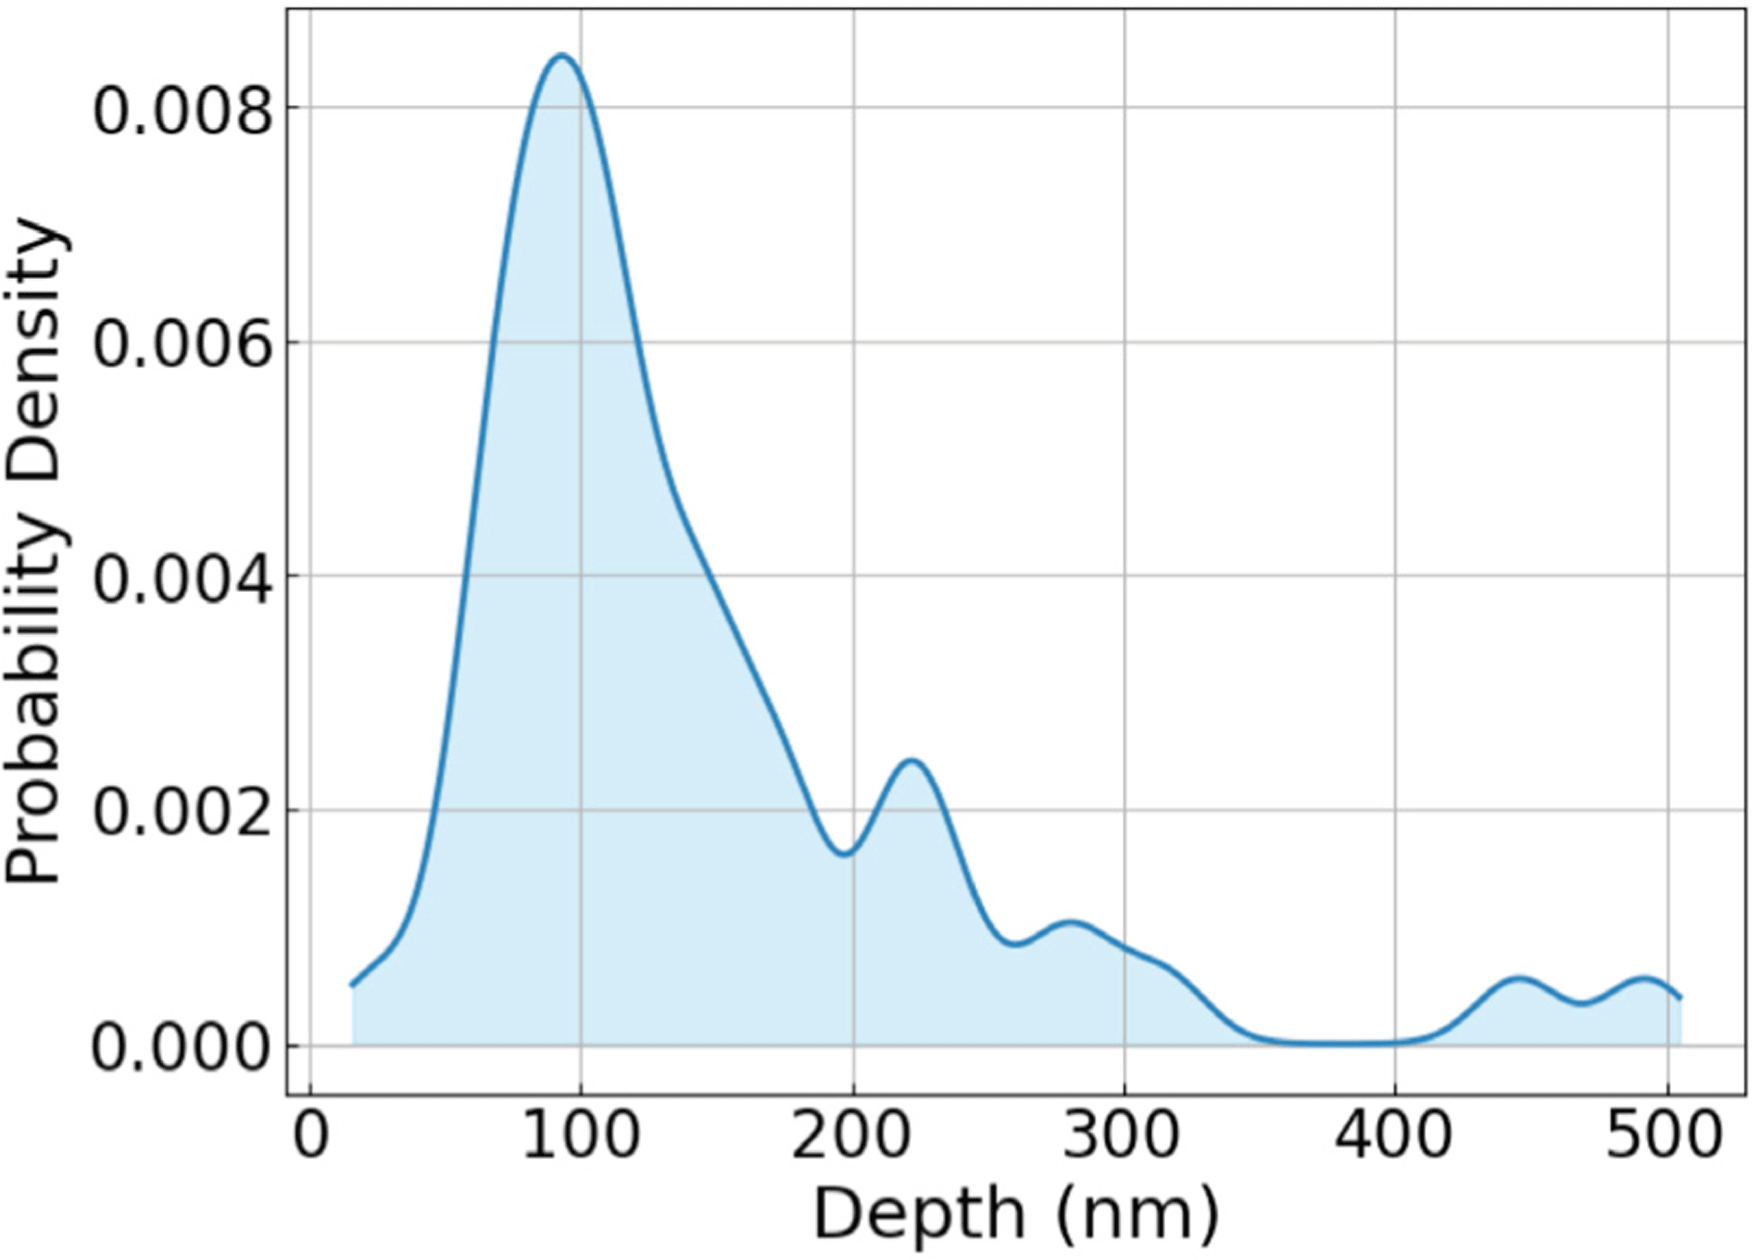
Polishing experiments were conducted using selected discrete combinations of the input parameters listed in Table 2. A total of 231 TIF depth measurements were collected across 47 representative parameter combinations, with multiple repetitions per combination. However, this dataset size is still limited for training a regression model with good generalization. To address data scarcity, we applied data augmentation to synthetically expand the dataset. Specifically, for each parameter combination we generated additional samples by adding Gaussian random noise to the measured (mean) TIF depth. The noise distribution was defined with its mean set to the measured TIF value, and its standard deviation adjusted such that the peak-to-peak range of generated values was approximately 20 nm (Fig. 2). In this study, we generated 200 augmented samples per representative parameter combination (47 combinations), yielding 9,400 samples in total.

The noise range used for data augmentation was determined based on the experimentally observed repeatability of the measured TIF depth. Repeated polishing experiments conducted under identical process conditions showed a peak-to-peak variation of approximately 20 nm, corresponding to about ± 10 nm uncertainty (Fig. 3). To reflect this inherent experimental variability, Gaussian noise within this range was added during augmentation. Such noise injection can also act as a regularization technique in neural network training and improve generalization performance, as theoretically demonstrated by Bishop (1995).
Following this approach, data augmentation was conducted for each combination of parameters, resulting in a total of 9,400 TIF data samples and the generated data were divided into training, validation, and test dataset in a ratio of 3:1:1 (Table 3).
| Dataset | Number of data |
|---|---|
| Training dataset | 5,640 |
| Test dataset | 1,880 |
| Validation dataset | 1,880 |
This ratio was set to ensure that the model is trained with a sufficient amount of data for generalization, while also maintaining balanced datasets for reliable validation during training and objective performance evaluation after training.
Artificial neural networks (ANNs) are computational models that learn input–output mappings by stacking layers of simple nonlinear units (neurons). Each neuron computes a weighted sum of its inputs, adds a bias term, and applies a nonlinear activation function. By composing many such units, a multi-layer perceptron (MLP) can approximate complex nonlinear relationships and is widely used for regression tasks (Rumelhart et al. 1986). In this study, we use an MLP to predict TIF depth from four process parameters (P, V, T, and slurry particle size). For a neuron, the output is computed from the weighted inputs and passed through an activation function, as expressed in Eq. (2).
The neuron outputs are propagated through successive hidden layers until the output layer. During training, the model optimizes the weights by minimizing the MAE loss using backpropagation. The network consisted of an input layer, six hidden layers with 32, 64, 128, 256, 128, and 64 neurons, and a single-neuron output layer. The rectified linear unit (ReLU) activation function (Agarap 2019) and the Adam optimizer (Kingma & Ba 2019) were used. The model was implemented in TensorFlow (Abadi et al. 2016; TensorFlow 2025). Hyperparameters were selected empirically through multiple training/validation trials; the final settings were 175 epochs, a learning rate of 0.002, and a batch size of 40, which provided stable convergence without overfitting among the tested configurations.
4. RESULTS
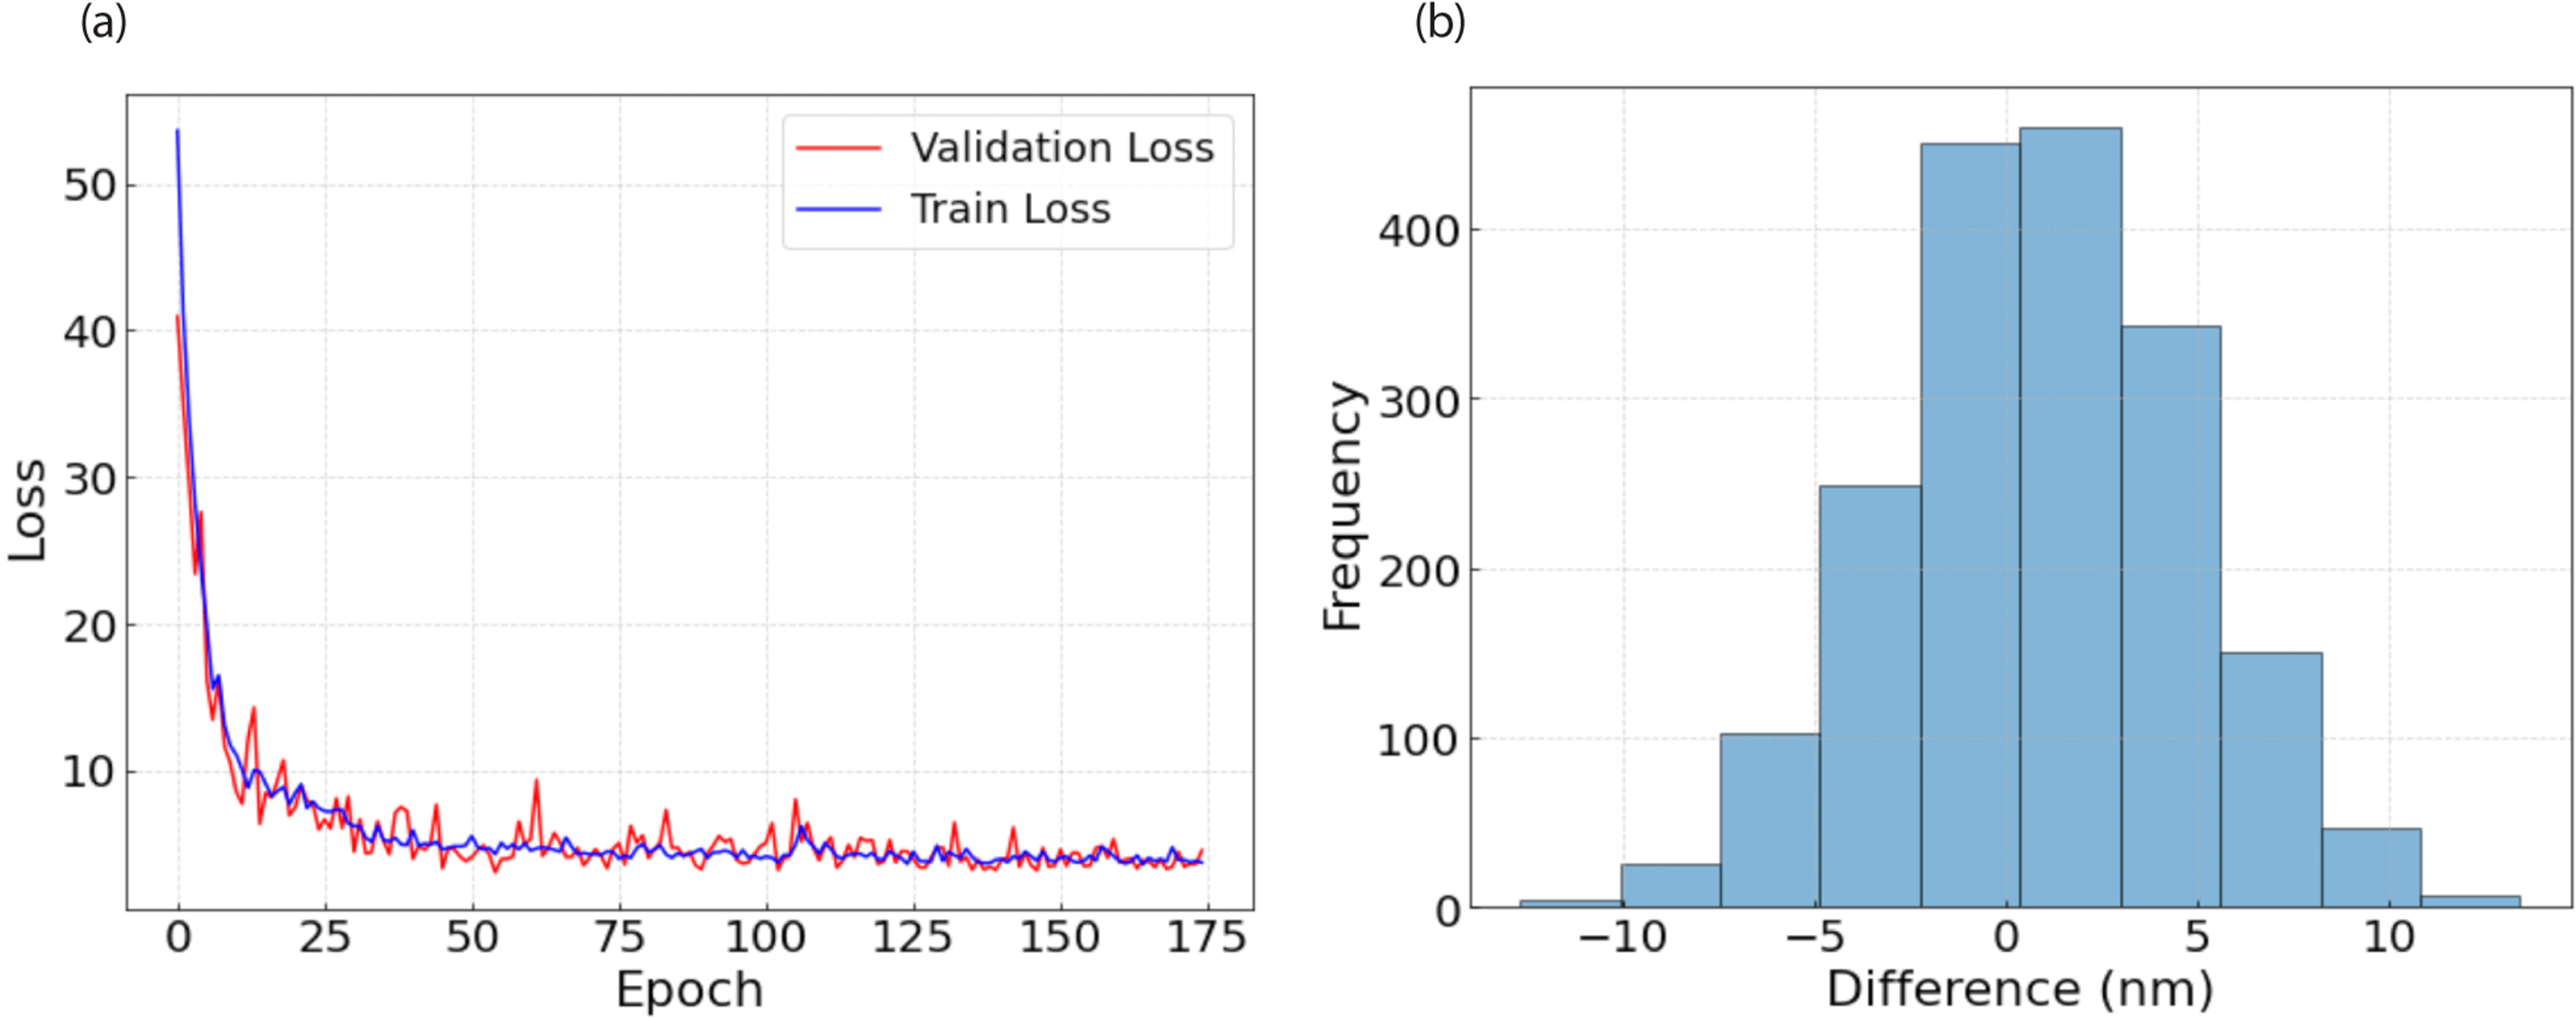
Mean absolute error (MAE) was used to evaluate model performance. As shown in Eq. (3), MAE is defined as the average absolute difference between the predicted and ground-truth values. The trained model achieved a validation MAE of 4.24 nm and a test MAE of 3.99 nm. As shown in Fig. 4, the learning curve and the histogram of test-set errors indicate stable convergence without evident overfitting.
In addition, 5-fold cross-validation was performed to examine whether the trained model yields similar prediction errors across different data folds, and the resulting average validation error of 4.01 nm was comparable to that obtained from the original training.
The trained model was further evaluated using nine additional polishing experiments that were not included in the training/validation/test splits. These cases were selected to examine prediction accuracy under pressure variations while keeping the other parameters fixed, because pressure strongly affects TIF depth.
Furthermore, to directly compare the proposed data-driven model with a conventional equation-based approach, an additional baseline analysis was conducted. Using the nine additional experimental data points, the Preston coefficient (κ) was determined by a least-squares fitting procedure. The additional experimental results and the prediction errors (predicted - experimental) for data-driven and equation-based model are summarized in Table 4, and the errors are plotted in Fig. 5.
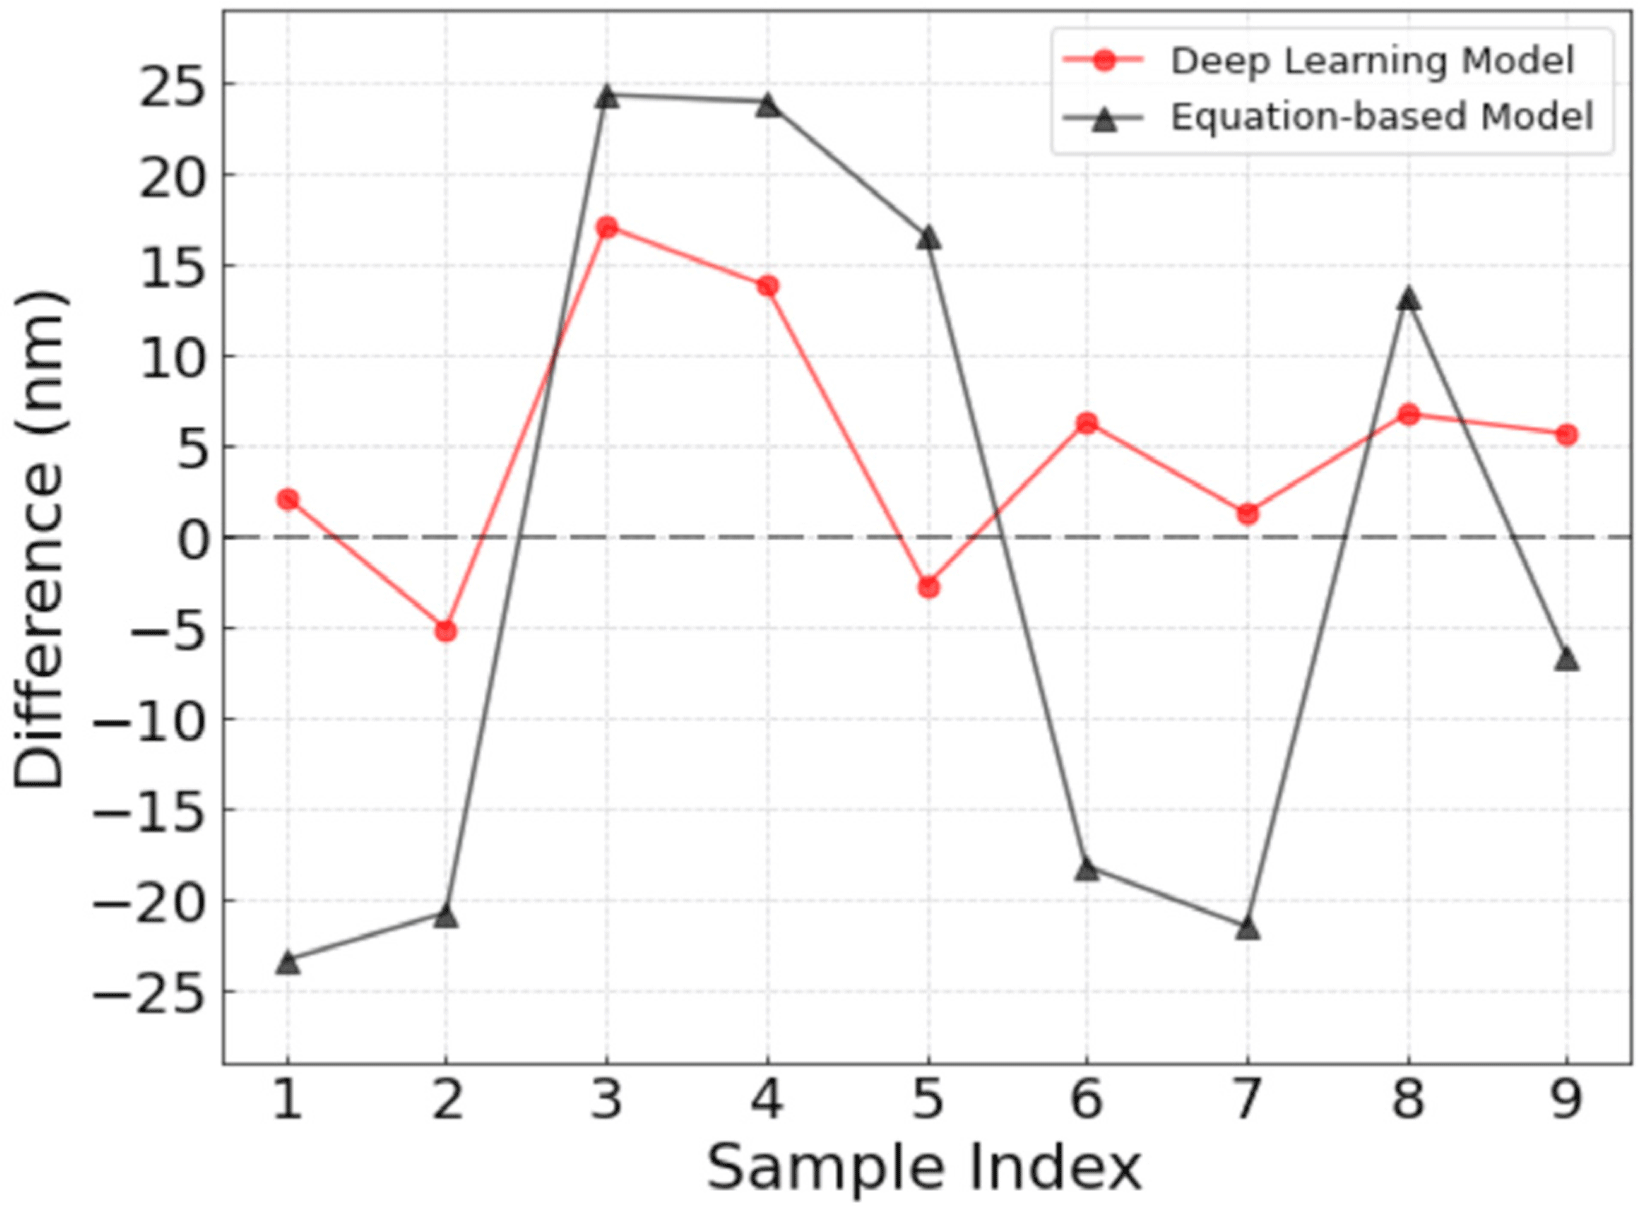
As shown in Table 4 and Fig. 5, the equation-based baseline resulted in a MAE of 18.7 nm, which is substantially larger than the MAE of 6.75 nm achieved by the proposed MLP-based model under identical experimental conditions. This comparison demonstrates that the proposed data-driven model provides improved predictive accuracy compared to equation-based approach. In addition, the differences between the experimental and predicted values obtained using the deep learning model remained within 20 nm for all evaluated cases. This error range is comparable to the fabrication tolerance required for optical surface fabrication at the nanometric level. Such consistency indicates that the deep learning model maintains physical reliability comparable to the precision achievable in practical polishing processes.
In Fig. 5, the errors are skewed toward positive values, which may reflect limited representation of specific process regimes in the experimental dataset. For the three (V, T) settings in Table 4, the MAEs were 4.22 nm for V = 0.086 m/s (T = 5 s), 11.20 nm for V = 0.116 m/s (T = 10 s), and 4.84 nm for V = 0.146 m/s (T = 15 s), indicating relatively larger errors around V = 0.116 m/s and T = 10 s. This suggests that prediction accuracy depends on operating conditions and that nonlinear relationships between process parameters and TIF depth may not be fully captured in some regimes. With additional experimental data covering a wider range of process conditions, this bias may be mitigated. Future work will explore alternative model architectures, augmentation strategies, and further hyperparameter tuning to reduce prediction errors.
5. CONCLUSIONS
In this study, we developed a deep learning model to predict the TIF depth for polishing SiC mirror surfaces. To alleviate data scarcity, we applied a data augmentation method that injects Gaussian noise consistent with experimentally observed repeatability. The trained model achieved MAEs of 4.24 nm (validation) and 3.99 nm (test), and predicted nine additional experimental cases with an MAE of 6.75 nm and errors within ± 20 nm. These results suggest that the proposed approach improves robustness to experimental variability and can serve as a practical indicator for nanometric-level process control. To further improve performance, future work will incorporate additional input features (e.g., pad topography) and investigate augmentation methods better matched to TIF characteristics.