1. INTRODUCTION
The rotation of the Earth has been quite an intimate phenomenon to humankind. Star positions on the celestial sphere were used in navigation for centuries. Aside from the slow precession in space, the Earth’s spin axis apparently drifts on its surface as well, and this movement is called polar motion. Accurate terrestrial reference frame requires the exact position of the Earth’s pole. The ‘Reference Pole’ was determined as the mean pole position at the year 1900. The pole position on the Earth’s surface is continuously changing and the two main oscillatory components of polar motion are Chandler wobble and annual wobble. Due to scientific interests and technological needs, polar motion has been investigated for decades. Among excellent related literatures, we hereby cite two: a classical monograph by Munk and MacDonald (Munk & MacDonald 1960) and one book chapter by Gross (Gross 2009).
Ever since the beginning stages of Earth rotation study, the annual wobble has been believed to be driven by seasonal perturbation in the Earth’s fluid spheres (Munk & MacDonald 1960), and this has been repeatedly confirmed with growing observational data (for example, Gross et al. 2003; Na et al. 2018). Chandler wobble is the free Eulerian nutation mode of the Earth, and the cause for its existence have been controversial for a long time. Numerous studies were undertaken to understand the characteristics and cause of Chandler wobble. One monograph was composed of extensive discussions from different perspectives (Plag et al. 2005). With growing evidences, the role of the outer fluid spheres to maintain Chandler wobble had been suspected for a long time, however, its concrete proof in the time domain has not been done until two recent articles (Xu et al. 2024; Yamaguchi & Furuya 2024), but in most studies, only the investigations on their spectra have been done.
Seismic excitation of Chandler wobble has been investigated repeatedly (for example, Smylie & Mansinha 1968; Chao & Gross 1987). Although its amount could be calculated early in the 90s, it was difficult to isolate its effect from polar motion. The path of polar motion does not show abrupt discontinuity even at the occurrences of largest earthquakes, but the resultant changes in the Earth’s inertia tensor and corresponding excitation of Chandler wobble do follow. In this study we attempt to approximately calculate the amount of Chandler wobble due to largest earthquakes since 1980.
As a candidate energy source of Chandler wobble, geomagnetic jerk has been formerly referred (for example, Gibert & Le Mouël 2008). Most of those studies tried to verify the relation between the phase change of Chandler wobble and the geomagnetic jerks observed from geomagnetic field. In this study we attempt to identify whether such causal relation exists. Also, we take advantage of recent numerical modelling of geomagnetic jerks (Aubert & Finlay 2019) for checking the order of magnitude of such effect.
The main objective of this report is to confirm the cause of the Earth’s oscillatory polar motion - particularly Chandler wobble once again. Aiming that objective, the reconstruction of polar motion from information of fluid sphere excitation and earthquake excitation is attempted via a new procedure using Fourier transform of those excitations. Accurate estimation of the period T and quality factor Q of Chandler wobble is also sought once again: first direct inspection of the spectrum and secondly careful checking for optimal combination of the two parameters in the frequency domain by comparing two kinds of excitation spectrum (geodetic and fluid spheres). We performed calculations in both the frequency and time domains by using the traditional approach and new ones including our simple and convenient formulation. Secular movement of the pole associated with slow changes in the Earth’s principal moment of inertia due to the glacial isostatic adjustment (post glacial rebound) or other causes is beyond our scope in this study.
2. DATA, METHODS AND RESULTS
Two coordinates (xp, yp) specify the pole position with respect to the Reference Pole.
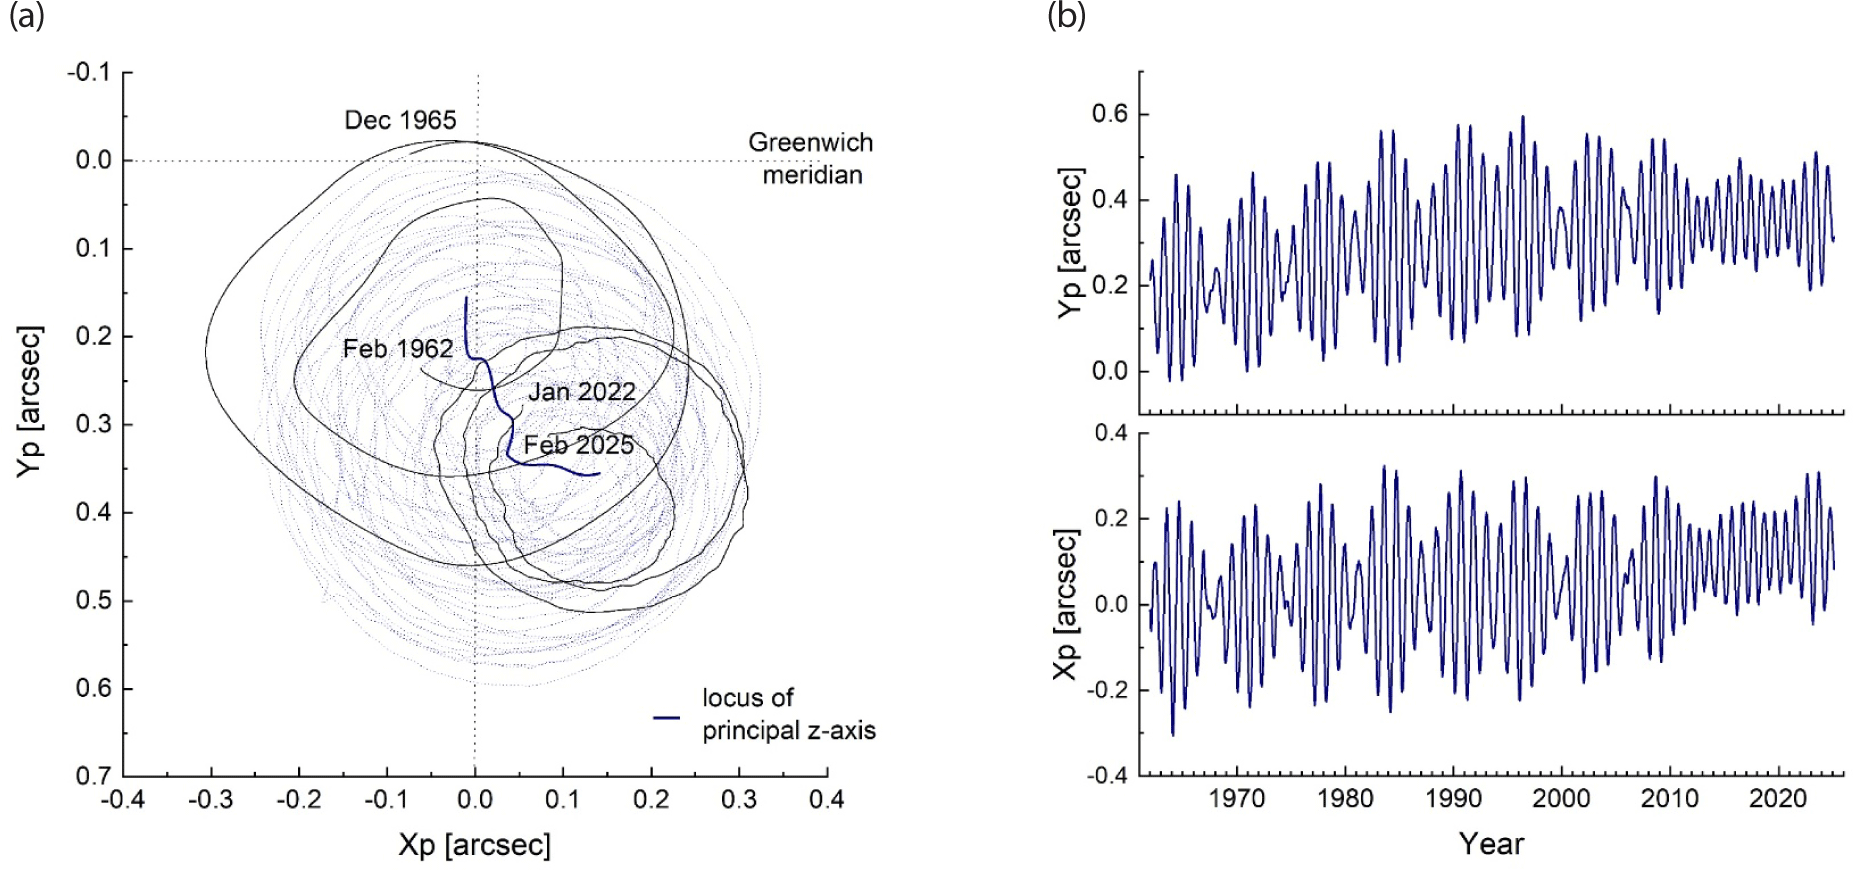
We acquired the polar motion time series data EOP C04 from the International Earth Rotation and Reference Systems Service (IERS) (Bizouard & Gambis 2009). The motion of the pole on the Earth is counterclockwise, and its center has been slowly migrating to the southeast or east. An angle of 0.1 arcsec in Fig. 1 corresponds to 3.1 meters on the Earth’s surface. The two main oscillatory components of polar motion are Chandler wobble and annual wobble, and coexistence of these two resulted in beating of polar motion time series of period about 6.4 yr. Although out of our scope, the secular drift of the Earth’s pole has been another academic issue in geophysics and geodesy, and there also exist at least several minor periodicities in the polar motion.
The Fourier spectrum of the polar motion time series shown in Fig. 1, is illustrated in Fig. 2. On the Fig. 2(a), the amplitude spectrum |P(ω)| is drawn in logarithmic scale with distinction of the sense of rotation: prograde and retrograde. On the Fig. 2(b), the power spectrum |P(ω)|2 of the polar motion time series is illustrated for a period range of 330–480 days. Although the dominance of two components – Chandler and annual – is quite certain, there exist numerous minor components as shown in Fig. 2(a). It is noted that certain procedures; elimination of linear trend, proper tapering at both ends, and zero paddings were employed on the data time series before calculation of the Fourier spectrum through FFT.
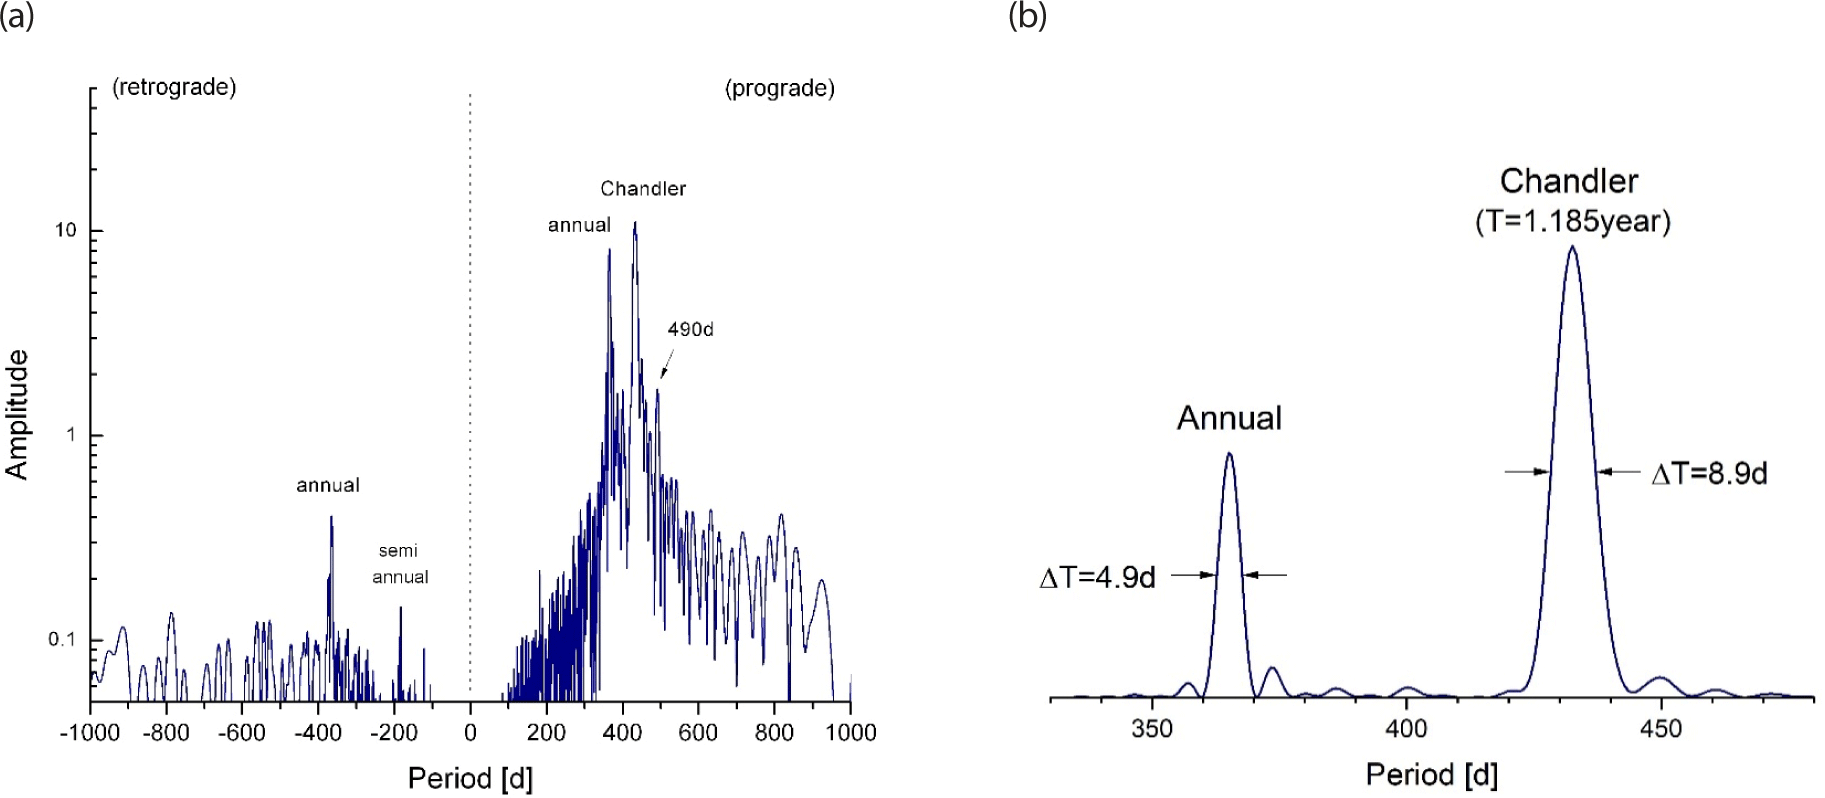
The period range of Fig. 2(b) is narrowed for close inspection. The central periods of the two peaks are T = 1.185 yr (432.7 days) and T = 1 yr (almost exactly 365.24 days) for Chandler and annual wobbles. And the corresponding two half-widths are found as ΔT = 8.86 days and ΔT = 4.85 days respectively. For harmonic oscillator response under driving force of uniform amplitude, the quality factor is given as Q = T / ΔT (Fowles 1977). Under the same assumption we inferred two quality factors of Chandler and annual wobbles as Q = 49 and 75 respectively.
Since polar motion is free from external torques, the early formulation of polar motion and its excitation had been made by Munk & MacDonald (1960) starting from the law of angular momentum conservation. The current theory after developments continued was thoroughly documented by Gross (2009). A convenient relation between the polar motion and its excitation function can be written in the frequency domain as the following formula (Na et al. 2016).
where P(ω) and X(ω) are each Fourier transforms of complex polar motion pc = xp – iyp and complex excitation function χc = χ1 + iχ2 respectively. In fact, this straightforward relation of Eq. (1) is the crucial connection between polar motion and excitation as will be shown below. The Chandler frequency is defined as Ω = ω0 (1 + 0.5i / Q) / T, where ω0 is the nominal value of the Earth’s spin rotational angular velocity, and T and Q are the period and quality factor of Chandler wobble. Two components of polar motion excitation function are defined as follows.
where C and A are the two principal moments of inertia of the Earth, and hi and ΔIi3 are the perturbing angular momentum and small changes in the Earth inertia tensor (Gross 2009). A brief derivation of Eqs. (1) and (2) is given in Appendix 1. Explicit expressions for the excitation due to the atmospheric pressure and wind are shown in Appendix 2, which can be readily applied to evaluation of the excitation due to the ocean or the continental hydrosphere.
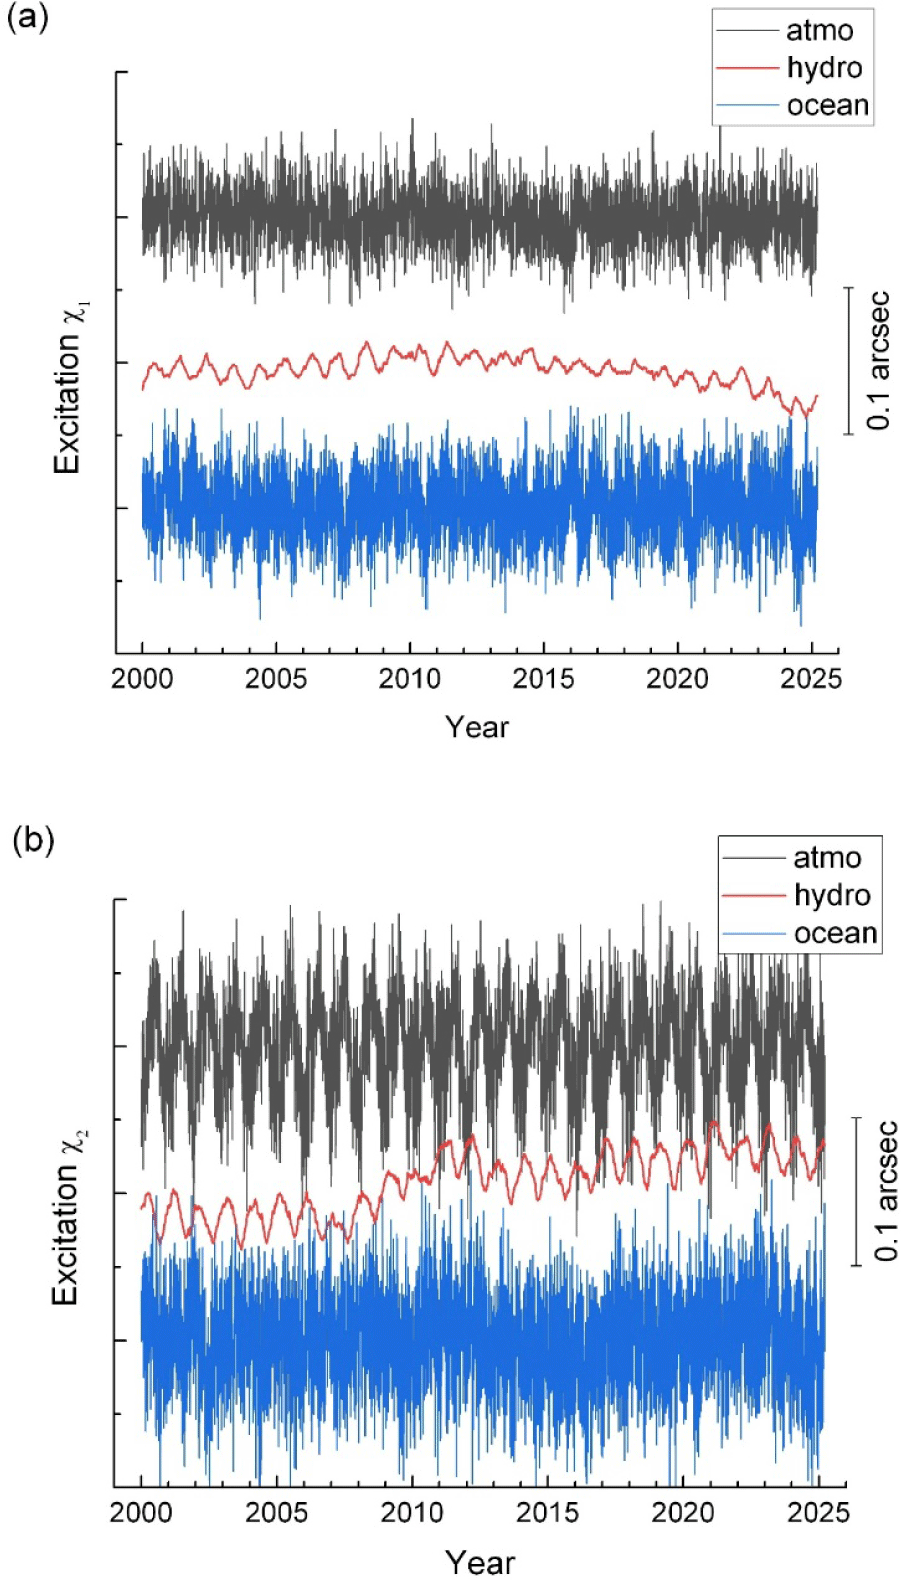
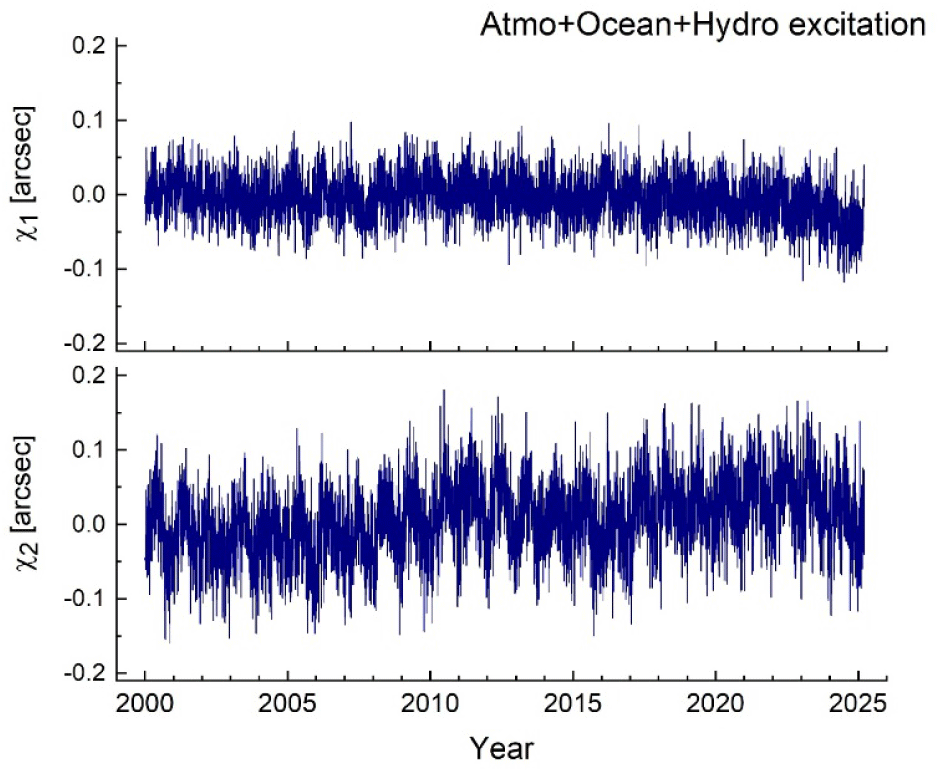
The perturbing roles of atmosphere and ocean on the Earth’s rotation were studied with early data in the 1980s and 1990s. Among those foremost groups, are cited here as; Barnes et al. (1983), Salstein & Rosen (1989), Chao (1993), and Nastula & Ponte (1999). Since 2000, IERS has been publishing the three kinds of effective angular momentum due each to the atmosphere, ocean, and continental hydrosphere (Dobslaw et al. 2010). As a matter of fact, these datasets were provided by GFZ, and ESMGFZ datasets exist quite early from year 1976 and afterwards. In Fig. 3, two components χ11 and χ2 of the combined time series of three excitations together [atmo + ocean + hydro(con)] are shown. Two sets of each separate contributions from different fluid spheres are also shown in Appendix 2.
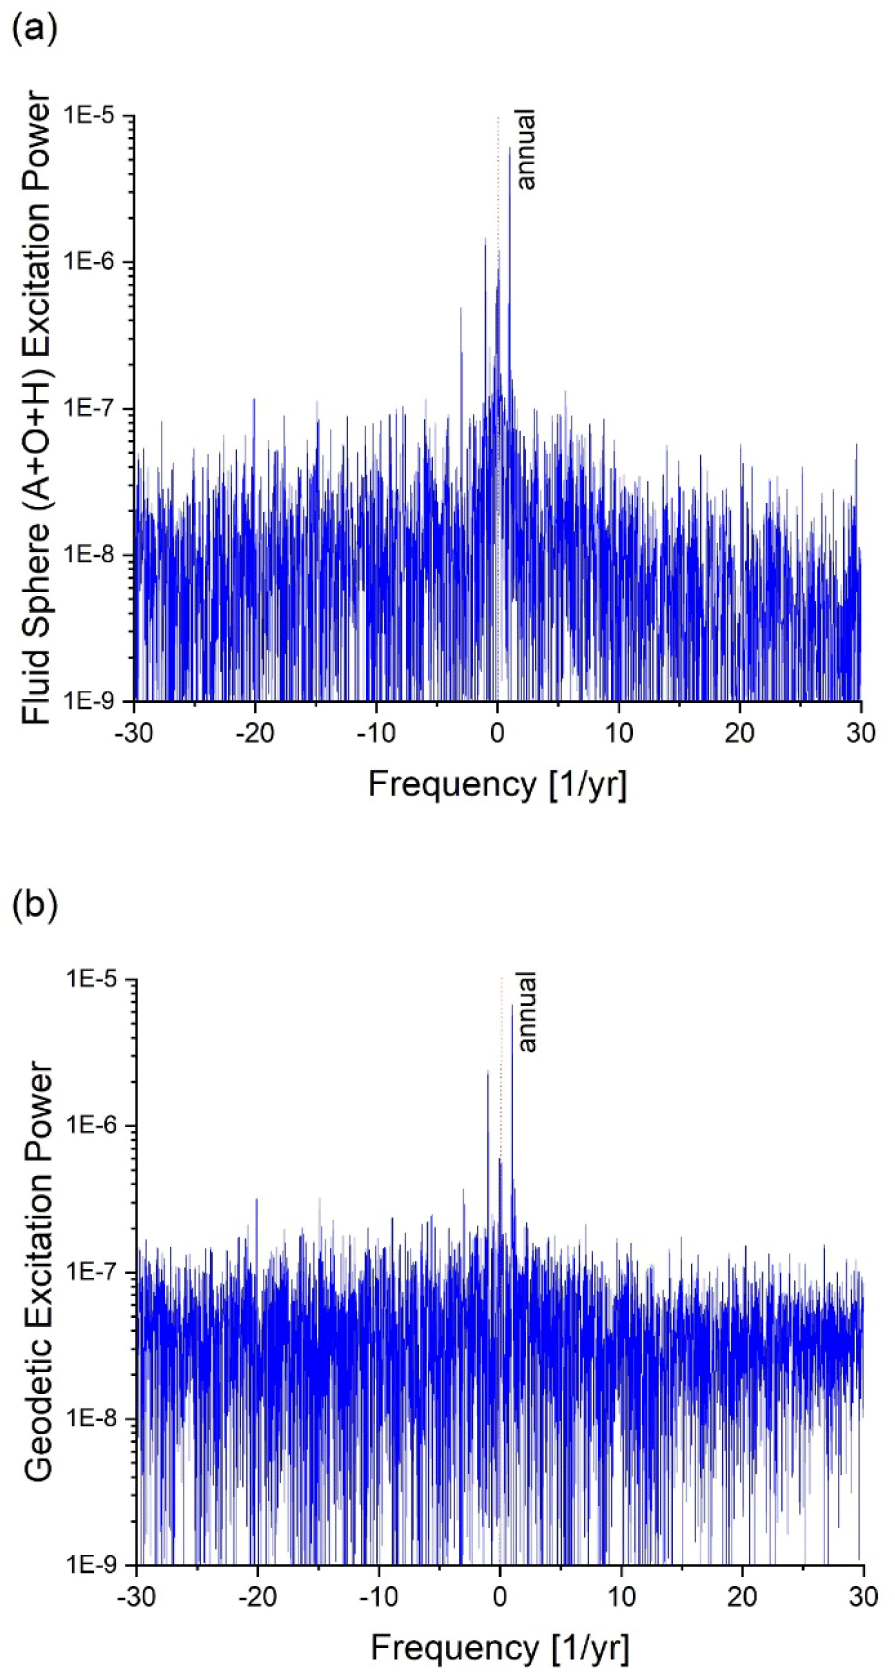
The polar motion excitation can also be deduced from polar motion data by Eq. (1) via forward/inverse Fourier transformations. And this excitation function has been called ‘geodetic excitation’ to make a distinction from the excitation function estimated from the information on the Earth’s fluid spheres. In fact, after comparison of two kinds of power spectra; fluid spheres excitation and geodetic excitation, Gross early addressed that ‘there seems to be enough power to maintain Chandler wobble in the ocean and atmosphere together’ (Plag et al. 2005). Yet such comparison has not been frequently made in the time domain except two cases (Xu et al. 2024; Yamaguchi & Furuya 2024). From comparison of the geodetic excitation (acquired for selected values of the two parameters T and Q of Chandler wobble) with fluid spheres excitation, one may determine optimal values of T and Q. Here the residual sum is defined as follows.
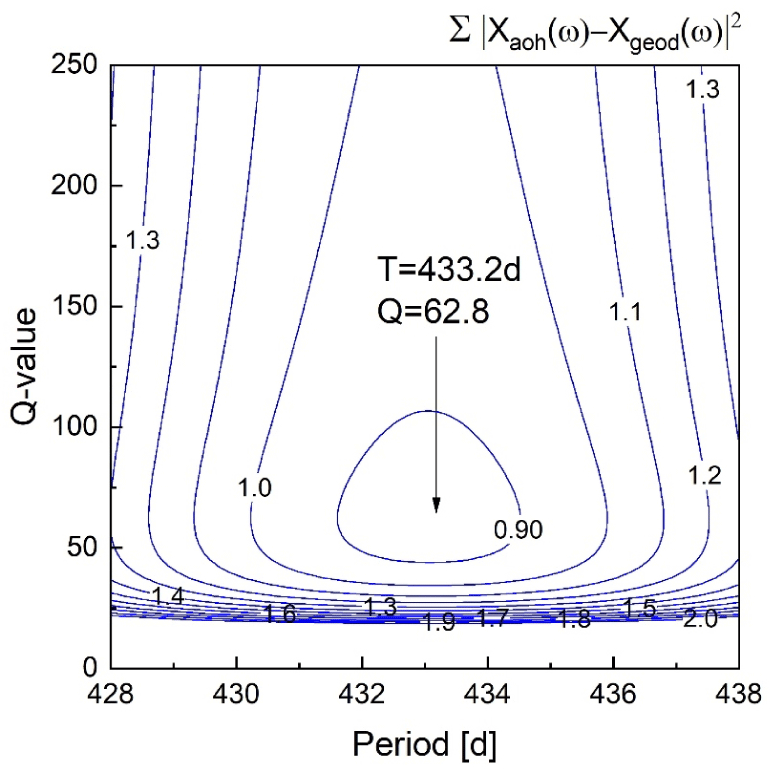
where summation is carried for the frequency range of Chandler wobble. This sum of Eq. (3) has been repeatedly calculated in the ranges of 428 < T < 438 days and 0 < Q < 250. As a result, the optimal set: T = 433.2 days and Q = 62.8 has been found in this study and are illustrated in Fig. 4. In fact, we repeated calculations with different time windows for the optimal values. Our 1σ-interval estimates of period and quality factor are T = 433.2 ± 1.4 days and Q = 63 ± 17. Former estimates made by similar approach have varied as 429 < T < 432 days and 83 < Q < 107 (Gross 2009). It is noted here that we took care in the sum (3): (i) first separate the time series of daily basis into four ones of 4 day-interval (t=4k, 4k+1, 4k+2, 4k+3), (ii) perform Fourier transform for each separate time series, and (iii) add up the four each spectrum for each T and Q. In this way, the spectral resolution was enhanced four times. The Nyquist frequency is lowered accordingly, but that does not lead to any difficulty. This method was applied to both the fluid excitation and polar motion.
For many decades earthquakes were regarded as possible energy sources of polar motion, particularly Chandler wobble. However, compared with damages at the Earth’s surface or well-detected seismic waves, the perturbation of Earth’s spin rotational state due to earthquakes is not quite noticeable. Dahlen derived the formula for the excitation in terms of seismic moment (Dahlen 1971, 1973). Lambeck compiled studies of Dahlen with other related ones, and noted the importance of aseismic excitation (Lambeck 1980). Gross and Chao calculated the seismic excitation on the polar motion (Gross 1986; Chao & Gross 1987; Gross & Chao 2006). Brzezinsky compiled and extended the formulation (Brzezinsky 2005). Smylie early addressed that large earthquakes should affect the pole position in discernable amount and later claimed that prediction of large earthquake can be made from the polar motion monitoring (Smylie & Mansinha 1968; Smylie & Zuberi 2009). However, seismic pole shifts are not large enough to be detected from polar motion observation, because the coseismic jump of the principal axis does not lead to discontinuity in the polar motion (Chung & Na 2016). Cambiotti et al. did extensive study to model polar motion due to earthquakes by using a new and elaborate scheme (Cambiotti et al. 2016). Xu and Chao renewed the estimate of seismic excitation and addressed that the cumulative seismic excitations should be accounted in the long-term polar motion (Xu & Chao 2019). By using an empirical relation, Na and Kyung approximately attained the effect of post seismic deformation unto the polar motion excitation by earthquakes (Hearn 2003; Na & Kyung 2016).
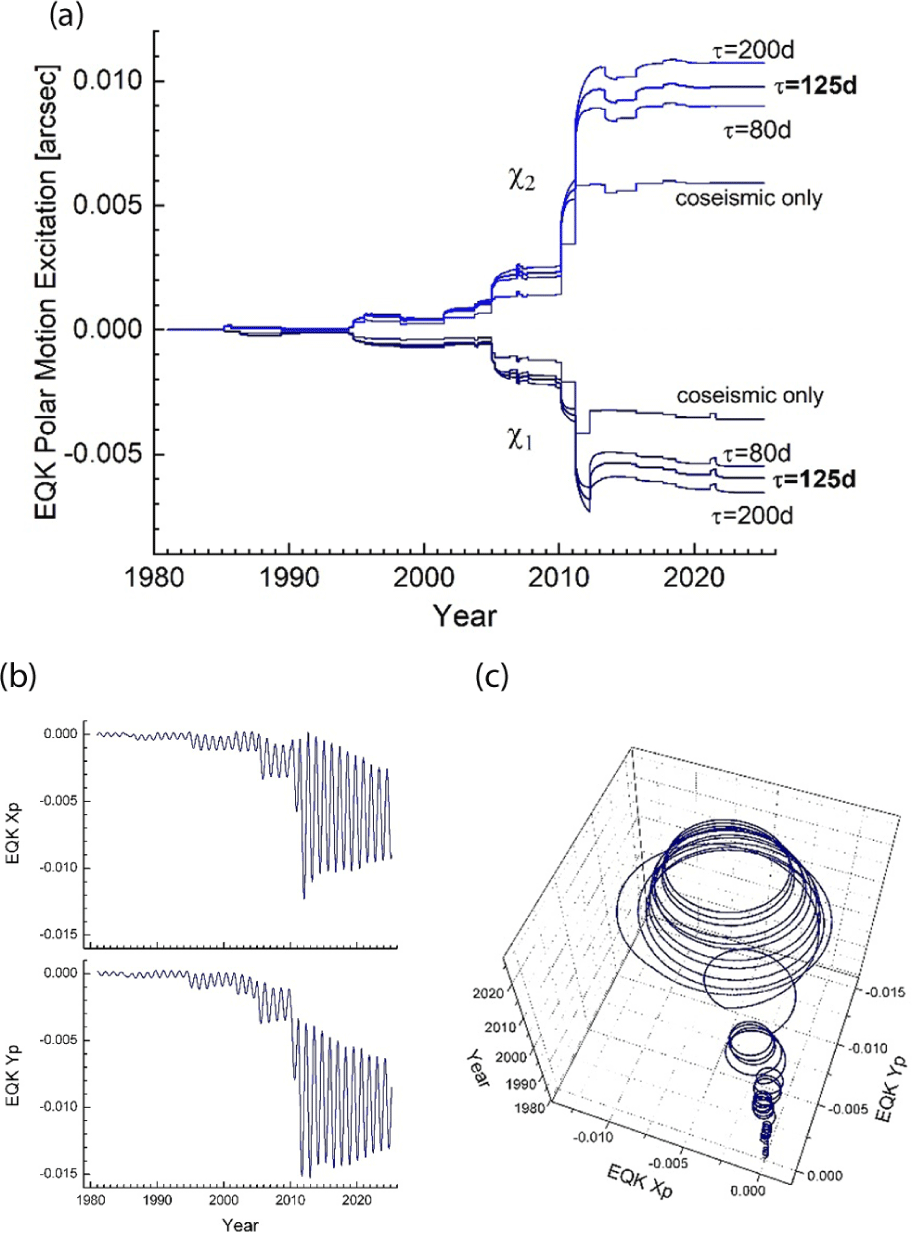
The procedure to calculate the coseismically excited polar motion for a single earthquake is followings: (i) first, evaluate seismic moment tensor Mij for the earthquake, (ii) calculate the corresponding change in the Earth’s rotational inertia tensor components ΔI13 and ΔI23, (iii) calculate the excitation components (χ1, χ2) using Eq. (2), (iv) calculate the resultant coseismic polar motion using Eq. (1) (Fig. 5).
To evaluate polar motion excitation with assuming postseismic deformation is quite difficult task. One possible way is to adopt a homogeneous relaxation model and then apply it to assess polar motion excitation associated with it. Na & Kyung (2016) attempted this approach in their calculation of polar motion excitation due to earthquake including postseismic deformation. Their simple model for postseismic deformation was taken as follows,
in which formula, the postseismic deformation is described as exponential decay with assigned characteristic time τ and the ratio between u0 and u1. The constants here were adopted as u1 = 0.655u0 for τ = 125 days. In fact, our choice of time constant here is the logarithmic mean value of two limits: τ = 80 days and τ = 200 days after Hearn (2003). The value u1 = 0.655u0 is determined by interpolation of two limiting values from fitting the observed crust relaxation after 2010 Tohoku Earthquake (Na & Kyung 2016). More theoretical details with parts of the calculated excitations are given in Appendix 3.
37 major earthquakes with magnitudes greater than 8 have occurred on the globe since 1981 until Feb 2025. Using the information of earthquakes from the USGS website, two components (χ1, χ2) of polar motion excitation function due to those earthquakes were assessed and are illustrated in Fig. 5(a). The illustrated three cases of excitations for assuming the post seismic deformation were calculated for the three characteristic relaxation time: 80, 125 and 200 days. The amounts of excitation increased by 52, 66 and 82 percents accordingly from the coseismic excitation. The greatest coseismic excitation of polar motion was (–2.064, 2.356) milliarcsec for the 2011 Tohokou Earthquake in Japan. And the corresponding coseismic pole shift was 9.7 cm at the Earth’s surface. The second largest coseismic pole shift was (–0.623, 0.561) milliarcsec for the 2004 Sumatra Earthquake. The seismically excited Chandler wobble due to those large earthquakes after 1980 is calculated and illustrated in Fig. 5(b) and 5(c). The polar motion excitation due to each earthquake is smaller than the combined excitation of atmospheric, oceanic, and hydrologic excitations by two orders of magnitude. The total effect of earthquakes with assuming post seismic relaxation is still smaller than the fluid spheres excitation by one order of magnitude.
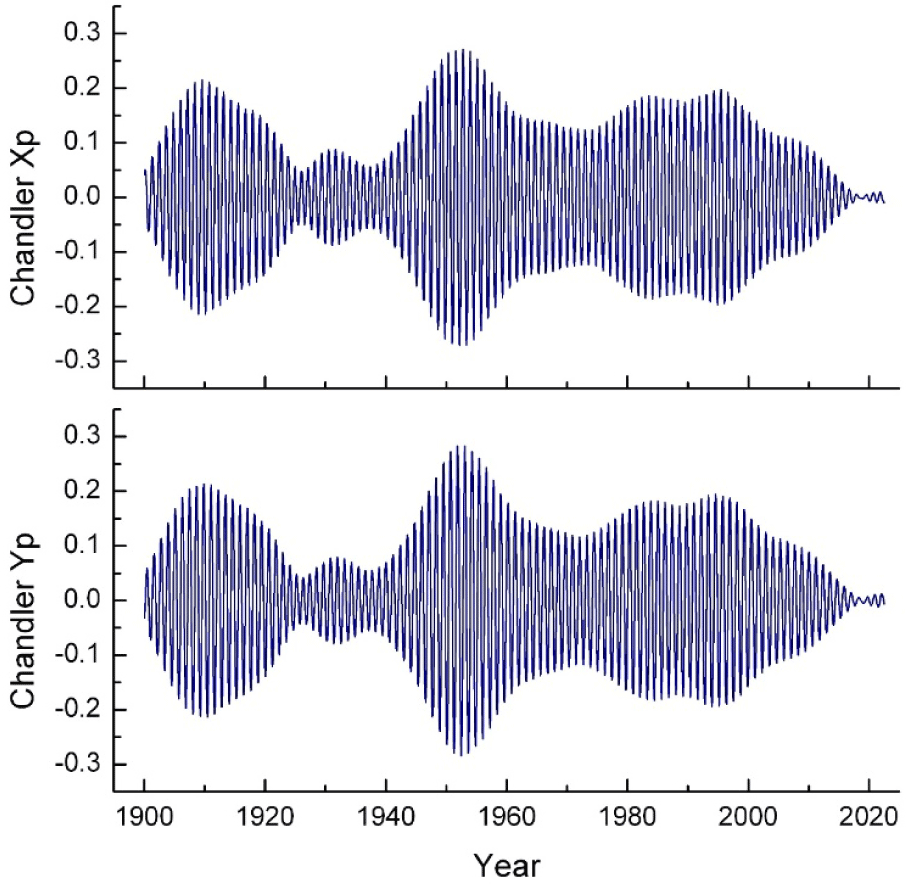
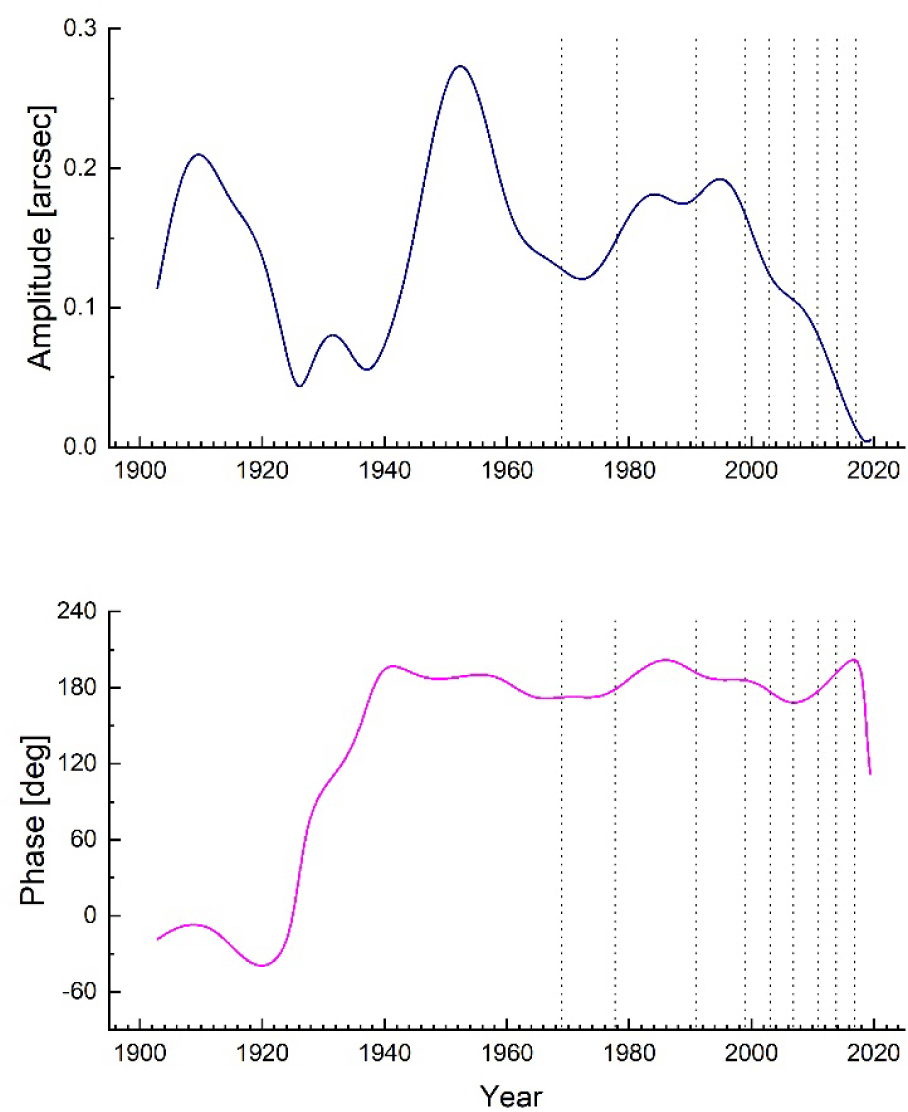
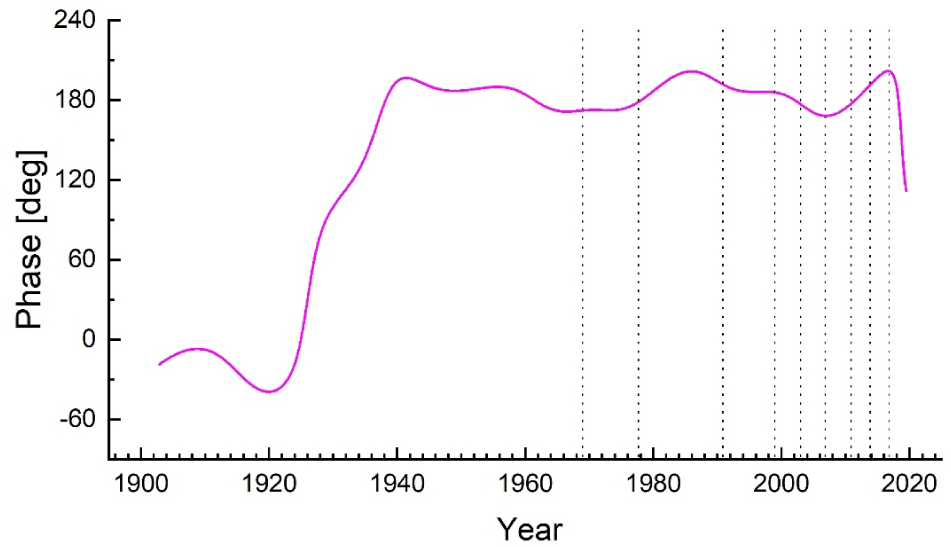
It seems plausible that certain motion deep in the Earth’s core should affect the rotation of the Earth. Geomagnetic jerk has been suspected as an energy source of Chandler wobble (Gibert & Le Mouël 2008; An & Ding 2022; and several references cited in them). We tried to confirm their findings that Chandler phase variation has been triggered by geomagnetic jerks. However, unlike their claims, the phase variation of Chandler wobble does not show close causal relationship with the jerks (Fig. 6).
According to Aubert & Finlay (2019), the amount of typical torque and time duration of geomagnetic jerk are approximately 1 × 10¹⁶ [Nm] and about 1 yr, which corresponds to angular momentum of 3.2 × 10²³ [kg m2 s–1]. Since the spin rotational angular momentum of the Earth is 5.86 × 1033 [kg m2 s–1], two limiting cases can be assumed as follows: (i) torque exerts to deflect the Earth rotation axis, (ii) torque exerts to accelerate (decelerate) the earth rotation angular velocity. For the first case, the deflection angle will be 5.4 × 10⁻¹¹ [rad], which corresponds to 0.34 mm at the surface of the Earth. With the second case Δl.o.d = 4.6 × 10⁻⁶ [sec]. Since these two simple calculations are for the maximum possible exertion of geomagnetic torque in each case, the truth would be smaller than these. Therefore, we do not agree with the former investigations addressing the possibility that Chandler wobble is significantly affected or driven by the geomagnetic jerks. The related details are given in Appendix 4.
From the known values of years-long polar motion excitation, one can deduce the corresponding polar motion by using the simple relation of the two Fourier transform pair in the frequency domain; Eq. (1). We then separately calculated the transient polar motion and added it unto the acquired polar motion after Eq. (1). Fig. 7 is a composite of two panels: (a) the constructed polar motion from the combination of atmospheric, ocean, and hydrologic excitations, (b) observed polar motion. The seismically excited polar motion is mostly of Chandler wobble period. For comparison with Fig. 7(a), the earthquake excited portion and secular movement have been deducted from the polar motion of Fig. 7(b). It is noted here that we initially acquired the fluid excitation time series data from IERS and calculated for only after year 2000. We learned the existence of original and longer dataset in ESMGFZ starting from 1976. The polar motion before 1981 is again omitted (constructed polar motion of these several year time span is much smaller and our seismic effect calculation starts in 1981).
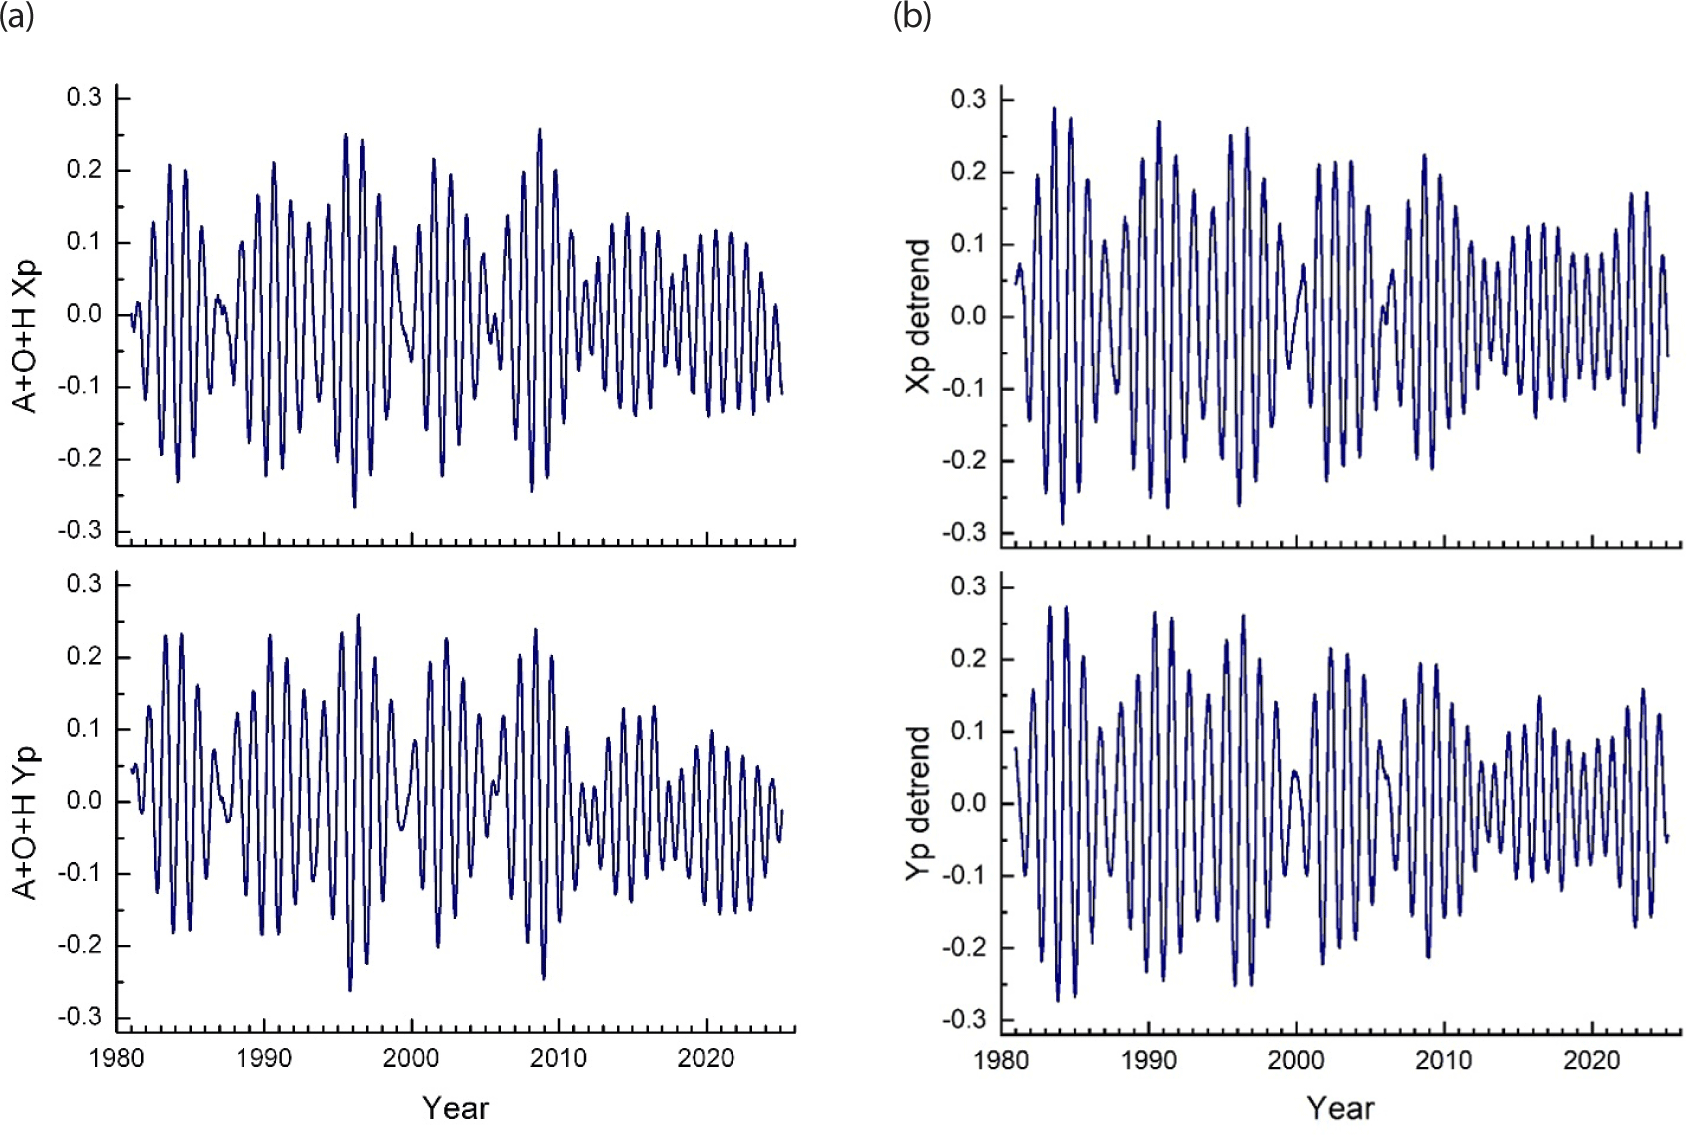
The cause of polar motion as known as the combination of atmospheric, oceanic, and hydrologic effects is explicitly shown in Fig. 7; where the constructed polar motion is compared with the observed polar motion. Not only their amplitudes but also the waveforms of the two sets of time series (Fig. 7(a) and 7(b)) are comparable and in fair match to each other. However, the root mean square value of the difference between the constructed time series and the observed one is found 0.062 arcsec. Therefore, there still remains substantial misfit, which should be ascribed to the limited accuracy in the dataset of the fluid spheres states.
As noted above, atmospheric perturbation was early claimed as the cause of polar motion, and later oceanic and hydrologic effects were recognized. Dozens of studies then followed. However, for more than three decades, almost all those analyses were carried in the frequency domain only. Quite recently, there were two reports in which construction of polar motion is attempted (Xu et al. 2024; Yamaguchi & Furuya 2024). This was due to the shortage of dataset of fluid spheres excitation before 2000s, and also the difficulty in integral evaluation of polar motion in the time domain (Barnes et al. 1983; Chao 1985).
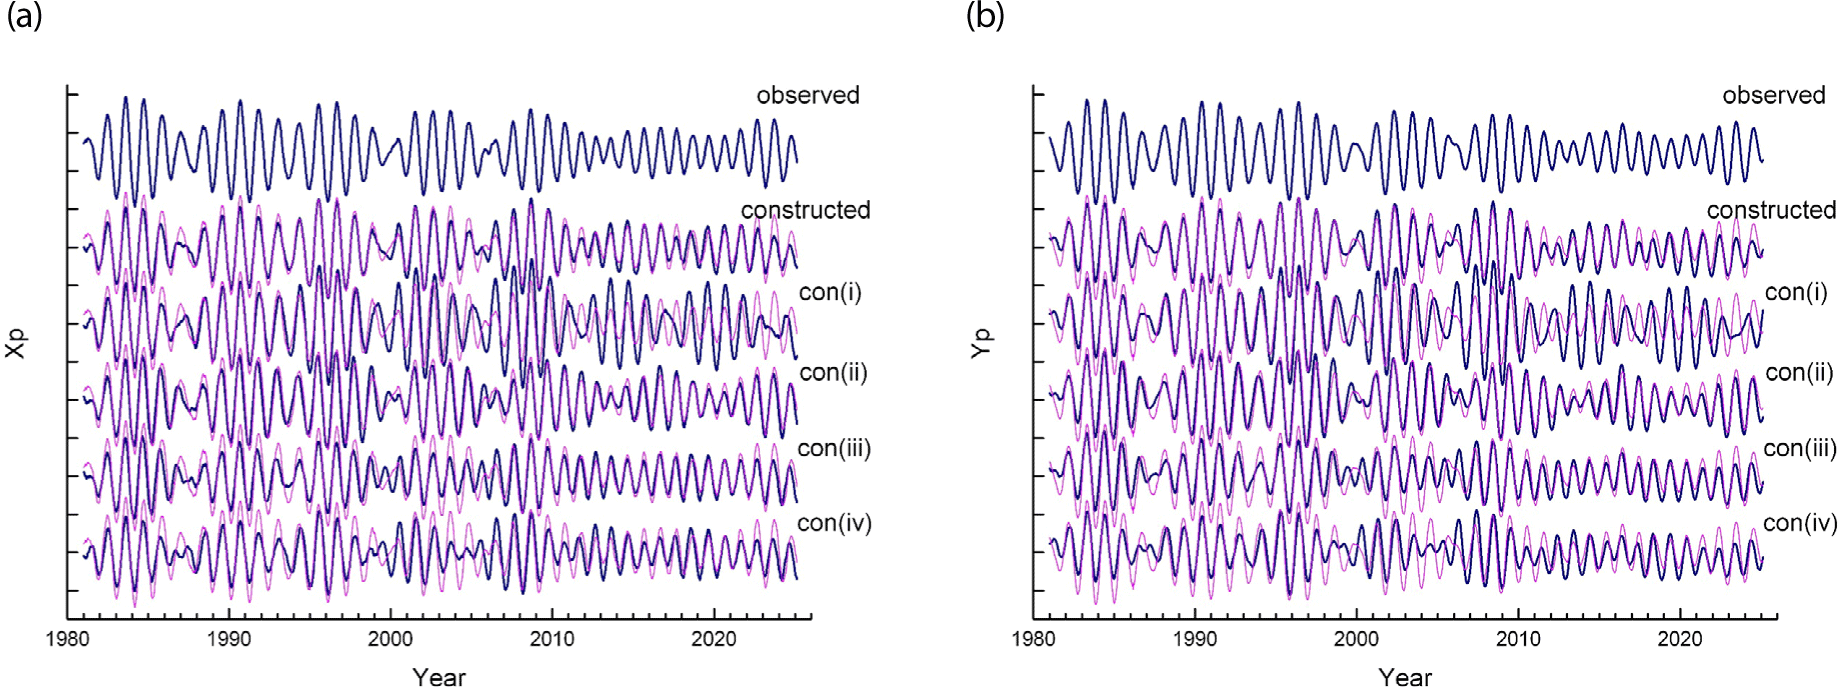
We constructed polar motion for four more cases of different combination of parameters: period T and Q-value of Chandler wobble: (T, Q) = (437, 120), (429, 120), (429, 25), and (437, 25). The four pairs of these additionally constructed polar motions are illustrated in Fig. 8. We found that the corresponding misfit is increased in the r.m.s. value as 0.135, 0.087, 0.097 and 0.110 arcsec respectively.
3. DISCUSSION AND CONCLUSION
The followings are our concluding remarks: After assessments in both the frequency and time domain together, the Earth’s outer fluid spheres excitation is clearly identified as the dominant cause of the oscillatory polar motion including Chandler wobble. Chandler period was found as 432.7 days from the Fourier spectrum of the recent polar motion. By modelling of geodetic excitation in the frequency domain, the period and quality factor of Chandler wobble has been estimated as T = 433.2 days and Q ≈ 63. The minor contribution on Chandler wobble from earthquakes could be calculated, although seismic pole shifts themselves cannot be easily isolated on the polar motion. Effect of geomagnetic jerks on the Earth’s polar motion is negligible.
Constructing polar motion from fluid spheres excitation will be improved in future with accumulation of accurate datasets. The fluid spheres excitation dataset might have underestimated its true values at times by about 10% or so. Still the two time series illustrated as Fig. 7(a) and 7(b) are comparable, and we hope the defect would be smaller with more accurate dataset in future. The difference between the observed polar motion and the constructed polar motion was minimum when the parameter set of (T = 433.2 days and Q = 62.8) was taken, compared with four other choices (Fig. 8). There is slow decrease in the constructed A + O + H yp time series in 7(a), which corresponds to gradual increase in hydrologic excitation after 2005 as shown in Fig. A1(b). Elaborate explanation about this slow excitation is included in one recent article (Seo et al. 2025). Actual Chandler wobble excited by the two greatest earthquakes were approximately calculated in this study as 37 cm and 9.5 cm in the wobble diameter (Fig. 5(b) and (c)).
The Chandler period itself should be regarded as an intrinsic property of the whole Earth structure, even though its observed value may slightly vary depending on the data time span and the method of investigation. Q-value estimate on the power spectrum in 2.1 is not rigorously valid for the polar motion, which is not a harmonic oscillation under uniform driving force (see the spectra shown in Appendix 2). Post-seismic relaxation should not be neglected in seismic polar motion excitation, because the amount of Chandler component associated is large as about 60 percent of coseimic polar motion. There were reports of phenomena, rather than Chandler wobble, to have possible relation with geomagnetic jerks: (i) free core nutation phase change (Malkin et al. 2022), and (ii) Earth’s spin angular velocity change of several year periodicities (Ding et al. 2021). Such two might not be artefacts but real signals associated with slow movement in the Earth’s core.


