


1. INTRODUCTION
Interested in the science of surveying always seeks to improve the position, especially in the long-baseline case, as in (Hou et al. 2021). In the Global Navigation Satellite System (GNSS) processing using dual-frequencies, the results can reach 1 cm in position determination with a long observation time of up to several hours. This technique is associated with various applications, e.g., studying the displacements of the Earth’s surface, establishing coordinate systems, and the movement value determination of tectonic plates (Mayunga & Bokamoso 2021). These applications that used the Relative GNSS positioning systems (RGNSS) adapting the dual frequency method have made it a principal requirement. Differential GPS positioning (DGPS) is a relatively simple and cost-effective method for improving GPS accuracy within 1–3 meters. In comparison the real-time kinematic (RTK) is a more complex and expensive method that provides much higher accuracy to achieve centimetre-level accuracy. The choice between DGPS and RTK depends on the specific application and the required accuracy of the project (Stateczny et al. 2021).
RGNSS can provide positions with high accuracy, but they suffer from several drawbacks. A reference and a rover user receiver must be used and operated simultaneously. A couple of GNSS receivers necessitates using the same type or compatible GNSS receivers at the base and rover stations. These constraints increase the Differential GNSS positioning process’s cost (Bakula et al. 2022). The rover receiver should be close to the GNSS reference station(s) so that the effect of the error caused by the atmosphere and orbits on the base receiver is the same as that on the rover receiver. This point represents a significant obstacle, especially in countries with low control points. It represents another obstacle that was studied and treated in this study. The effect of the different orbital messages on the different baseline lengths was also studied so that the user could control the accuracy required before starting the project (Meilano et al. 2022; Fusic & Sugumari 2023).
The final IGS products are available on the IGS website. It takes 12 to 18 days (Zhang et al. 2019). At the same time, the IGS rapid products (IGR) is available on the IGS website for 17–41 h. In contrast, the ultra-rapid products (IGU) are available for real-time and near-real-time use, as in Montenbruck et al. (2017) and Tran et al. (2020).
Several studies have been conducted in different countries to classify baseline lengths for GPS positioning. For example, Gong et al. (2017) conducted a study in China to classify short baselines ranging from 61 to 232 km. Chu & Yang (2014) implemented a study to compute long baselines up to thousands of kilometers by integrating GPS/Galileo data in processing mode. Similarly, Yadav et al. (2021) categorized baseline lengths as 1,338.710, 149.489, and 38.190 km for long, medium, and short baseline lengths, respectively. In addition, Gillins & Eddy (2017) provided guidelines for classifying baseline lengths according to the National Oceanic and Atmospheric Administration (NOAA) 2007. These guidelines suggested that occupation time for each baseline should be less than 10 km for short, 40–60 km for medium, and greater than 100 km for long baselines, with 30, 180 minutes, and greater than 5 h required for each, respectively. These studies also provide valuable insights into the classification of baseline lengths and the occupation time required for different baselines, which can help improve the accuracy of GPS positioning in various applications.
Due to the mentioned RGNSS limitations, the study area needs to have ground control points, with no reference network other than the High Accuracy Reference Network (HARN) established in 1999, while modern networks cover a specific area of the country (Rashwan & Saba 2023). Additionally, no study specifies the baseline lengths that suit the study area. Therefore, this study provides a new contribution by setting standards for baseline lengths and studying the accuracy of the position without relying on ground control points in the study area. Also, this study indicates the possibility of using rabid products to obtain high accuracy for baseline lengths less than 300 kilometers and achieve an accuracy of less than a centimeter.
This study provides the broad outlines that help create a local reference network to cover all parts of the country by determining the baseline lengths, the accuracy of the position, and the required observation time for the desired accuracy. Due to the lack of ground control points in the study area, the user is forced. As a result, to tie the projects to IGS stations. Therefore, this study helps users to choose the most suitable IGS stations according to the required accuracy by a New MATLAB program (NMP). It is designed to help users choose the IGS stations related to the baseline lengths and the azimuth between the reference and the rover point.
2. METHODOLOGY
This research depends on two main parts. They are designing a NMP to help users automatically choose the IGS stations related to the baseline length and the azimuth between the reference and rover stations (p1, and p2). The program’s design underwent a series of steps, as outlined below;
-
- Downloading the coordinates of the IGS stations related to the International Terrestrial Reference Frame (ITRF) 2008 (Dawooda et al. 2019).
-
- Creating a datasheet of the IGS station’s names and coordinates.
-
- Converting the coordinates of the IGS stations from X, Y, and Z Earth Center Earth Fixed (ECEF) to ϕ, λ, and h, the geodetic coordinates.
-
- The coordinates of the IGS stations and the test point (CO28) are data entered into the NMP program.
-
- Calculating the direct and the inverse distance between the CO28 and the IGS stations.
-
- Calculating the forward and backward azimuth between the CO28 and the IGS stations.
-
- Writing the MATLAB codes to perform the previous calculations. The program and its codes can be ordered directly from the author for free through his email.
-
- The program has been tested on a local network of 11 GNSS points in the tested area, carefully selected to represent reference points such as those of IGS stations. The program’s performance was successfully evaluated by calculating all the points of baseline lengths and the forward and backward azimuth.
Vincenty’s method calculated the geodesics distances and gave complete accuracy over lines of any length, from a few centimeters to nearly 20,000 km. Eqs. (1)–(9) showed the calculation used in the MATLAB codes (Chyad & Al-Saedi 2018).
where;
a, b: major and minor semiaxes of the ellipsoid
f: flattening
α1, α2: azimuths of the geodesic, clockwise from north; α2 in the direction Point1 to Point2 produced
U: reduced latitude
λ: difference in longitude on an auxiliary sphere
ϕ: geodetic latitude, positive north of the equator
L: difference in longitude, positive east
S: length of the geodesic
α: azimuth of the geodesic at the equator
σ: angular distance Point1 to Point2 on the sphere
σm: angular distance on the sphere from the equator to the midpoint of the line
Fig. 1 shows that the NMP program has successfully generated a visual output in the form of a graph, accurately depicting the lengths and azimuths of the baselines.
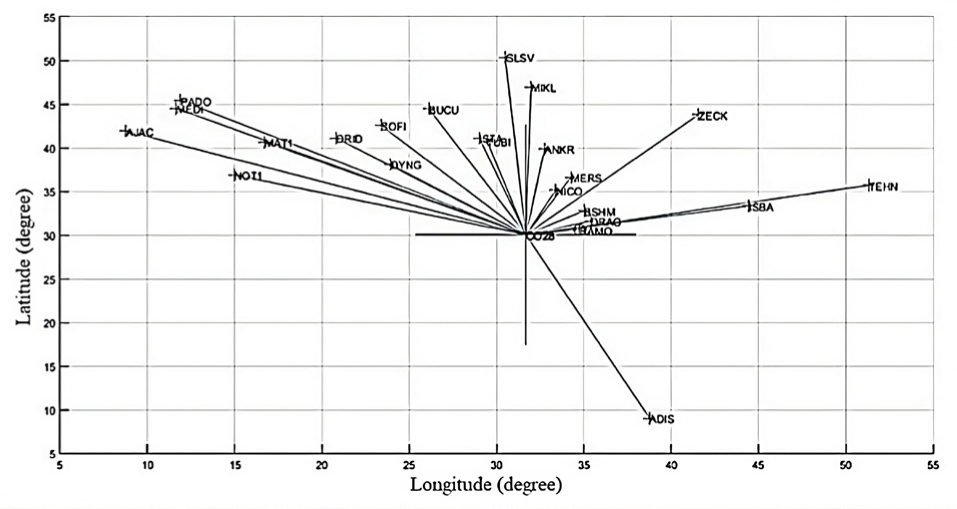
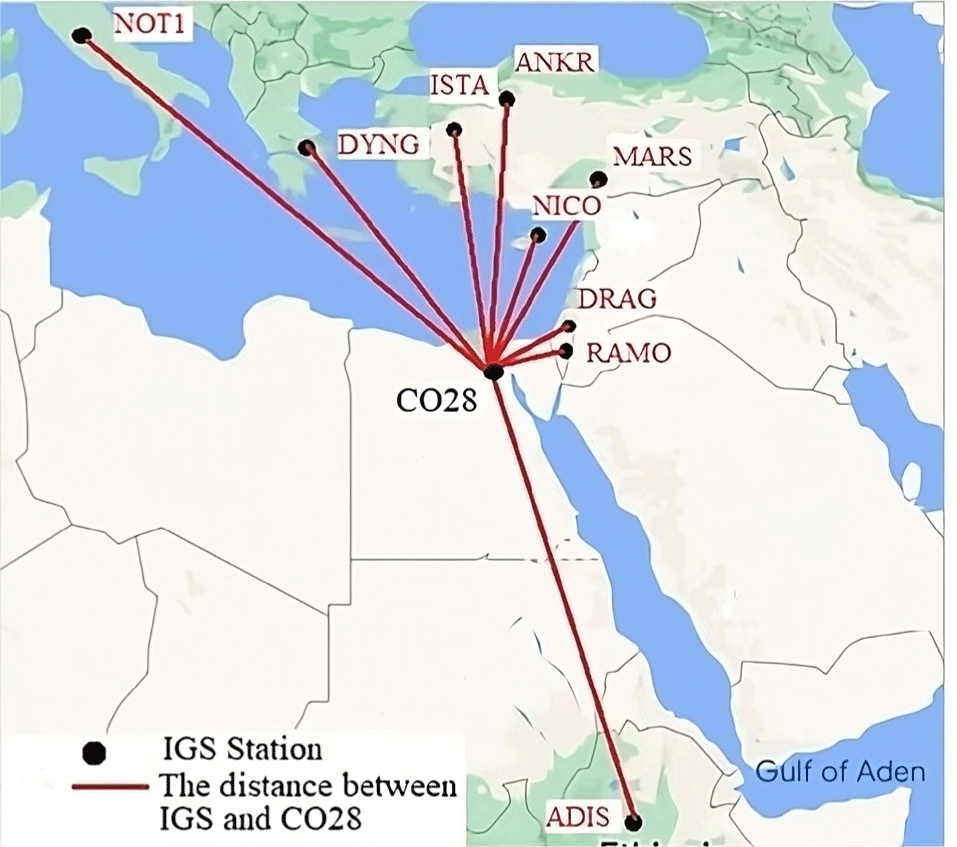
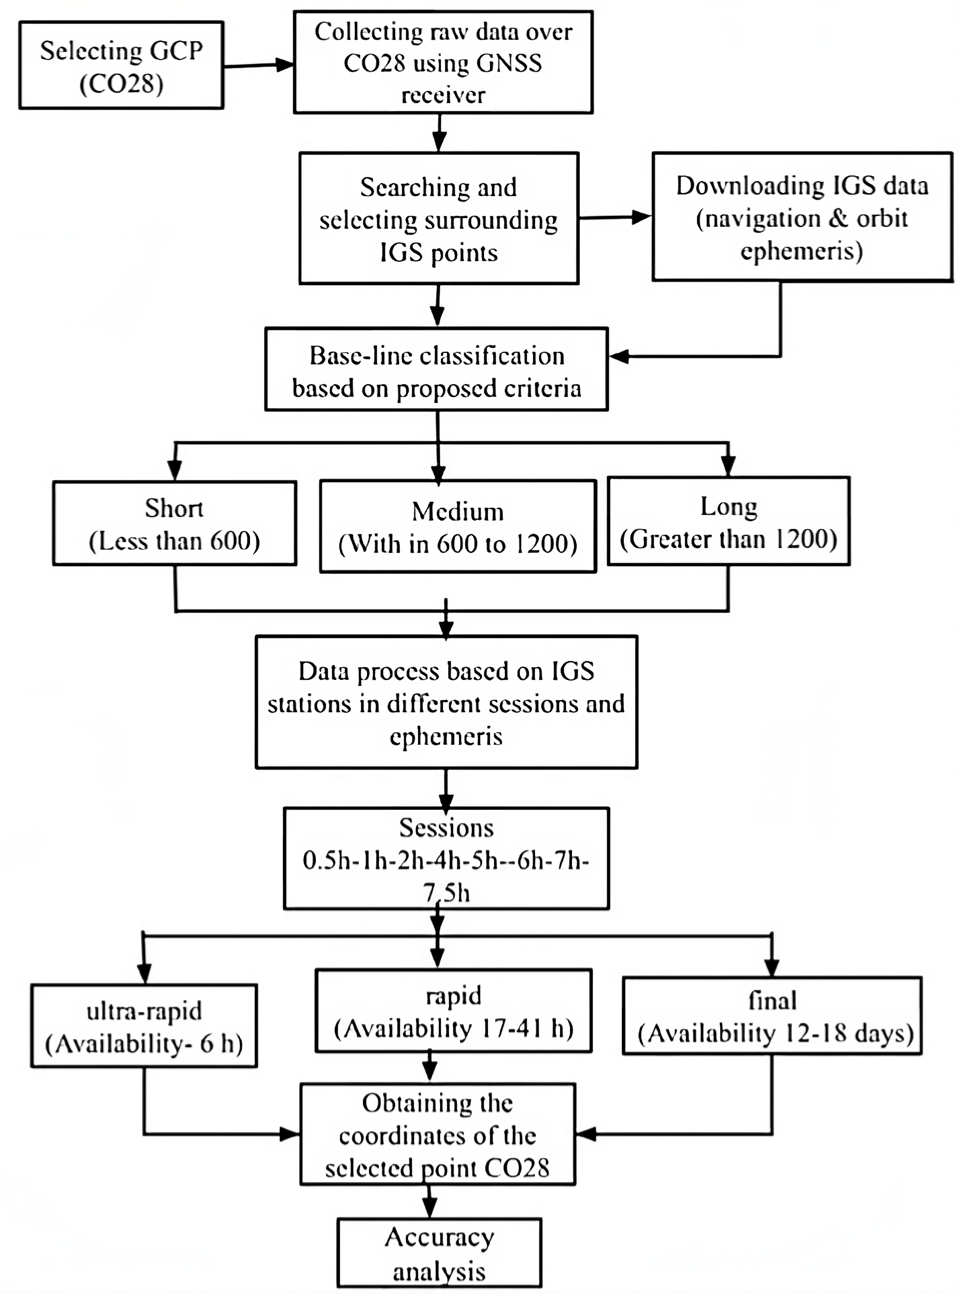
The second part is the experimental tests that study the performance of the position accuracy related to the relation between three factors: observation session, final, rabid, and ultra-rabid products and the baseline lengths. The final, rapid, and IGU for the selected IGS stations and the test point, CO28, mediates northern Egypt were used. Therefore, calculating and analyzing the coordinates’ accuracy for this point based on the selected nine IGS stations (RAMO, DAYNG, MERS, NICO, DRAG, ANKR, ISTA, NOT1, and ADIS). These points were selected by aiding the NMP program such that there is a diversity in the baseline lengths, and each point has at least a receiver that supports GPS and GLONASS satellites during the observation time. Fig. 2 and Table 1 describe these points and lengths regarding the CO28 point. Fig. 3 shows the flowchart of the research methodology.
CO28 coordinates were calculated based on the IGS baseline classification sets (short, medium, and long) using all products to differentiate the accuracy ranges based on the obtained standard deviation of each set.
Baselines were classified based on the longest diagonal distance of the studied country. Considering the length of this diagonal is the range of the long baseline (1,700 km), 2/3 of this diagonal belongs to medium baseline sets (1,200 km), while 1/3 represents the short sets (600 km), as in (Elshambaky et al. 2018).
The following steps illustrate the work procedures:
-
- Selecting a test point, namely CO28, mediating northern Egypt. This point has known coordinates from a local network in Egypt.
-
- Raw data for this point in the static mode were collected for nearly 7.5 h of sessions using dual-frequency receivers of Leica GPS-GS15.
-
- Raw data in its original format (DBX Leica format) converted to a rinex format supported by the used TBC Software (version 3.5; Trimble, Westminster, CO, USA).
-
- Raw data (observation files) from the surrounding nine IGS stations were downloaded from the IGS website (Rashwan & Saba 2023).
-
- Orbit products (final, rabid, and ultra-rabid) for the IGS points were downloaded from Liu et al. (2019).
Three tests were conducted to calculate the CO28 coordinates. Test one; CO28 coordinates were calculated based on the nine IGS stations using the three types of final, rabid, and ultra-rabid GPS products over different sessions (0.5, 1, 2, 4, 5, 6, 7, and 7.5 h). Test two; CO28 coordinates were calculated based on the nine IGS stations using GPS and GLONASS observation. Test three; CO28 coordinates were calculated based on the nine IGS stations using GLONASS observation only.
3. RESULTS AND ANALYSIS
In order to ensure geographic diversity and harmonize the selected IGS points with the test point, nine IGS stations were carefully chosen by aiding the newly designed NMP program. The selection process considered the varying baselines between the IGS station and the test point, as well as the compatibility of the points. Additionally, each IGS station has a receiver supporting GPS and GLONASS observations on a specific test day to ensure accurate and reliable data collection. This approach guarantees that the collected data provides a solid foundation for subsequent analyses and conclusions.
The horizontal and vertical accuracy of CO28 were calculated based on the standard deviation of the differences between the known CO28 coordinates and the coordinates of the same point computed related to the selected IGS points. The horizontal and vertical accuracy of CO28 were calculated based on Eqs. (10)–(23), as in (Hofmann-Wellenhof et al. 2001; Sarkar & Rashid 2017). The differences value in x, y, and z coordinates =
The (3-D) error of the points at the specified session (RE);
where;
x, y, z are the global coordinates for all points (test point and the reference IGS stations)
: the mean error in the x-coordinate value of each point at all session
: the mean error in the y-coordinate value at all points
t: the coordinates of the test point
i: the specific IGS station (NICO, RAMO, …)
j: the specific session (0.5, 1, 2, 4, 6, 7, 7.5 h)
RE: resultant error on the point at the specified session
H: the error in the horizontal coordinates
u: the error in the vertical coordinates
RMS: root mean square of errors of the point at all sessions
N: the observation number
σ: standard deviation
: residual error at horizontal coordinates
: residual error at vertical coordinates
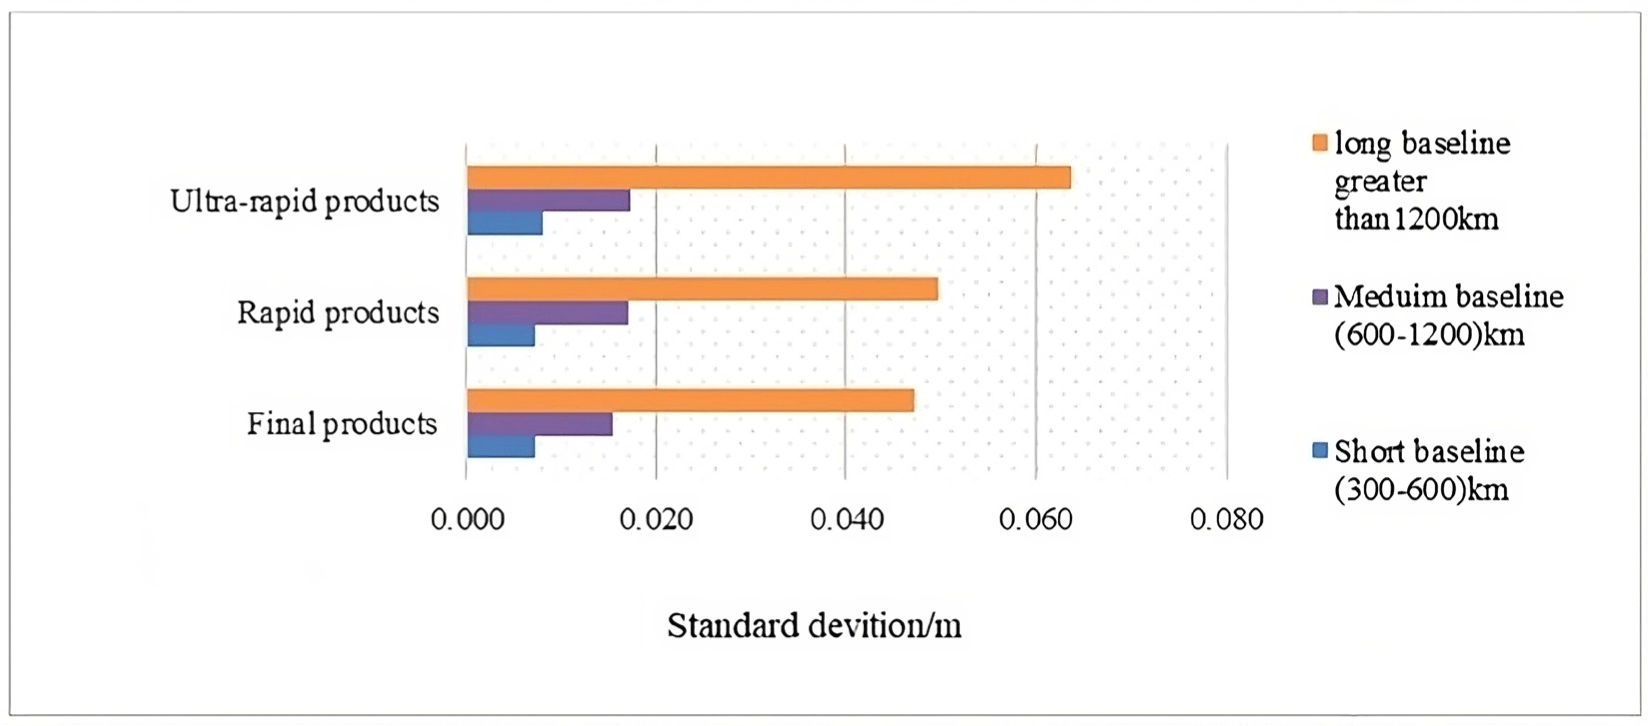
The results are tabulated in Tables 2–5. From the results, there are systematic differences in both horizontal and vertical accuracy for all baselines overall observed sessions except in the case of IGU has dramatic behavior in the differences in accuracy. Considering the optimum solution for the position accuracy achieved using the full session time of observation, which is 7.5 h, so 100% (7.5 h) will be taken as the reference for comparing the results. The 0.5-h results differed from the other sessions for all cases. The 0.5-h of observations in the final products for short, medium, and long baselines achieve accuracy within (0.021 to 0.035 m), (0.039 to 0.061 m), and (0.053 to 0.24 m), respectively. The average improvement for the same session was 16%, 11%, and 8% than the optimum case (full session 7.5 h; 100%).
| SD GPS (Obs.) | Short (300-600 km) | Medium (600-1,200 km) | Long (greater than 1,200 km) |
|---|---|---|---|
| Final products | 7 mm | 16 mm | 47 mm |
| Rapid products | 7.5 mm | 17 mm | 50 mm |
| Ultra-rapid products | 9 mm | 18.5 mm | 64 mm |
In that context, one hour of observations has different results than 0.5-h. The horizontal accuracy for short, medium, and long baselines ranged from 0.012 to 0.014 m, 0.014 to 0.015 m and 0.015 to 0.131 m respectively. The average improvement for the same session was 32%, 37%, and 20% compared with the optimum case (full session 7.5 h). There is quite a similarity between results obtained using the final and the rapid products of horizontal accuracy. In the case of rapid products, the 0.5-h of observations achieved a horizontal accuracy ranging from 0.021 to 0.035 m, 0.041 to 0.062 m, and 0.064 to 0.243 m with improvements of 21%, 10%, and 7% in the case of short, medium, and long baseline respectively. In that context, one hour of observations differs in the obtained results compared with 0.5-h. The horizontal accuracy ranged from 0.011 to 0.014 m, 0.013 to 0.015 m, and 0.015 to 0.132 m with improvements of 40%, 37%, and 18% for short, medium, and long-baseline, respectively. There was a significant difference in the horizontal accuracy using the IGU compared with final and rapid products. Accuracy decreased, as a result, especially with long baseline lengths. The 0.5-h of observations achieved horizontal accuracy within 0.023 to 0.037 m, 0.040 to 0.066 m, and 0.067 to 0.259 m with improvements of 17%, 10%, and 6% in the case of short, medium and long baseline respectively than the optimum case (full session 7.5 h). In that context, one hour of observations gets a noticeable difference in the obtained results compared with 0.5-h. The horizontal accuracy ranged from 0.012 to 0.014 m, 0.014 to 0.016 m, and 0.015 to 0.134 m with improvements of 36%, 35%, and 19% for short, medium, and long-baseline, respectively, than the optimum case (full session 7.5 h).
The Gauss filter was applied to compare the results. Half-hour and one-hour observations of all cases are outside the limits of the one-sigma and two-sigma values but within the three-sigma value. So, this study’s baseline lengths (short, medium, and long) must rely on more than one hour-observations to obtain a high position accuracy of 6 mm. The difference in results from the short to medium and long baseline (Tables 2–4) may be due to the difference in the value of the ionosphere error related to every case. Zhao et al. (2017) confirmed that where in the Asia-Pacific region, in the short baseline, the ionosphere and tropospheric delays can be assumed absent. However, the medium baseline refers to the uncertainty that these ionosphere delays can reliably be modeled as a function of the baseline length. Moreover, the long baseline refers to the necessity to parameterize the ionosphere delays and (wet) zenith tropospheric delay (ZTD) as completely unknown, as in Chu & Yang (2014). The horizontal accuracy of CO28 obtained in the case of ADIS, which has the longest baseline (2,423 km), was 0.243 m in both final and rapid products. However, in the case of the ultra-rapid, it was 0.259 m with a difference of 16 mm from its equivalent, homologue in the case of the other two types in the same session. Also, the ambiguity was not fixed at that point. It may be due to several reasons; the limitation of the TBC software for this type of baseline length, the observation time at this point was unsuitable for the baseline length where the number of the satellites was incomplete. The satellite geometry could have been better; the receiver on the base station and the receiver on the point CO28 are different, matching the study made by (Verhagen & Joosten 2003). The improvement was after a 7.5 h observation session for 1,700 km, where the standard deviation was 0.006 m, which ensures that the baseline length of 2,400 km needs more than a 7.5 h observation session.
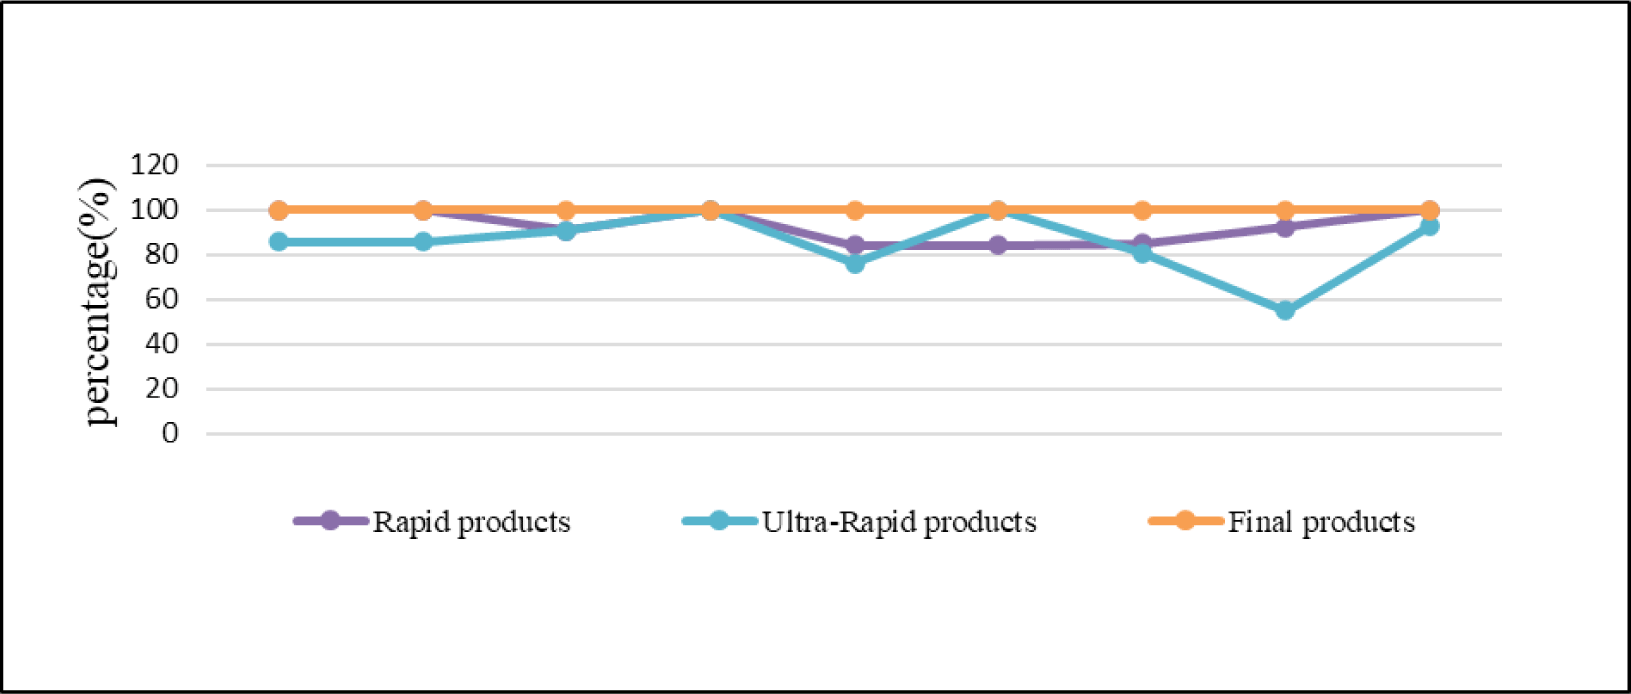
In this study, Table 5, and Figs. 4 and 5 show that the results from the rapid products are nearly similar to those from the final products. On the other hand, the IGS IGU have a noticeable difference in the results obtained from the final products. That coincides with the International GNSS Service specifications. The user can use rabid products, which take off 17 h, instead of the final products, which take 20 days, especially in the case of the short baseline, as in (Montenbruck et al. 2017; Fischer et al. 2021). For all cases, the improvement in accuracy was directly proportional to the baseline length as expected; the accuracy was somewhat stable after 4, 5, and 6 h of observation sessions for short, medium, and long baselines, respectively.
Pertaining the vertical position accuracy, it is noted in the short baseline that the results improve by 83% optimum solution value in 5 h sessions. The medium and long baseline need 7 h and 7.5 h observation sessions to obtain the same results. For more information about the vertical calculations, GPS/GLONASS, and GLONASS only, the results tables, contact the author by email.
4. CONCLUSIONS
Compared to previous studies, the current study has presented specific standards for baseline lengths with a clear indication of the accuracy for each category. This study has shown that the short baseline lengths of up to 300 kilometers can be used accurately in Egypt for establishing a local reference station network. Furthermore, the study has shown that four hours of observation time is sufficient to achieve the required accuracy, in contrast to previous studies suggesting the need for five or more hours for the same baseline length. The new approach employed in this study, which capitalizes on the latest satellite constellation observation and International Association of Geodesy (IAG) data and presents a more efficient and accurate methodology, is a significant contribution to the survey field. The newly designed program NMP has demonstrated efficiency in selecting ground control points. Those interested in surveying science can adopt and request the program for free from the author.
Minimizing observation time without affecting accuracy is the target for all GPS users. This paper studied the relationship between three factors: observation sessions, products, and baseline lengths. IGS stations were used as reference points surrounding the observed point. The coordinates of the tested point were calculated related to the nine selected IGS stations using different products. Using the global base stations to calculate the differences between the Known and calculated coordinates of the same test point.
The results indicate that using final and rapid products for at least 4 h of the observation sessions, a short baseline (300 to 600 km) gives the optimum solution. The standard deviation, in that case, is within 5 mm. At the same time, the medium baseline (750 to 1,100 km) and long baseline (1,250 to 2,400 km) need at least 6 and 7 h of observation sessions, respectively, to give the same results (Tables 2–4). The study did not show a significant difference in position accuracy between the final and rapid results, especially for the baseline lengths of less than 400 km. Using the final products for medium and long baselines is preferred instead of the rapid and ultra-rapid ones. In this case, the obtained accuracy will be improved by 9% and 16% under the same conditions.
Combining different GNSS systems (GPS and GLONASS) has improved the results, especially with long and medium baseline lengths. The standard deviation decreased to 7 mm, 13 mm, and 23 mm for short, medium, and long baseline lengths, respectively. For more information, contact the author by email.
5. RESEARCH CONTRIBUTION
This study helps the users in Egypt to use the same IGS stations in the research to reach the optimum position accuracy. It also presents an innovative and user-friendly program that assists users interested in surveying science to select ground control points. This program will facilitate the creation of ground control points networks with greater efficiency and accuracy. This research recommends that users reduce their effort and project cost by processing data using the rapid products, which only take 17–21 h to achieve an accuracy level of up to 10 mm. Thus, this approach is more practical than waiting 28 days to use the final products.
The findings of this study can be beneficial to several agencies, particularly the Egyptian Survey Authority, as it aids them in creating a ground control points network with 300 km baselines and achieving an accuracy of 10 mm.
6. RECOMMENDATION
The author seeks a potential future work to investigate further and improve positioning accuracy using precise point positioning (PPP), reduce the impact of ionospheric errors by utilizing open-source software, and develop new algorithms and techniques to enhance the accuracy of the positioning results.