


1. INTRODUCTION
The magnetosphere is a cylindrical cavity around the Earth that is formed when the solar wind pressure blowing at supersonic speed and the Earth's magnetic field are in equilibrium (Gold 1959). Therefore, the shape of the magnetosphere and various physical phenomena occurring within the magnetosphere are directly influenced by solar activity. Accordingly, it is thought that magnetic field data for all spaces in the magnetosphere will be required when conducting research on the changing magnetosphere. However, due to the difficulty of access to space, there are many difficulties in measuring the desired data for all spaces. As a result, it can explain the phenomenon well and making a model similar to the actual value is an essential factor in studying the global characteristics of the magnetosphere.
Because of this, many researchers are working on creating and developing Earth's magnetosphere model (Tsyganenko 1995, 2000a, b, 2002a, b;Tsyganenko et al. 2003;Tsyganenko & Sitnov 2005, 2007). Since the magnetosphere are directly affected by solar activity, the Earth’s magnetic field must be predicted by assuming these variable factors when calculating the magnetic field model. However, in any calculation, with the variables of simple and constant, the calculation will be easier and produce consistent results. Otherwise, the calculation will be difficult and likely to give inconsistent results. Therefore, it is natural that high accuracy of the model capable of performing complex calculations is required in developing a model similar to the actual value.
As solar activity becomes more active, a geomagnetic storm occurs when the solar wind accompanies the southward interplanetary magnetic field (IMF) due to the occurrence of coronal mass ejections (CMEs) or flares (Lakhina et al. 2004). Moon (2011) showed the correlation between the IMF Bz component and CME-driven storms. During the magnetic storm, a large ring current flowing westward in the equatorial region of the magnetosphere occurs, causing the Earth’s magnetic field to be reduced. Therefore, in this study, when the variables required to calculate the magnetic field model become complicated (when the range of variation is large), we will analyze the accuracy of the model and find out the reliability of the model by comparing the magnetic field model values with the actual observed values (). For this reason, it was decided that the period of intense solar activity was selected for the analysis when the variables for the calculation of the magnetic field model show complex behavior. Hence, the periods of the magnetic storm were examined. The magnetic field model calculation during the event period used Tsyganenko’s 04 model, 01 model, and 1996 model (hereafter T04, T01, T96 model) among the most commonly used empirical models. The T96 has an clearly defined magnetopause, large-scale Region 1 and 2 Birkeland current systems, and the IMF penetration across the boundary. The T01 represents the variable configuration of the inner magnetosphere for different IMF conditions and ground Dst index (Tsyganenko 2002a, b). Lastly, the T04 is a dynamical model of the storm-time geomagnetic field in the inner magnetosphere, using space magnetometer data taken during several major events in 1996–2000 and simultaneous observations of the solar wind and IMF variance (Tsyganenko & Sitnov 2005).
These magnetic field models are provided by the Geopack module of Space Physics Environment Data Analysis Software (SPEDAS) which is an IDL open source data analysis tool. The Tsyganenko magnetic field model is a tool that can calculate based on information such as the H component of geomagnetic field change, IMF value, solar wind number density, solar wind velocity, etc. By using this, based on the comparison of (magnetic field value calculated by model) and (magnetic field value measured by satellite) during the period without an event (when solar activity is quiet), the trend is analyzed to find out the consistency in the accuracy of the model. Eventually, the accuracy of the model during the event is quantitatively analyzed.
2. DATA AND METHODS
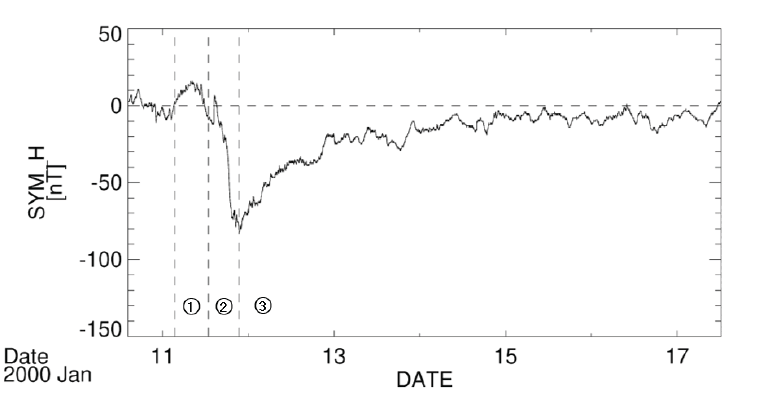
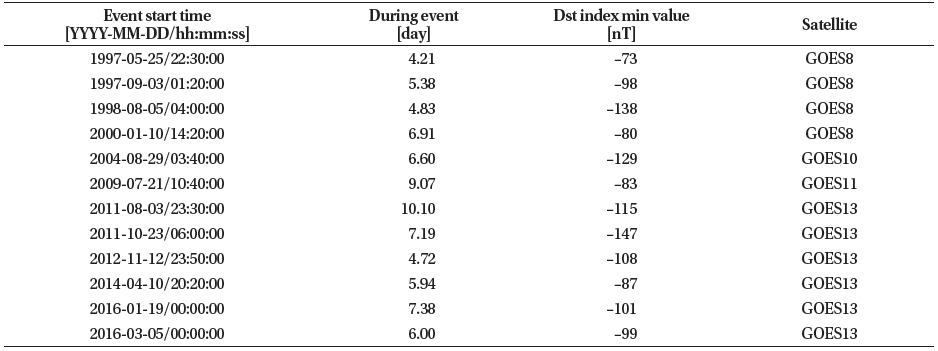
Firstly, in order to identify the period when the magnetic storm event occurred and the quiet period, the Dst index data provided by Kyoto University for the events from 1990 to 2016 were examined, and among the events which show the Dst index –70 nT or less in the main phase due to the magnetic storm. Among them, events such as Fig. 1, which shows changes due to storm sudden commencements (Park et al. 2015) and smooth recovery phase (Lee et al. 2001), were selected. As a result, a total of 12 events were selected (Table 1).
|
Next, we need to compare to the calculated to evaluate the accuracy. For this data, among many satellites operating in the magnetosphere, magnetic field data obtained from satellites of stationary orbit with a fixed distance from the center of the Earth were investigated. data were obtained from the GOES satellite which already had magnetic field observation data for the 12 event periods selected above, and the data were converted into Geocentric Solar Magnetic coordinates for this study.
The variables required to calculate the Tsyganenko magnetic field model are obtained from OMNI data provided by NASA. OMNI is a multi-source dataset of near- Earth solar wind magnetic fields and plasma parameters from November 1963 to today, and has been updated regularly with new data (Papitashvili & King 2006). OMNI provides the IMF (magnitude and vector), flow velocity (magnitude and vector), flow pressure, proton density, and several additional parameters including sunspot and geomagnetic indices and energetic proton fluxes from IMP and GOES. To compare this calculated with , GOES position data of the same time zone as was also used as a variable. Through this, it was worked to compare the actual observation value and the model value of the magnetic field at the same time and space.
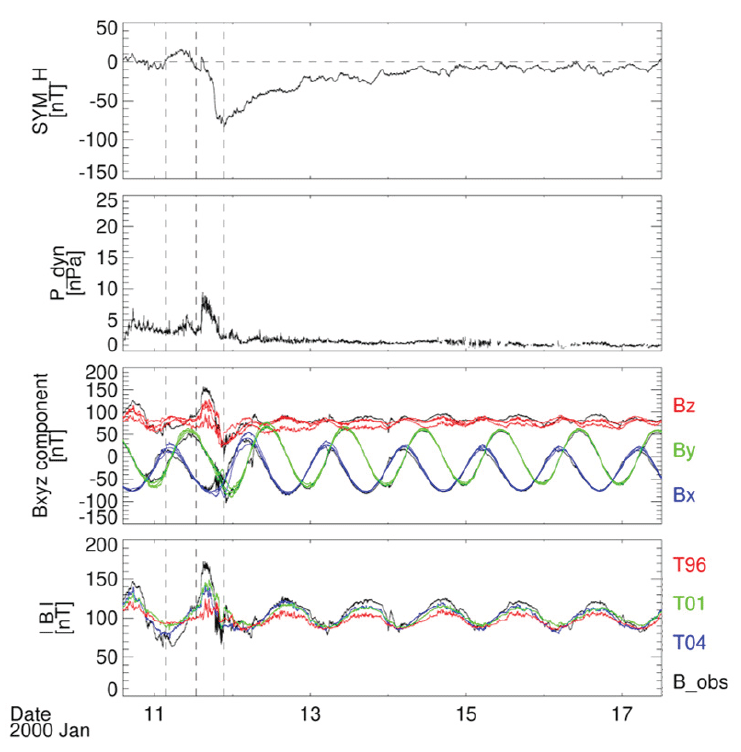
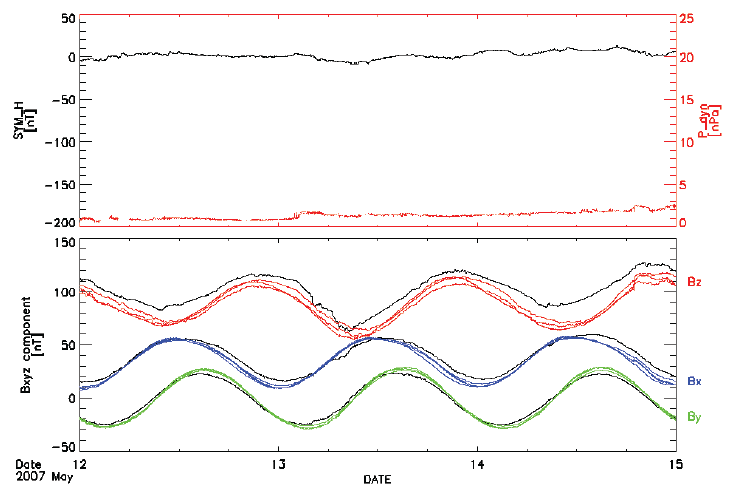
First, based on the data mentioned above, the Dst index and the dynamic pressure of the solar wind were compared together for the 12 magnetic storm events, and considering the correlation between the magnetic storm and the dynamic pressure, and were shown together and compared (Fig. 2).
The Dst index provided by Kyoto University and Sym-H index of OMNI data provided by NASA represent the same physical phenomenon. While the Dst index is an hourly average index, Sym-H provides a one-minute average index. Thus, in order to show high resolution, Sym-H is used instead of Dst index in this study.
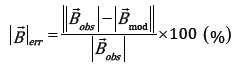
Since the 12 magnetic storm events have different minimum values of the Dst index and different periods of initial, main, and recovery phases, it is necessary to relatively match these events to analyze data. Hence, for each event, the time of the point where the Dst index is minimum was set as the zero point, and the data were reset to the time when the magnetic storm progressed, and the error of for each corresponding time was calculated. Also, at this time, since the magnetic field data is a vector value, not only the strength of the magnetic field but also the error in direction was considered. According to the following equation, the relative error () and directional error (θerr) were calculated.
Based on the errors obtained through this process, the error of the model during the magnetic storm event period for each magnetic field model was analyzed quantitatively through superposed epoch analysis.
3. RESULTS
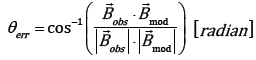
Superposed epoch analysis was performed to show how the error rate changes before and after the magnetic storm by overlapping errors about each the magnetic field models. In this analysis, the time of the main phase, in which the Dst index is the smallest, was set as 0h.
As can be seen from Fig. 3, the T04 model maintained an error of 5% before and after storm, and then showed an error rate of 13% at the peak. In the case of the T01 model, it was also confirmed that the error rate was maintained at around 5%–6% and then the error rate was slightly less than 15% at peak. And the T96 model showed an error rate of less than 10% before and after storm, showing a larger overall error rate than the more recent version of the magnetic field model. Among the three models, the latest version of the T04 model is the most suitable to obtain model data for the intensity of the magnetic field using the Tsyganenko magnetic field model.
The three figures on the right side of Fig. 3 are the error rates of the magnetic field models during periods of quiet solar activity. Unexpectedly, T01 showed the best performance with an average error of 8%. In addition, it seems that each model has an error rate of about 8%–14%, and considering this, it is thought that the effect of the magnetic storm period on each model will actually be around 10%.
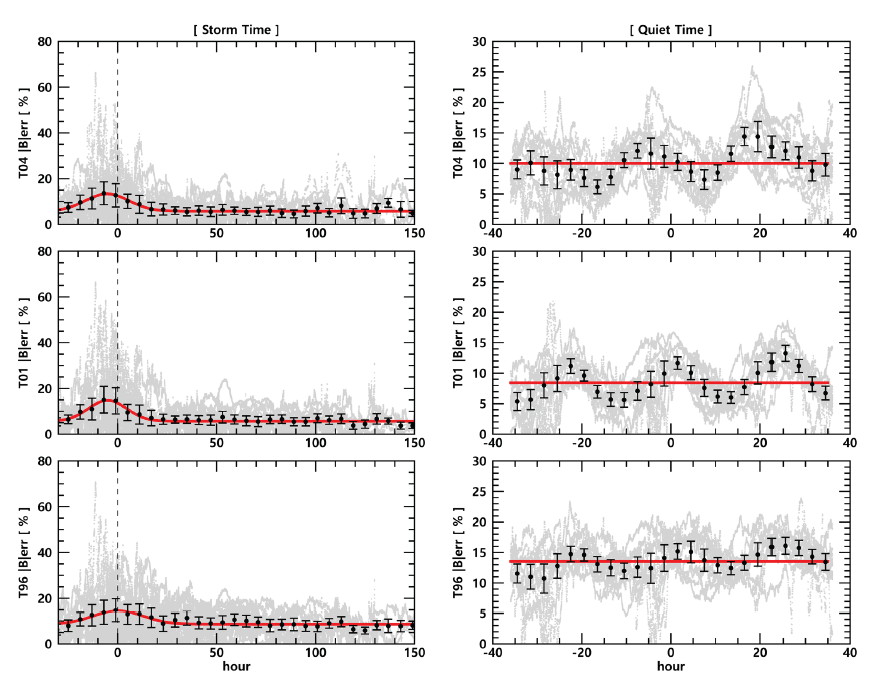
Similar results can be obtained with errors in the direction of the magnetic field model (Fig. 4). When the error is at its peak, it can be seen that the direction of differs from by 0.2–0.4 radian (π/15 – π/8). Since cosθ ≈ 1 – θ2/2, the error in the direction is θ2 and can be said to be within 15%.
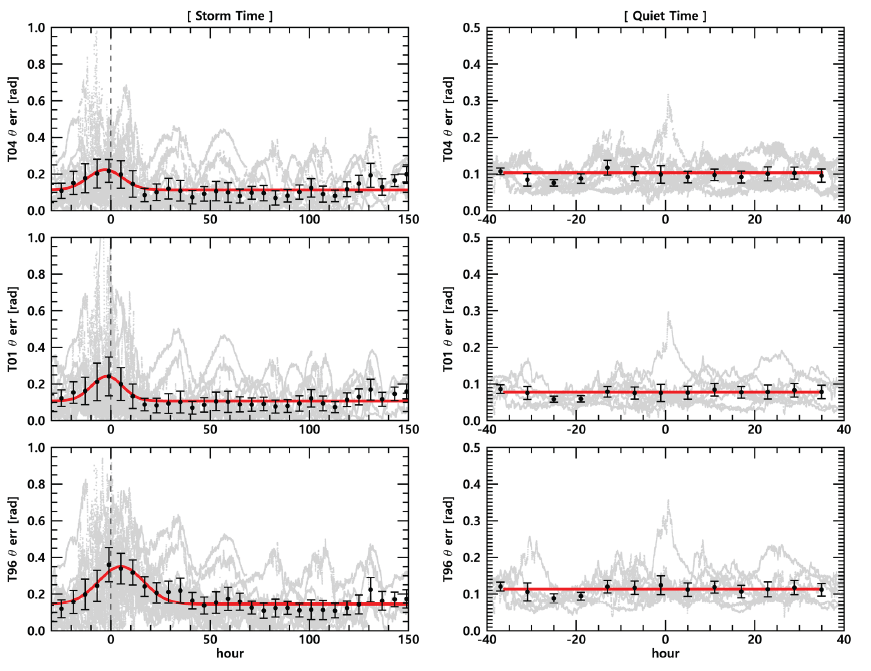
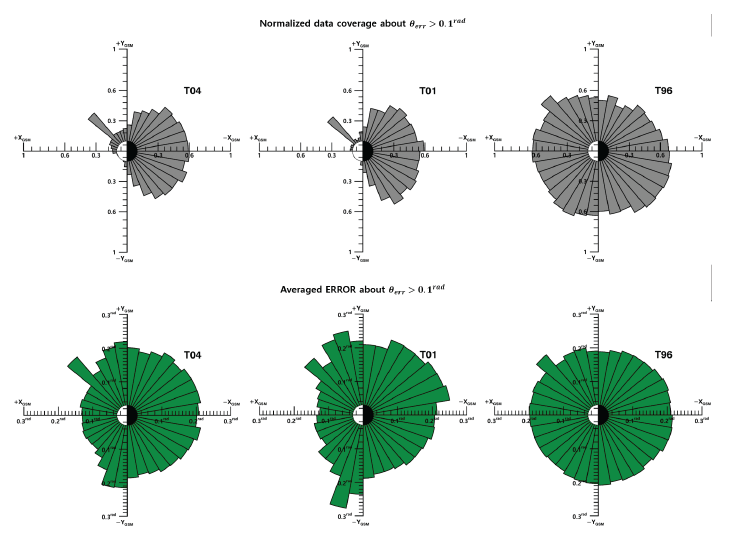
Only parts where the errors of magnitude and direction exceeded 10% and 0.1rad were separately extracted, and a distribution in which errors were large for each magnetic local time (MLT) was confirmed. The gray pie-chart in Fig. 5 corresponds to the normalized value obtained by dividing the number of data with an error of more than 10% from the data at each MLT point (bin size 10°). In the green piechart, the of grater than 10% was averaged for each point. In T04 and T01, day-night asymmetry was seen on the nightside rather than on the dayside. On the contrary, T96 were more on the dayside, as well as more data with large errors in all spaces than the previous two models. The large number of data errors of more than 10% on the dayside of T96 will be mentioned in Section 4. Looking at the green pie-chart, the error rate seems to be similar in all spaces, but in T96, it was confirmed that the error rate increased by nearly 20% on the Earth’s night side, that is, in the magnetosphere tail area.
The day-night asymmetry of the above mentioned model error is more pronounced in the direction error (Fig. 6). The average error is also lower on the day side at T04 and T01, and it may be seen that it is evenly distributed overall at T96. Taken together, T01 seems a little more appropriate to obtain directional information of the magnetic field for the dayside during the geomagnetic storm, and it would be helpful to use the latest model for the magnitude. It will also be possible to show the least error in using T01 in quiet time.
4. DISCUSSION
Overall, the errors in these model values are believed to come from the error in the process of calculating the value of using the Tsyganenko magnetic field model or the lack of data necessary for calculating the magnetic field model. As can be seen in the comparison of the x, y, z components of and in Fig. 2, the x, y components of and do not differ significantly from each other. In contrast, the z component shows a noticeable difference compared to the other components and generally shows a tendency of , which was observed not only during magnetic storm periods but also during periods of quiet solar activity (Fig. 7).
 (below, black) and
  (below, color classification for each component) during periods of quiet solar activity; Different lines for each color show the values of different models, and it is only to check which components show differences from the observed values, and it does not indicate which model each line is.
It is speculated that the difference in the z component caused errors in the direction and strength of the magnetic field model. A more accurate magnetic field model is expected to be calculated if we resolve this issue.
Also, as shown in Figs. 3 and 4, when the errors of each magnetic field model are at their peak, the time of peak turned out to be slightly to the left of 0h, rather than 0h (the point where the Dst index is the minimum). That is, the error value tended to increase during the main phase of the magnetic storm period. Referring to Fig. 2 as a representative example, shows a rapid change at the two points where the dynamic pressure suddenly increases, and the Dst index is the minimum. While is similar to to some extent when the Dst index is minimum, the difference between ,z and obviously increased when the dynamic pressure rapidly increased. In other words, it can be considered that dynamic pressure has a significant impact on the magnetic field data.
The dynamic pressure is given by the following equation.

Further study is needed to determine the reason why magnetic field data respond sensitively to dynamic pressure: solar wind density or solar wind speed.
Finally, comparing the results of each model, T04 and T01 show similar results, while T96 shows a significant difference. We believe that this is mainly because of the simple empirical ring current model used in T96; subsequent models use more accurate approximations by calculating ring current based on the electric current considering an observed distribution of particle pressure, anisotropy and dawn-dusk asymmetry of ring current (Tsyganenko 2002a). However, in the case of the T04 model, the effect of partial ring current cannot be ignored in the situation where the solar wind dynamic pressure is increasing (Park et al. 2011). In addition, post-T96 models were developed by combining the effects of azimuthally asymmetric ring current and fieldaligned current. For this reason, the performance of the T96 seems to be lower than that of the subsequent models, and the use of the T96 model should be avoided at least during storm time.
5. SUMMARY
In order to analyze the accuracy of the Tsyganenko magnetic field models (T04, T01, and T96) on the prediction of change in the geomagnetic field due to magnetic storms, 12 magnetic storm events from 1990 to 2016 were selected. Calculations were performed for the magnetic field models, and a comparison of the results with the actual observed values was made. The errors for the magnetic field magnitude and direction were obtained for each magnetic field model, then the errors for each magnetic field model were analyzed by superposed epoch analysis. Although the newer models generally expect better performance, our results suggest that it may be appropriate to use previous versions of the model depending on the situation. During the geomagnetic storm, the use of the T04 model, which has an average error of about 13% even at the point where the error is the largest, would be effective. During the quiet time, surprisingly, T01 showed the best performance with an average error of 8%. In addition, by identifying points with spatially large errors during storm time, it quantitatively grasps the increase in errors in the magnetotail.