1. INTRODUCTION
Unlike the more stable inner belt, the outer Van Allen radiation belt, which harbors relativistic (>~400 keV) and ultra-relativistic (>~2 MeV) electrons, is extremely variable (e.g., Blake et al. 1992). These energetic particles in both belts pose a challenge when it comes to flying and operating manned and unmanned missions from low-Earth and geosynchronous orbits to cislunar space and beyond. Today we recognize that the high-energy radiation environment in the belts is one of the pervasive and persistent threats to human technological systems that constitute what we term space weather (Baker & Lanzerotti 2016). The processes governing the variability of the radiation belt particles have been debated since the discovery of the belts in 1958 (Baker et al. 2018). It is generally agreed that the outer belt variability is a result of a delicate balance between acceleration, transport, and loss (Reeves et al. 2003). It is also understood that plasma waves found in a wide frequency regime are the key player driving these processes (Thorne 2010). Traditionally, it was thought that inward radial transport by resonant interactions with ultra-low-frequency (ULF) waves is the dominant mechanism for energizing particles in the outer belt as they are transported inwards from a source region at higher L shells (Schulz & Lanzerotti 1974). At the same time, it was well known that there are higher-frequency waves in the inner magnetosphere—namely whistler-mode chorus, plasmaspheric hiss, and electromagnetic cyclotron harmonic waves—capable of resonantly interacting with radiation belt electrons. It was suggested by quasilinear theory and later confirmed by recent satellite missions that the presence of these higher-frequency waves in a localized region in L shells can accelerate them locally in the heart of the outer radiation belt (Li & Hudson 2019). Recent studies suggest that both mechanisms appear to operate, either simultaneously or independent of each other, and could both be potentially important in shaping the outer belt (Thorne et al. 2013, Jaynes et al. 2018).
Relativistic electron events are often observed during great storms associated with ULF waves. A large buildup of relativistic electrons was observed during the great storm of March 24, 1991 and Halloween storms (October 29 to November 4, 2003). Many recent observations have suggested that enhancements in the flux of energetic electrons are closely associated with ULF waves in Pc4 (6.7–22.2 mHz) or Pc5 (1.7–6.7 mHz) frequency ranges (e.g., Rostoker et al. 1998;Mathie & Mann 2000;Mann et al. 2013). A number of authors have studied the modulation of energetic electron and proton fluxes in Pc5 ranges (e.g., Southwood & Kivelson 1981;Higbie et al. 1982;Takahashi et al. 1985;Mann et al. 2013). Elkington et al. (1999, 2003) suggested that relativistic electrons can be accelerated via drift resonance with toroidal Pc5 ULF waves. We observed multiple packets of ULF waves in the 1–10 mHz frequency range and large modulation in the electron and proton fluxes with same frequencies in the recovery phase of the geomagnetic storm. Our goal is to examine the electron driftresonance interaction with Pc5 ULF waves during magnetic storm times as well as examining ULF wave interactions with energetic protons as well.
2. INSTRUMENTATION
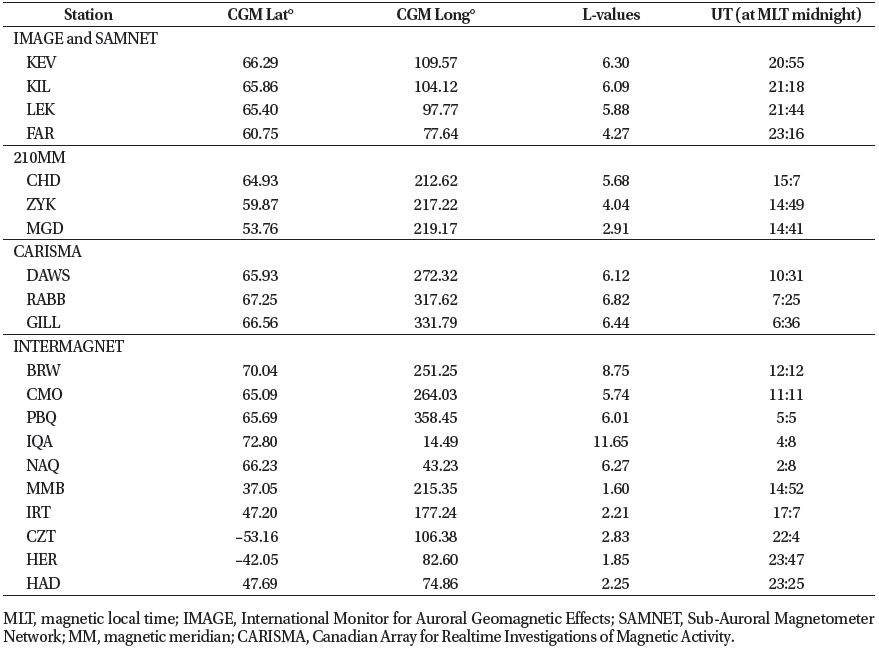
We analyze ground-based magnetometer array and satellite data during the recovery phase of the geomagnetic storm of 16th July 2000. We examine magnetic field data using the following ground-based magnetometer arrays, International Monitor for Auroral Geomagnetic Effects (IMAGE) (Viljanen & Häkkinen 1997), Sub-Auroral Magnetometer Network (SAMNET) (Yeoman et al. 1990;Wild 2006), 210 magnetic meridian (MM) chain (Yumoto et al. 1992;Yumoto & The 210° MM Magnetic Observation Group 1996) in the western Pacific, Canadian Array for Realtime Investigations of Magnetic Activity (CARISMA) magnetometer array (http://www.carisma.ca) (e.g., Mann et al. 2008) and INTERMAGNET stations (Table 1). We also surveyed Geostationary Operational Environmental Satellites (GOES) 8 magnetic field data. Particle flux data for this study were obtained from Synchronous Orbit Particle Analyzer (SOPA) on board Los Alamos geostationary satellites (Belian et al. 1992). The SOPA instrument measures electrons in 10 energy channels (from 50 keV to greater than 1.5 MeV) and protons in 12 channels (50 keV to 50 MeV). We used spin averaged (10 s) electron (50–750 keV) and proton (50–400 keV) count rates averaged over three telescopes.
3. PC5 ULF WAVES
Fig. 1 shows the magnetic field H-component observed by selected ground-based magnetometers around the world. Table 1 shows the corrected geomagnetic coordinates (CGM) latitude, longitude, L-value of the magnetometers plotted in Fig. 1. The stations shown in this plot are organized such that stations were longitudinally ordered from noon to dawn, midnight, and dusk. Due to the complexity of the observed waves, we divided our analysis to concentrate on four intervals to interpret the modulation of the flux of energetic particles. From left to right; (a) 0700–0820 UT, (b) 0850–1010 UT, (c) 1010–1130 UT and (d) 1130–1250 UT.
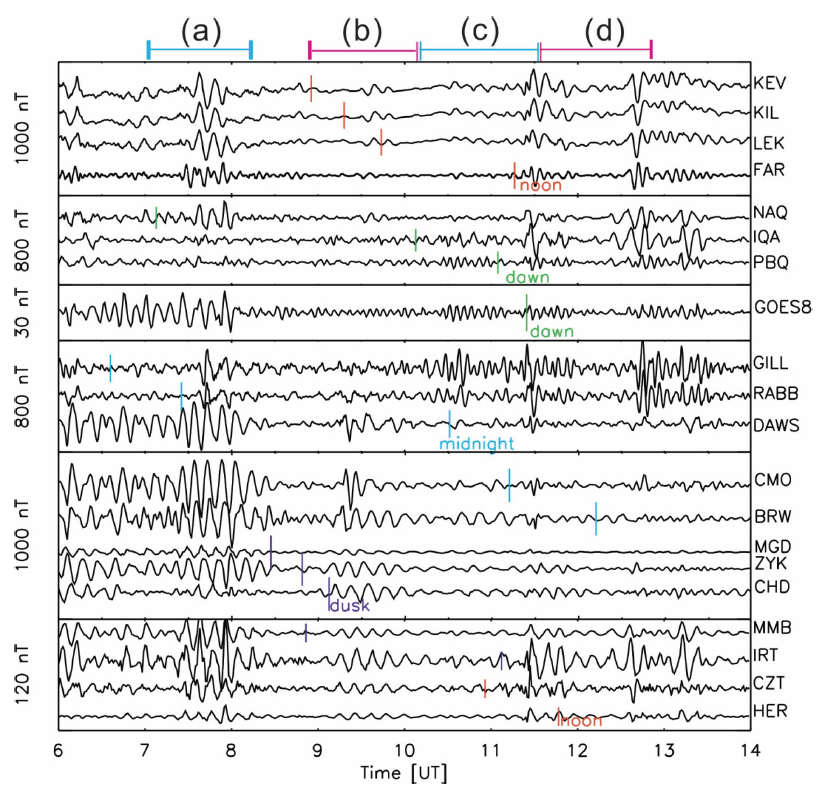
The first time interval (0700–0820 UT) shows strong evidence of a global oscillation with frequency of 1.7 mHz (600 s) in the ground-based magnetometer stations except stations located near midnight such as IQA, PBQ, and RABB. Pc5 ULF waves with a frequency of 1.7 mHz appeared even at very low latitudes such as the MMB stations located at L ~1.6. The Faroes (FAR) station located near the dawn flank showed multiple discrete frequency waves with periods of 300 s (3.3 mHz) and 600 s (1.7 mHz). The largest amplitude toroidal waves with a frequency of 1.7 mHz, assuming a 90° ionospheric rotation into the the H-component on the ground, appear near the dusk flank (DAWS, CMO, BRW) while no clear oscillation appears near midnight.
The second time interval (0850–1010 UT) shows a spectral peak at 1.4 mHz (690 s) in BRW, ZKY, and CHD stations located near dusk. These longer period waves appear in the dayside of the magnetosphere during this time interval, and the largest amplitude still appears at the dusk flank. These waves are localized in the afternoon sector. However, GOES 8 which was located close to the dawn flank shows evidence of higher frequency (3.3 mHz) waves.
The third time interval (1010–1130 UT) shows that waves have the largest amplitude near dusk (BRW, ZYK, and CHD) with frequency of 1.2 mHz (810 s). Waves with frequency of 3.3 mHz (300 s) still appear in the dawn flank.
During the fourth time interval (1130–1250 UT), 1.7 mHz (600 s) waves were observed in the afternoon local time sector with the largest amplitude near dusk. Again, 3.3 mHz waves are still observed in the dawn flank (such as PBQ, GOES 8, GILL, and RABB stations).
In summary, multiple packets of discrete frequency Pc5 ULF waves appeared globally with a more limited local time extent during the great geomagnetic storm of July 16, 2000. Global Pc5 pulsations with a frequency of 1.7 mHz appeared in the dayside of the magnetosphere simultaneously, with the largest amplitude near dusk and pre-midnight. Also, waves with frequencies of 1.4 mHz (690 s) and 1.2 mHz (810 s) appeared localized from post-noon to pre-midnight with the largest amplitude near dusk. However, 3.3 mHz (300 s) waves appeared locally in the morning sector with the largest amplitude at the dawn flank. We also investigated particle flux measurements obtained from the Los Alamos National Laboratory (LANL) geosynchronous SOPA. Particle flux measurements obtained from the SOPA instrument on board the LANL geosynchronous satellites show evidence of an energetic particle and ULF wave interaction during the July 16 storm and this will be studied in the following section.
4. ENERGETIC ELECTRON AND PROTON FLUXES
Fig. 2 shows the magnetic field H-components observed from ground-based stations (KIL, FAR, CMO, and ZYK), magnetic field Y-component observed from GOES 8 and the electron and proton fluxes observed by LANL 1994- 084, LANL 1989-046 and LANL 1991-080, respectively. The ground-based stations were located at different local times to enable a comparison between the local time variation of the waves magnetic field and the observed energetic particle flux modulations. The bottom six panels show spinaveraged differential flux for LANL satellites in different energy ranges. From the top to bottom, the ranges of the electron energy channels are 50–75 keV, 75–105 keV, 105–150 keV, 150–225 keV, 225–315 keV, 315–500 keV, and 500–750 keV and the proton energy channels are 50–75 keV, 75–113 keV, 113–170 keV, 170–250 keV, and 250–400 keV. Blue colors represent lower energy channels and red colors represent higher energy channels. Fig. 3 shows the power spectra during each of the four time intervals shown in panels (a)– (d) of Fig. 2. From left to right, the columns show (a) 0700– 0820 UT, (b) 0850–1010 UT, (c) 1010–1130 UT and (d) 1130– 1250 UT. Multiple discrete spectral peaks were observed in the energetic particle flux similar to the magnetic waves observed by the ground-based magnetometers. A 600 s (1.7 mHz) period oscillation of electron and proton flux appeared between 0700–0820 UT during interval (a) and longer period waves of 690 s (1.4 mHz) and 810 s (1.2 mHz) appeared during the intervals (b) and (c), respectively. During the interval (d) we again observed 600 s (1.7 mHz) period waves. Also, 300 s (3.3 mHz) small amplitude oscillations were observed in LANL 1991-080 in the local morning during all intervals (a)–(d).
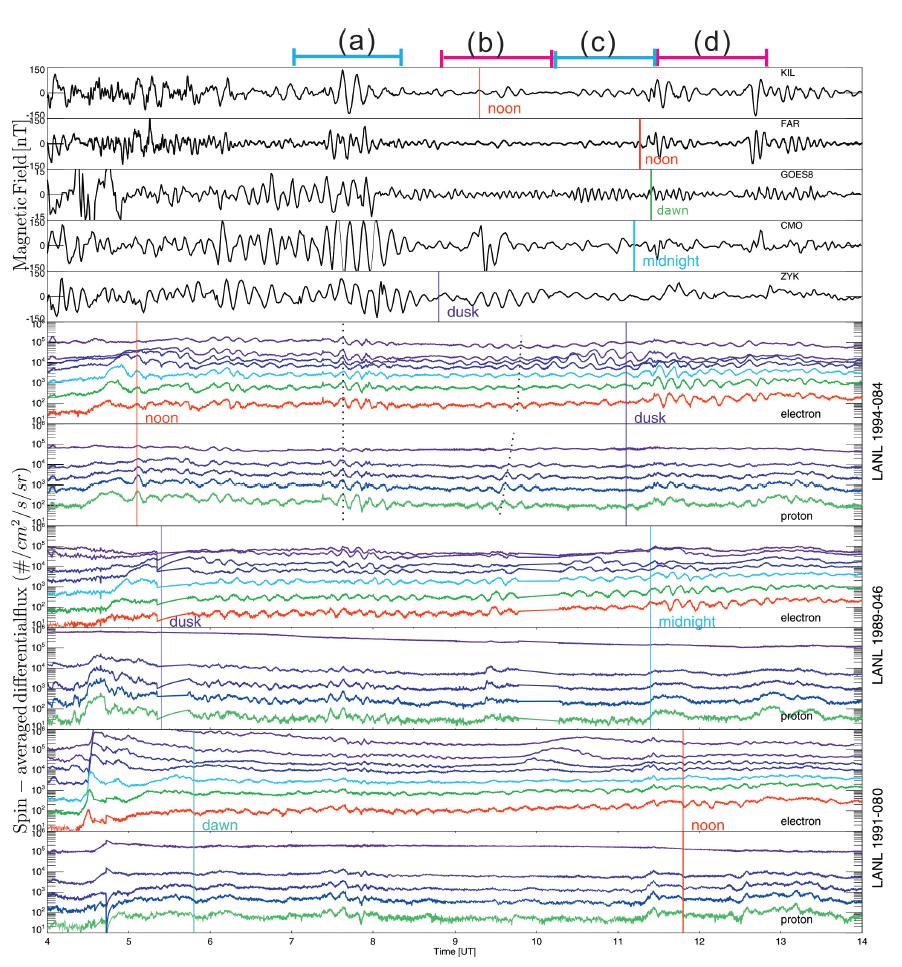
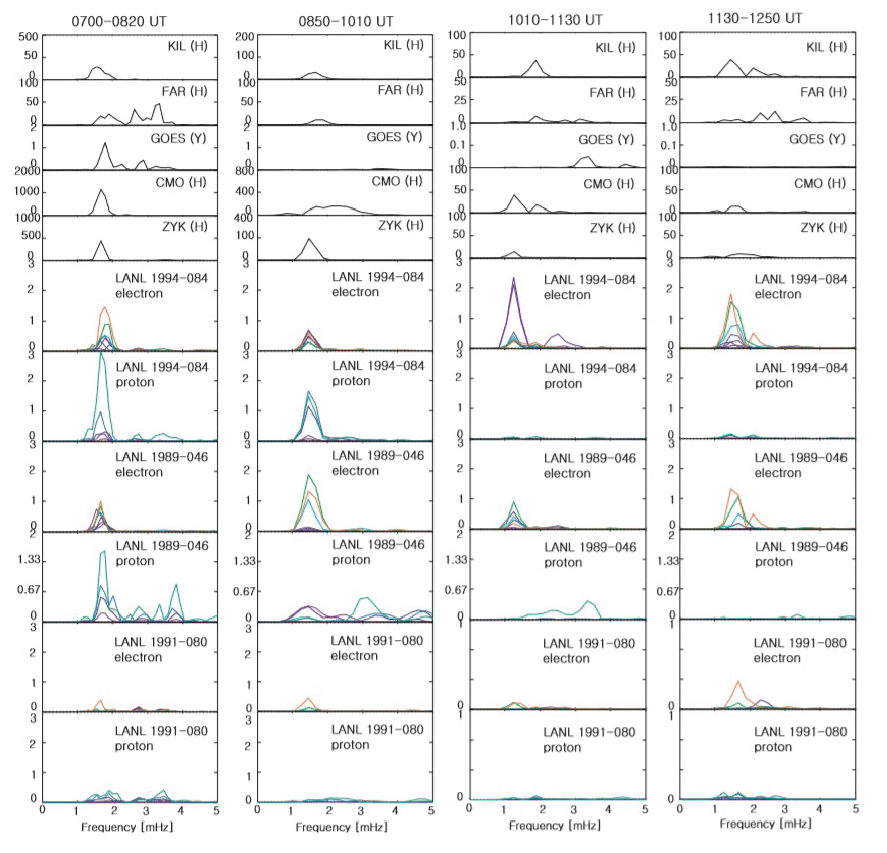
The first time interval (0700–0820 UT) is characterized as a global oscillation of 1.7 mHz frequency Pc5 waves in the ground-based magnetometer data and 3.3 mHz frequency Pc5 waves in the morning sector [see Fig. 3, interval (a)]. We observed at LANL 1994 and LANL 1989 that the proton and electron flux oscillate with the same frequency 1.7 mHz and that all energy channels of both electrons and protons oscillated in phase. In Fig. 2, a dotted vertical line in LANL 1994-084 during interval (a) is drawn to indicate that there was no phase change between electrons and protons and between different energies. On the other hand, LANL 1991- 080 shows 600 s (1.7 mHz) period flux modulation in the energy channels between 500 and 750 keV for electrons, and a 300 s (3.3 mHz) period modulation appears in the lower energy channels with a smaller amplitude. Proton flux oscillations at 1.7 mHz appear at most energies but with small amplitudes. The particle flux modulations seem to be related with magnetospheric Pc5 waves observed on the ground and in space. Both particle flux and geomagnetic field oscillations at 1.7 mHz show the largest amplitude in the afternoon. For example, CMO [L = 5.72, magnetic local time (MLT) = 19:49–21:09] shows the largest amplitude pulsations on the dusk flank and electron flux and proton flux oscillate simultaneously with very large amplitude at LANL 1994-084 (L = 6.8, MLT = 13:42–14:58) and LANL 1989-046 (L = 6.6, MLT = 19:46–21:02). In the same manner, 3.3 mHz frequency waves appeared in the morning for both magnetic field from FAR station (L = 4.3, MLT = 06:44–08:04) and electron flux from LANL 1991-080 (L = 6.6, MLT = 07:21– 08:37). Coherent observations of Pc5 pulsations and particle flux oscillations with the same frequency at the same time interval strongly suggest that there were interactions between Pc5 ULF waves and energetic particles.
The second time interval (0850–1010 UT) [Fig. 3(b)] shows magnetic pulsations with a peak amplitude at 1.4 mHz at ZKY (L = 4.04, MLT = 16:11–17:31) located near dusk. Clear phase and amplitude change across the energy channels appear in the observed electron and proton flux modulations (see the dotted lines during interval (b) on LANL 1994- 084 flux data in Fig. 2 for a clear example). Both proton and electron flux modulation appeared at LANL 1994-084 (L = 6.8, MLT = 15:26–16:43), but only electron modulation appeared in LANL 1989-046 (L = 6.6, MLT = 21:31–22:48). LANL 1991-080 (L = 6.6, MLT = 09:06–10:23) also shows only electron oscillation at 1.4 mHz with small amplitude in the energy channels between 315 and 750 keV. The species and MLT dependence of modulation can be explained by the drift path of electron and proton as well as the location of satellites. A detailed explanation of the observed modulation will be presented in the discussion section.
The third time interval (1010–1130 UT) [Fig. 3(c)] is characterized by magnetic Pc5 waves with power spectra with a discrete peak at 1.2 mHz, e.g., ZYK (L = 4.04, MLT = 17:31–18:51) and CMO (L = 5.72, MLT = 22:59–00:19). Phase and amplitude changes across energy channels are clear in electron flux. Large amplitude electron flux modulation with 1.2 mHz frequency appeared in LANL 1994-084 (L = 6.8, MLT = 16:43–18:01) and LANL 1989-046 (L = 6.6, MLT = 22:48–00:06) while proton flux modulation didn’t appear at either satellite (see Fig. 3). On the other hand, LANL 1991- 080 which was located in the morning sector observed 1.2 mHz frequency electron flux oscillation at higher energy channels between 315 and 750 keV and 3.3 mHz electron flux oscillation at lower energy channels.
The fourth time interval (1130–1250 UT) [Fig. 3(d)] shows magnetic power spectra with a spectral peak at 1.7 mHz in KIL (L = 6.09, MLT = 08:48–10:08) station located in the post-noon sector. Electron flux modulation appeared in both LANL 1994-084 (L = 6.8, MLT = 18:01–19:22) and LANL 1989-046 (L = 6.6, MLT = 00:06–01:27) with the largest amplitude in the energy channel at around 500–750 keV. On the other hand, proton flux modulations appeared only in LANL 1994-084 with small amplitudes. Similar to the previous interval, LANL 1991-080 still observes 1.7 mHz electron flux oscillations at higher energy channels and 3.3 mHz oscillations at lower energy channels.
5. MODELING ENERGETIC PARTICLE DRIFT PATHS
Frequently, energetic particle flux modulations are not observed simultaneously at geosynchronous satellites at different local times (see Figs. 2 and 3). The reason might be related to the relative location of the ULF waves, their sources and the drift path of the electrons and protons. The bounce-averaged guiding center trajectories of charged particles in a dipole model of magnetosphere, including the effects of convection and co-rotation electric fields, can be written as
where and are the particle’s rate of change of azimuthal position (φ) and L with respect to time and (Hamlin et al. 1961;Chisham 1996;Ozeke & Mann 2001). The total electric potential is composed of the convection and the corotation electric potential, , and can be written as
Here the first term of equation (3) is the electric potential from convection, and the second term is the electric potential from corotation. φ is the azimuthal angle measured eastwards as positive at midnight (0o) and ψ0 can be expressed empirically as a function of Kp (Hamlin et al. 1961;Chisham 1996;Ozeke & Mann 2001).
We used these equations of guiding center motion to examine the energetic particle drift paths relative to the location of observed ULF waves. In our simulations, we used Kp = 8 and equatorial pitch angles of 90°. The effects of ULF wave interactions are excluded such that only unperturbed drift paths are shown. In the discussion section below, we used this model to explain the relationship between the observed ULF waves and enhanced particle flux modulations.
6. DISCUSSION
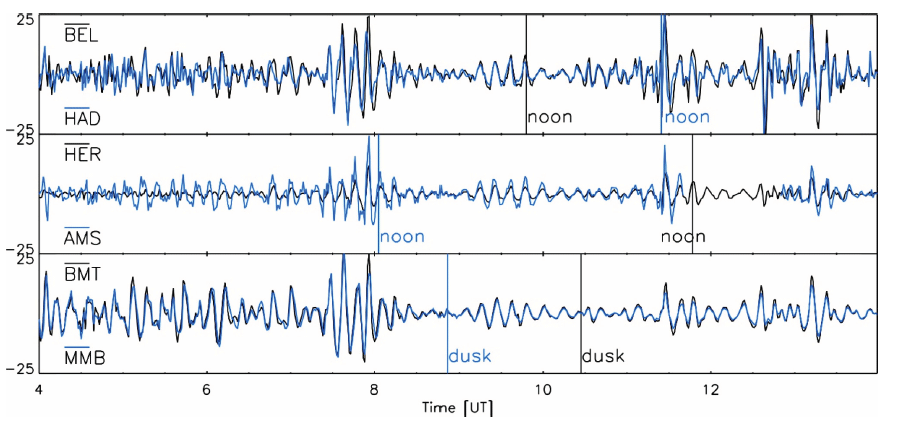
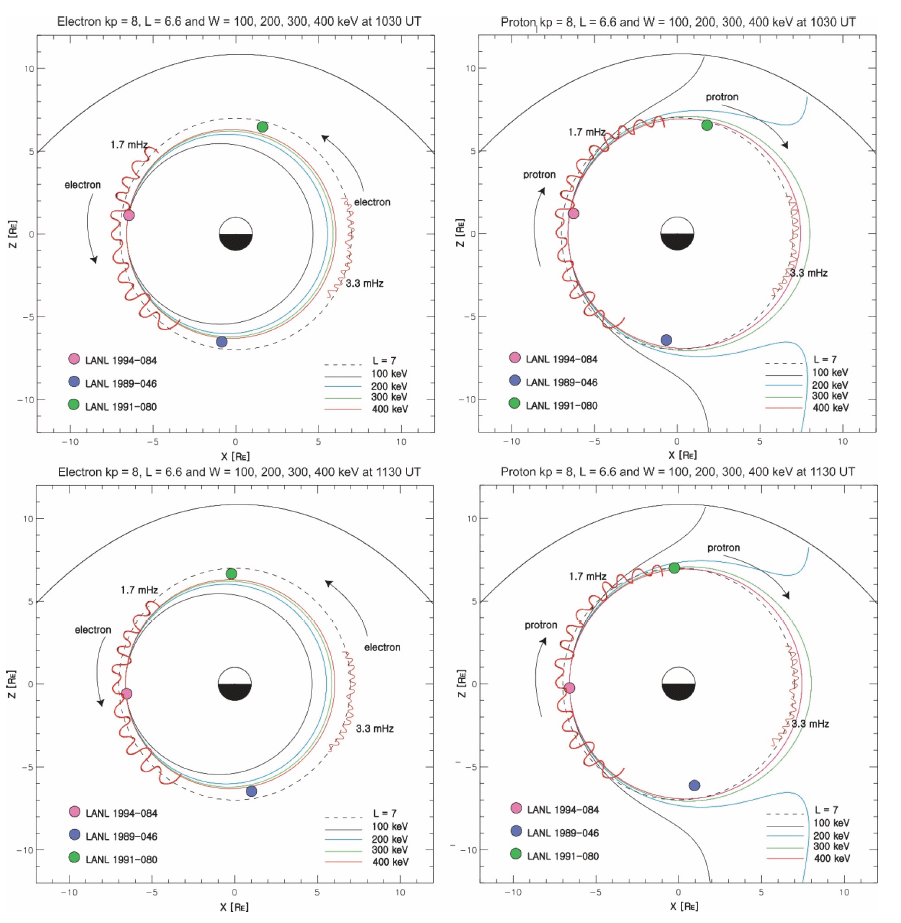
During storm time, Pc5 waves and particle interactions were examined. Azimuthal oscillations of field lines were observed in the ground-based magnetometers. Fig. 4 shows H-component magnetic fields observed in different local times with similar latitudes. From the top to bottom, the plot shows magnetic field H-components variations from BEL (47.52, 96.19) and HAD (47.69, 74.86), HER (–42.05, 82.6), AMS(–49.06, 138.84), and BMT (34.48, 188.71), MMB(37.05, 215.35) in CGM coordinate. As shown in Fig. 4, no clear phase delay appears between stations located at different longitudes but at similar latitudes. Francia et al. (2002) showed the solar wind pressure variations correspondence in the geomagnetic oscillation observed on July 16, 2000. The toroidal standing Alfven waves might be coupled to impulsive fast mode waves by solar wind dynamic pressure perturbation. If discrete azimuthally standing waves occur, produced by waves with the same amplitude and magnitude of azimuthal wave number (m) but opposite in sign, we might observe an azimuthal wave number of m ~0. Under these conditions where both westward and eastward phase propagating waves exist, we can explain the observed flux modulations of electrons and protons. Figs. 5 and 6 show the drift path of energetic electrons and protons with different energy. Electrons drift along closed orbital paths in all the energy channels but protons drift along open trajectories for low energies. This wave activity might relate to the wave phase propagation direction and the drift path of electrons and protons.
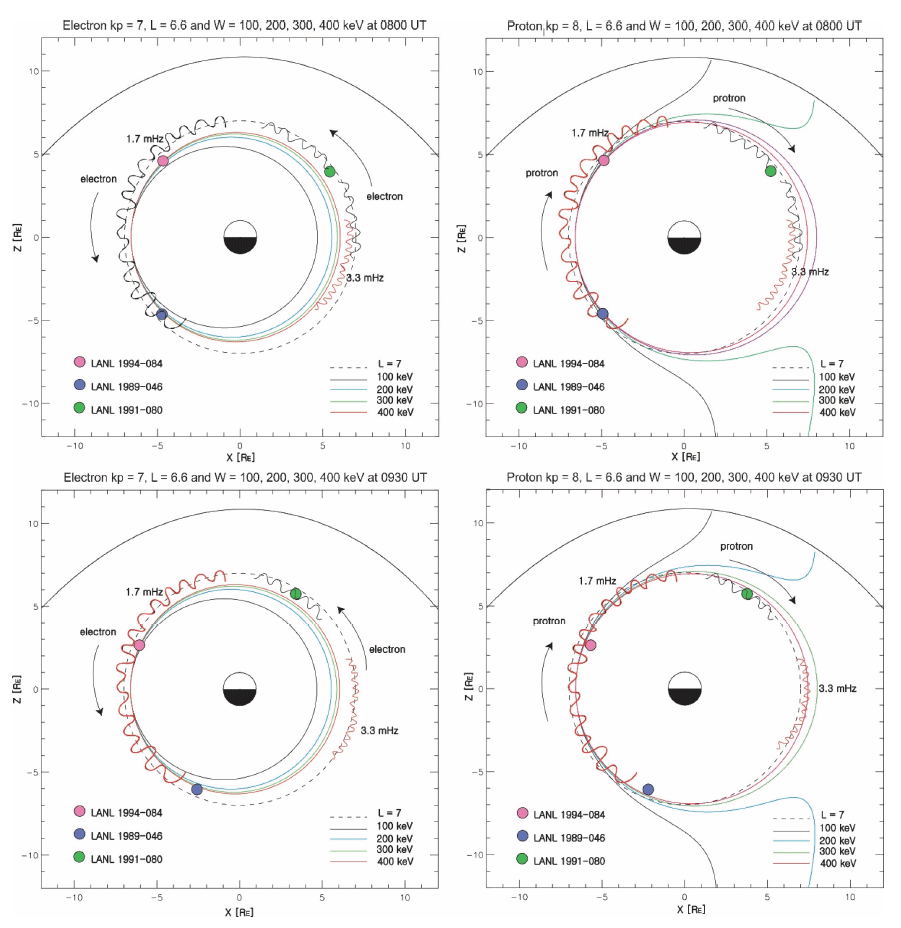
The top row of Fig. 5 shows the electron and proton drift paths. This figure shows the drift paths of energetic electrons and protons with different initial energy at 0800 UT (top) on 16th July 2000. Particles are launched with initial energies of 100 keV, 200 keV, 300 keV, and 400 keV at L = 6.6 and in the afternoon sector at 1800 LT and drift around a static dipole magnetic field model. In Fig. 5 top panel, the electrons drift on closed orbits but protons drift on open trajectories for the lower energies (100 and 200 keV). The location of the LANL geosynchronous satellites and the approximate MLT extent of the observed ULF waves are also shown. LANL 1994-094 was located around 1630 MLT and LANL 1989-046 was located near 2230 MLT at this time. 1.7 mHz ULF waves (black solid oscillation) were observed globally and 3.3 mHz waves (red solid oscillation) were observed in the dawn flank. The arrows indicate the drift directions of electrons (eastward) and protons (westward). During 0700–0820 UT, the ground-based magnetometers showed global waves of 1.7 mHz and modulations of energetic electron and proton flux were also observed in all three LANL satellites at the same frequency. As mentioned in section 4, there was no phase change between electrons and protons and between different energies. A possible explanation for this observed flux modulation might be the advection of an energetic particle density gradient across the satellites. If there is a gradient in the particle density in the direction of wave magnetic perturbations and the field line displacement, flux oscillation can result (e.g., Southwood 1973;Southwood & Kivelson 1981). In the case of advection, as indicated by the dotted line in Fig. 2, both energetic electron and proton flux oscillated in phase across all of the different energy channels.
In the morning sector, the ground-based magnetometers observed a 3.3 mHz frequency oscillation as well as a 1.7 mHz frequency oscillation (see Fig. 2, FAR station). LANL 1991-080, located in the morning sector, observed 1.7 mHz electron flux pulsations at higher energy channels and 3.3 mHz electron flux oscillations at lower energy channels. On the other hand, the proton flux only oscillated at 1.7 mHz. One possible explanation for this is that a westward traveling proton would be detected at the LANL 1991-080 satellite before the proton interacted with the 3.3 mHz wave oscillations further to the west (see Fig. 5, top panel). To observe the flux modulation at the satellite, the energetic particles must pass through the wave before they reach the satellite.
During 0850–1010 UT, 1.4 mHz ULF waves were observed on the ground near noon and in the afternoon sector from the ground-based magnetometers. Large amplitude waves were observed near dusk (cf. ZYK and CHD stations). At the same time, proton and electron modulations clearly appeared at LANL 1994-084 at 15:26–16:43 MLT while only electron flux modulation appeared at LANL 1989-046 at 21:31-22:48 MLT (see Fig. 2). During this second interval, typical resonance characteristics appear in the flux observations such as a phase change and amplitude peak across the resonant energy (315–500 keV for electrons and 175–250 keV for protons) (see Fig. 2). Thus, we suggest that both electrons and protons were modulated by a resonant interaction with Pc5 ULF waves. From the observations, the 1.4 mHz proton oscillation shows largest amplitude at energies of 175–250 keV at L = 6.6. For an electron moving eastward around the Earth, electrons could be modulated by poloidal mode ULF waves which have azimuthal electric field components. However in a compressed dipole, the toroidal mode can also accelerate electrons via drift-resonance interaction (Elkington et al. 1999;2003). The resonance condition for drift-resonant acceleration in a compressed dipole is
where ω, ωd and m represent wave frequency, drift frequency and azimuthal wave number, respectively. By solving equation 5, we can find out that the resonant azimuthal wave number (m) for this wave is around –3 (–solution) or –5 (+solution) for proton modulation. Electron flux modulation also has its largest amplitude near energies of 315–500 keV at L = 6.6 which gives a resonant azimuthal wave number around 3 or 1. If the ULF waves are standing in the azimuthal direction, these could have both positive and negative signs of azimuthal wave number (m) at the same time. If this is the case, then both electrons and protons could be resonant with the ULF waves at the same time. Thus, satellites can observe proton modulation arising from their interaction with westward traveling ULF waves and electron flux can be modulated by eastward traveling ULF waves. This means there should be waves propagating in both directions. We can find evidence of azimuthal standing waves, with components traveling both westward and eastward, in the magnetic field data observed by the ground-based magnetometers. Fig. 4 shows H-component magnetic fields observed at different local times with similar latitudes. From top to bottom, the panels in this plot show magnetic field H-component variations from BEL (CGM latitude 47.52, CGM longitude 96.19) and HAD (47.69, 74.86), HER (–42.05, 82.6) and AMS (–49.06, 138.84), and BMT (34.48, 188.71) and MMB (37.05, 215.35) in CGM coordinates. No clear phase delay appears between the stations located at different longitudes but at similar latitudes. Hence, we infer that there were both westward and eastward traveling waves creating an azimuthal standing wave as shown in Fig. 4. Under the condition of both westward and eastward traveling waves, creating an azimuthally standing mode structure, we suggest that the modulation of electrons and protons can both be observed simultaneously as seen here. The absence of proton modulation in LANL 1989-046 can be explained due to the relative location of the satellite with respect to the drift path of protons. Since the LANL 1989- 046 satellite is located on the eastern side of the ULF waves, the modulated protons will be observed after protons circle all around the Earth on their drift orbit. However, lower energy protons will drift on open trajectories as shown in the right panel of Fig. 5 (bottom panel), such that proton modulation at these energies will not be detected since the protons do not return to the satellite location. Also, since the drift paths are not symmetric and reach different distances from the Earth especially between dawn and dusk, there are chances protons modulated by waves will not be detected at satellites at fixed geosynchronous altitudes and which are located far from the source.
During 1010–1130 UT, ULF waves with 1.2 mHz frequency were observed in the afternoon sector with largest amplitude near the dusk flank (see Fig. 6, top panel). The locations of LANL 1994-084, LANL 1989-046 and LANL 1991-080 are 1720 MLT, 2330 MLT, and 1100 MLT at 1030 UT, respectively. Energetic electron flux modulation at the frequency of 1.2 mHz was seen in LANL 1994-084 and LANL 1989-046 very clearly, but no proton flux modulations were observed at either of these satellites. The reasons for the absence of proton modulations may be related to the wave propagation direction. ULF waves propagating eastward interact only with electrons not with protons in drift resonance. Also, the proton’s open drift trajectory may obstruct the return of modulated protons to the satellite location. Electron flux modulation observed at LANL 1994- 084 is much larger in amplitude than at LANL 1989-046. This might be due to a particle injection in the low energy channel being superposed on top of flux modulations for LANL 1994-084 satellites detector. Drift-resonant behavior was observed during this interval in the electron enhanced flux oscillation of 1.2 mHz with a frequency and maximum amplitude at energies of 105–225 keV at L = 6.6, such a wave would be resonated with the electrons if the wave had azimuthal wave number of m = 2 or m = 4 (m values were determined by solving equation (5)). Thus, we suggest that the electron flux modulation is due to a drift resonance with the Pc5 ULF waves.
During 1130–1250 UT, magnetic field perturbations of 1.7 mHz frequency were observed in the afternoon sector. The location of LANL 1994-084 and LANL 1989-046 were 1820 MLT and 0030 MLT at 1130 UT, respectively (see Fig. 6, bottom panel). Electron flux modulations were also observed at both satellites but more of larger amplitude at LANL 1994- 084 which was located closer to the wave source. Similar to the second interval [interval (b)], a proton flux modulation was detected only at LANL 1994-084. LANL 1994-084 may have observed a proton flux modulation as a result of the satellite being located in the center of the region of wave activity. In this case, the flux modulation can be explained using the same reasoning as discussed for the absence of proton modulation in the interval (b).
7. SUMMARY
We observed electron and proton modulation at the same frequency as ULF waves seen on the ground, indicating evidence for ULF wave-particle interactions, during the Bastille Day storm, 2000. However, the observations show a complex dependence on frequency, local time, particle energy, and particle species. Based on our observations, two explanations for the observed flux modulations are suggested: (1) Advection of an energetic particle density gradient (proton and electron show no change in phase with energy and similar amplitudes); (2) Energetic electron drift resonance (clear flux oscillations with amplitude and phase change across different energy channels). In general, there appears to be an absence of resonant proton flux modulations at the energies examined. This appears to be likely to be due to the wave propagation direction and the impacts of the open drift paths of the protons. Clear association between particle flux oscillation and Pc5 waves suggest that Pc5 ULF waves may play an important role in electron acceleration in the radiation belt.


