


1. INTRODUCTION
Active galactic nuclei (AGNs) are a special class of galaxies that show intense activities within their nuclei. This action is driven by the accretion of matter on the supermassive black hole (SMBH) (mass is between 106 –1010 Mʘ), that is surrounded by a cloudy torus of dusts (Rowan- Robinson 1977;Antonucci & Miller 1985). The SMBH is believed to contain enough amount of materials (up to 109 stars) inside its system, emitting at very high luminosity throughout the whole electromagnetic spectrum. This makes the morphological features complicated since these emissions occur at different frequencies and originate from several components and locations (Heckman & Best 2014) such as the ultra-relativistic jets, the cold and hot accretion discs for the low luminosity objects respectively (Kormendy & Ho 2013). AGNs show bimodality in the histogram distribution of radio-loudness factor R defined as
F5GHz is the radio flux at 5 GHz while FB is the flux at the optical band (Kellermann et al. 1989;Xu et al. 1999;Balokovic et al. 2012;Zhang et al. 2021). Seyfert galaxies are distinctive radio-quiet AGNs with bright, star-like nuclei. They have large and forbidden narrow emission lines with steep soft X-ray spectra and widespread optical flux variability at different ionization phases (Rakshit & Stalin 2017;Ojha et al. 2021). Their broad line region (BLR) as well as the accretion disc are very visible as obtained in other radio- loud AGNs due to the fact that their optical spectra consist of strong Fe II multiplets. They also have outstanding distinctive features like: high brightness temperature, dense radio cores, enlarged continuum emissions, flat X-ray and γ-ray spectra as well as fast, huge amplitude variability (Yuan et al. 2008;Abdo et al. 2009;Foschini 2017).
Seyfert galaxies are basically classified into two: the type 1 (Sy1) and type 2 (Sy2) Seyfert galaxies. This form of classification depends on whether there is presence and/or absence of emission lines in their optical spectra (Antonucci 1993;Urry & Padovani 1995). The optical spectra of Sy2 have a single set of narrow emission lines compared to the Sy1 type which have broad components. In addition, the line width of Sy2, described in form of full width at half-maximum (FWHM), is in the range of ~300 to 1,000 km/s, while that of Sy1 composed mainly of hydrogen and helium lines have FWHM > 1,000 km/s. Due to improved observations with telescopes of higher resolutions, it became clear that Seyfert galaxies have a wide range of values in the relative strength of both the broad and narrow emission lines. Consequently, this led to the modification of the classification of Seyfert galaxies by introducing the intermediate types (Osterbrock 1981;Osterbrock & Pogge 1985). Thus, the Seyfert galaxies varies from 1.0, 1.2, 1.5, up to 1.8 different types. Meanwhile, these subtypes do not have formal definition, instead, they indicate the degree to which the emission components are present.
Recent research is lending growing support to the hypothesis earlier proposed that the two classes of Seyfert galaxies are intrinsically of the same parent population (Antonucci 1993;Urry & Padovani 1995). The discrepancies among the diverse subgroups of AGNs have been remarkably explained by this popular unification paradigm. In the standard orientation-based unified scheme for Seyfert galaxies, the Sy2 are seen whenever the obscuring torus which is always dusty blocks the line of sight of an observer (it is called edge-on view), thereby, intercepting the direct observations of both the BLR and the accreting disc of the black hole. However, in Sy1, the BLR and accreting disc of the black hole are directly visible because the line of sight of the observer is further away from the dusty torus (pole-on view) (Antonucci & Miller 1985;Antonucci 1993). In the same way, many lines of evidence agree to the fact that Sy1 and Sy2 are similar objects though observed at different angles. For example, Sy1 and Sy2 have been reported to possess the same broad emission lines in the polarized infrared and optical spectrum (Moran et al. 2000). Moreso, the Sy1 have been detected to have silicate emission properties compared to the Sy2 type which have silicate absorption, a phenomenon that agrees with the interpretation of the properties of the obscuring torus (Gallimore et al. 2010). The distribution of the X-ray emissions of both Sy1 and Sy2 are found to be the same and no difference has been found in the mean ratio of farinfrared luminosities between the two Seyfert galaxy classes, implying that they have equal number of molecular gases (Mas-Hesse et al. 1994;Maiolino et al. 1997;Curran et al. 2000). In this paper, we test the prediction of the unification scheme by comparing common observed properties of Sy1 and Sy2 using radio, X-ray and γ-ray luminosities in order to see whether or not they are in agreement with the unification model. The theoretical concept of multiwave emissions of AGN subclasses and the description of our sample is given in Sections 2 and 3 while the results which comprise distributions of source parameters and correlations analysis are discussed in Section 4. The paper is discussed in section 5 and concluded in section 6.
2. THEORETICAL RELATIONSHIP
The observation of multi-wavelength emissions of AGN subclasses give the integral number of photon flux (in units of photons cm2/s). This multi-wavelength flux with spectral index α has been found to follow a power-law spectrum (Ghisellini et al. 1993;Singal 2015) which can be expressed as
here, N0 is the initial flux which can be obtained by integrating equation 1 to give
where EL – EU is the energy range from low to high wavebands. The N is the integral photon flux within the wavebands. The luminosity from radio to γ-ray bands is expressed as
where the dL is the luminosity distance of the source and Sv is the detected total flux density from the low energy radio (EL) up to the high energy (EU) γ-ray band. Hence, the multiwavelength luminosity of AGN subclasses can be accurately calculated if the photon spectral index within the energy range: EL – EU is accurately known. Therefore, we can test the unification of the Seyfert galaxies provided that there is available information on different wavebands.
3. DATA SAMPLE
We used the sample of Ackermann et al. (2012), containing 120 (43 Sy1 and 76 Sy2) hard X-ray selected Seyfert galaxies observed by the Femi-Large Area Telescope (Fermi-LAT). In this sample, all the intermediate subtypes of the Seyfert galaxy sample (1.0, 1.2, 1.5, 1.8, 1.9) with broad allowed emission line components in their optical spectra as classified into Sy1 whereas those ones that display narrow allowed emission lines only are grouped as Sy2. However, in order to fully test the consistency of unified scheme of Seyfert galaxies in multi-wavelength range, we calculated the γ-ray luminosity of our sample from the information published in Pei et al. (2020) using equation (4) with dL given as dz. For consistency with other previous works, we adopted the standard cold dark matter cosmology throughout the paper with the Hubble’s constant (H0) = 71.20 km/s /Mpc, Ωvacuum = 0.70, Ωmatter = 0.30, Λ0 = 0.70, q0 = − 0.55, and k = 0.00. All relevant data were adjusted based on this concordance cosmology. The Pearson Product Moment correlation coefficient was employed in statistical analysis and used to determine the amount of correlations between the properties of Sy1 and Sy2.
4. ANALYSIS AND RESULTS
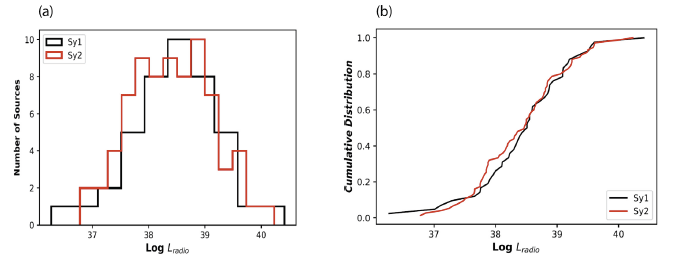
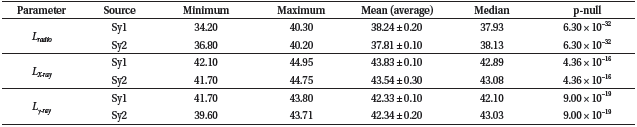
We compare the common properties of Sy1 and with Sy2 in the present sample to see the regularity of the prediction of the Seyfert galaxies’ unified scheme. Fig. 1(a) shows the distribution of Lradio of Sy1 and Sy2. The ranges are 34.20 to 40.30 with a single peak at 38.60 and an average value of 38.24 ± 0.07 and a median of 37.93 for Sy1 and from 36.80 to 40.20 peaking at 38.75 and an average and median values of 37.81 ± 0.10 and 38.13 respectively for Sy2. However, Sy1 and Sy2 are completely overlapped with up to a factor of 4. Thus, this implies that If the same mechanism/condition is responsible for the emission properties of Sy1 and Sy1 Seyfert galaxies, |the overlap in values of Lradio is indicative that they can be unified. To investigate this further, we performed a two-sample Kolmogorov Smirnov (K-S) test, on the distributions of Lradio in order to check the similarity of Sy1 and Sy2 populations. In a typical K-S test, assuming two datasets say, x1 and x2 shown by the cumulative distribution function (CDFs) f1(x) and f2(x) are obtained from similar distribution, x, the null hypothesis is only true if h = 0 or else, it is false for h = 1. The K-S test statistic, (K) is defined as the maximum value of one of the CDFs from the other part. The chance probability value (p-value) is used to determine if the result that is obtained is by chance or not. A small value of p or high value of K is a significant indication of obtaining the alternative hypothesis because the null hypothesis is not always consistent for a small value of p or high value of K. The value of p and K are in the range of 0 and 1. The value of p is accurate if where n1 and n2 are the number of elements in f1(x) and f2(x) respectively. Employing this technique to our sample, we obtained the ratio as 8.47, thus, making our value of p to be significant. The result of the K-S test obtained for the Lradio, is shown in Fig. 1(b) with K = 0.013 and p = 6.30 × 10⁻²⁹. Since the value of p is very small, the null hypothesis is rejected, implies that the Lradio in both samples arise from the same distributions, thus, Sy1 and Sy2 can be unified.
The distributions of LX-ray for Sy1 and Sy2 are displayed in the left upper panel in Fig. 2(b). The LX-ray spans from 42.10 to 44.95 with an average value of 43.83 ± 0.05 and a median of 42.89 for Sy1 and from 41.70 to 44.75 with an average value of 43.54 ± 0.30 and a median of 43.08 for Sy2. A K-S test done on the LX-ray data yields a chance probability 6.98 × 10⁻²⁹ and K = 0.035, which actually shows that at 5% significant level, there is no statistical difference between the underlying distributions of Sy1 and Sy2 in LX-ray: any observed difference could have arisen by chance. Thus, this extremely small p-value indicates that the two classes significantly come from the same parent population and thus can be unified.
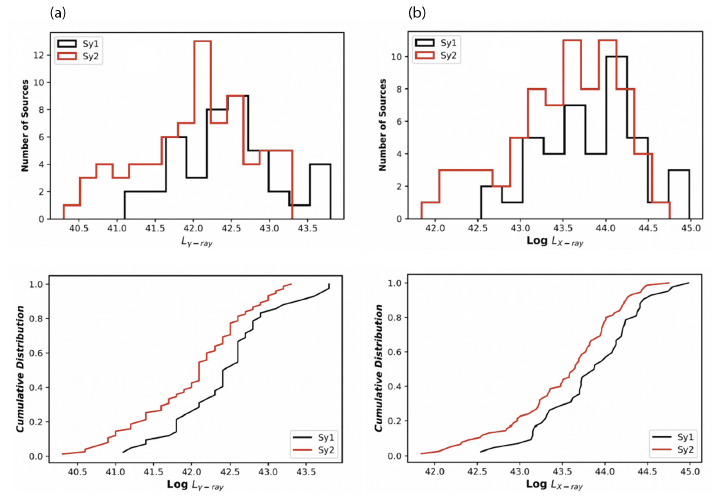
The upper right panel in Fig. 2(a) shows the distributions of Lγ–ray for our sample. Lγ–ray ranges from 41.70 to 43.80 with average and median values of 42.33 ± 0.10, 42.10 respectively for Sy1 and from 39.60 to 43.71 with average 42.34 ± 0.20 and median value of 43.03 for Sy2. Two sample K-S test yields a chance probability p = 9.00 × 10⁻⁹ and K = 0.22, for the Sy2 data, which implies that at 5% significance level, the distributions of Lγ–ray of Sy1 and Sy2 are statistically the same, with that of Sy2, on average, being systematically smaller than Sy1 galaxies. The CDF shown in Fig. 2(a) (lower panel). The statistical result of Lradio, LX-ray and Lγ-ray for Sy1 and Sy2 is shown in Table 1.
|
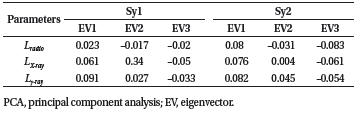
The principal component analysis is a statistical technique that can be used to reduce the dimensionality of datasets. This method has been successfully used in studying statistical analysis of AGN subclasses (e.g., Boroson & Green 1992;Boroson 2004;Xu et al. 2012;Wolf et al. 2020). The PCA converts observable parameters of these sources into different principal components that are orthogonal to each other. In our case here, PCA is useful to test for consistency of unififed scheme of our sample. The PCA components are known as Eigenvectors with the first Eigenvector (EV1) accounting for the maximum variance which is followed by the subsequent orthogonal Eigenvectors. We performed the PCA using Python’s sklearn6 package on the observed luminosities of our sample in order to understand the correlation in the context of unification scheme in the Eigenvector space. We performed individual PCA on Sy1 and Sy2 Seyfert galaxies and then jointly on the entire sample. The results of the PCA are shown in Table 2. From the table, it implies that emission at different wavebands for Sy1 and Sy2 galaxies may not differ significantly, thus, signifying that they are the same class of objects observed at different angles.
|
The correlations among source parameters in multiple bands and the association between Seyfert subtypes of Seyfert galaxies can be used to test the consistency of the unified model of AGNs. Here, we performed the correlation analysis on Sy1 and Sy1 samples and on combined basis. The Pearson’s regression equation expressed as y = (m ± Δm)x + (c ± Δc), with m being the slope while c is the intercept is used. We computed the correlation coefficients for all the common parameters of Sy1 and Sy2 using the expression given (Press et al. 1994) as
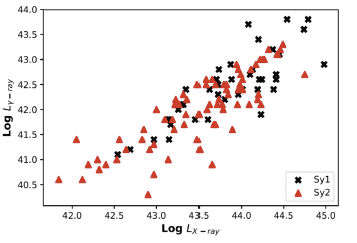
x and y are the average values of xi and yi . We show for the current Fermi-LAT sources, the scatter plot of Lγ-ray as a function of LX-ray on log – log scales in Fig. 3. Clearly, the Lγ-ray correlates positively with LX-ray for both classes of Seyfert galaxies, with Sy1 having a correlation coefficient of 0.64 while the Sy2 have a correlation coefficient of 0.52. When the cross-correlation is run on the entire sample, the correlation coefficient is 0.57 with equation of the form log Lγ-ray = (0.23 ± 0.15) log LX-ray + (42.37 ± 0.20). The significant correlations imply that similar effects are responsible for the proportionate variations in the intrinsic properties of Sy1 and Sy2, thus can be unified.
In addition, to check the level of agreement of the predictions of unification scheme of Seyfert galaxies, the scatter plots of Lradio as a function of Lγ-ray and LX-ray on logarithmic scales are shown in Figs. 4(a) and 4(b) respectively. For the Lradio – Lγ-ray data in Fig. 4(a), the Sy1 and Sy2 are mixed up in a sense that is consistent with a unified scheme. There is a clear positive correlation of Lradio – Lγ-ray data for each of the subtypes of Seyfert galaxies. Linear regression analyses yield correlation coefficients r = 0.57, 0.59, and 0.53 for Sy1, Sy2 and combined sample respectively. We interpret this to mean that similar processes give rise to the Lradio – Lγ-ray correlation in the different samples at intrinsically different scales.
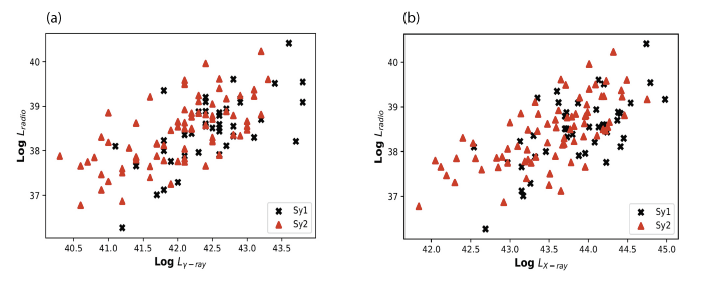
Equally, the Lradio is observed to correlate positively with LX-ray as shown in Fig. 4(b). It can be observed that the spread in Lγ-ray for different values of LX-ray is significantly the same for Sy1 and Sy2. Linear regression analysis of Lradio and LX-ray data gives Lradio = (0.64 ± 0.20) LX-ray + (1.83 ± 0.02) with a correlation coefficient (r ~ 0.60). The correlation is found to be statistically significant at 95% confidence level and suggests that similar effects are responsible for variations in the parameters for both Sy1 and Sy2.
5. DISCUSSION
The unified scheme of radio-quiet AGNs has been very effective in enlightening the variability of AGN properties on the basis of orientation with respect to the line of sight (Singh & Chand 2018), broadband emission properties (Iyida et al. 2021) and the viewing angles (Urry & Padovani 1995). This study has been topical in extragalactic astronomy in a couple of decades (Antonucci 1993;Urry & Padovani 1995;Padovani et al. 2017;Iyida et al. 2020, 2022). The main debate is directed to the development of a unified scheme aimed at bringing the large number of subsets under one roof. In the popular orientation-based unified scheme which is known generally for its simplicity, the observed properties of different classes of AGNs could be explained as similar objects seen at different orientation angles to the line of sight (Barthel 1989;Antonucci 1993). This makes that of predictions in terms of the luminosity of the two broad categories of the Seyfert galaxies, namely, Sy1 and Sy2 necessary.
To test the consistency of this prediction of the unified scheme of Seyfert galaxies, we compared the differences in properties of Sy1 and Sy2. This study is unique because since they emit at different wavelengths, it would give insights about their nature so as to know if they are actually the same class of objects. The traditional unification scheme suggests that the different types of AGNs are due to different observing angles relative to the torus. In particular, for the Seyfert galaxies, Sy1 are viewed from face-on to the accretion disk without obscuring, whereas Sy2 are viewed from edge-on and obscured by the torus. However, our results from (Figs. 1 and 2) indicate that radio, X-ray and γ-ray luminosity distributions of our sample show complete overlap with up to 4 orders of magnitude. This suggests that Sy1 and Sy2 have common emission mechanism in these wavebands, thus implying that they can be unified. This is in agreement with the unification scenario such that the multiwave emissions AGNs in Sy2 is viewed through the obscuring torus and making Sy2 to have lower emissions (between 2.0 – 10) keV compared to Sy1s provided that the obscuring column density is high enough (NH > 1022 cm−2). Our results have shown that Sy2 have similar observed emissions with Sy1 which is consistent with the prediction of the unification scheme.
The two sample K-S test shows that the two Seyfert subtypes of our sample have similar distributions in radio, X-ray and γ-ray luminosities. There are approximately zero chance probability, that the distributions of radio, X-ray and γ-ray luminosities of Sy1 and Sy2 are drawn from the same parent population. Our results are broadly in agreement with the previous studies (Antonucci 1993;Urry & Padovani 1995;Moran et al. 2000;Cappi et al. 2006) who proposed that the two classes of Seyfert galaxies are intrinsically the same objects but appear different only due to orientation. Also, the PCA results signify that the first three Eigenvectors describe no variance in both types of Seyfert galaxies. Thus, the observed parameters responsible for driving any variation in the Sy1 and Sy2 are the same, indicating that Sy1 and Sy2 occupy the same parameter space, thus, can be unified.
Furthermore, we obtained significant positive correlations between Lγ-ray – LX-ray, Lradio – Lγ-ray and Lradio – LX-ray, for Sy1 and Sy2 which indicates that they are similar. Using a sample of X-ray data of BL Lacs, Odo et al. (2012) obtained a similar result and argued that X-ray emission is directly linked to radio emission for AGNs subclasses. Therefore, the significant correlations obtained in our study indicate that these sources can be unified and this supports the unification model of Seyfert 1 and Seyfert 2 galaxies. If the Seyfert galaxies are merely due to different viewing angles relative to torus, different types of Seyferts should be independent of their host galaxies. Thus, in the unified scheme, since the torus is expected to be transparent to emission at radio, X-ray and γ-ray wavelengths, the compact features should be similarly visible in Sy1 and Sy2, therefore, can be unified.
6. CONCLUSION
We have tested the consistency of the unified scheme of a sample of Seyfert galaxies (type 1 and type 2) observed by Fermi-LAT. Our results on the statistical comparison of the common properties of Seyfert type 1s and type 2s are consistent with the Seyfert galaxies unification scheme. The distributions of radio, X-ray and γ-ray luminosities of Sy1 and Sy2 actually indicate that they can be unified as there is no obvious dichotomy between the two subtypes, implying that they are intrinsically the same class of objects that are observed differently. We obtained from the K.S. test results that the chance probability for Sy1 and Sy1 to come from the same population is p ~ 0 indicating that they are fundamentally the same class of objects. There are significant positive correlations (r ≥ 0.50) between Lγ-ray – LXray, Lradio – Lγ-ray and Lradio – LX-ray, for both Sy1 and Sy2 which plausibly show that the two subtypes of Seyfert galaxies can be unified.