1. INTRODUCTION
Saturn’s orbit has a volume (8.2713 × 10¹⁴ km3) comparable to a small planetary system. Its environment is wellknown for its complexity (Horner et al. 2020). This vast magnetosphere is divided by several zones and boundaries. The magnetosphere is made up of the cold plasma torus, inner magnetosphere (which contains the dynamic plasma sheet), and high-latitude magnetosphere, which has a magnetic field of 12–15 RS (André et al. 2005). Telescopic observations and in situ measurements of the plasma torus have revealed that the density, temperature, and composition of the plasma torus vary over time, sometimes by a factor of two. (Delamere & Bagenal 2003) There are two main features of the inner plasma ring: low temperature and high equatorial density at 8 Rs. In plasma, sputtered water group ions detach from ice satellite, ring, and proton surfaces, causing the area to couple with the ring system. Plasma is mostly generated by ice satellites. This area is lacking in high-energy electrons. The electrons, plasma waves, plasma ions, and neutral gases interact to cause this loss. An extensive plasma sheet can be found between 8 and 15 RS. The magnetic field data from the Cassini satellite’s magnetometer was used to study the water group ion cyclotron waves in Saturn’s magnetosphere. (Chou & Cheng 2017). Since the cold plasma composition is uniform throughout the magnetic layer, it shows that a mechanism is in place to rebalance all of the plasma in this region (Goertz 1983).
At low latitudes, Voyager 1 discovered irregularities in the plasma structure. Solar wind strength and Saturn’s biggest moon Titan influence this region’s structure (Eviatar et al. 1982). As opposed to cold plasma, which is restricted to the equatorial plane, hot plasma predominates in this region.
Whistler mode waves in the Earth’s ionosphere were first identified in the literature more than a century ago as electron cyclotron waves. The magnetosphere and plasmasphere of Earth are where scientists have found whistlers. Recent satellite missions, like as Cluster, Freja, and Polar, have discovered modulated whistler mode wave patterns that are linked to changes in density. Observations of whistler mode waves in the ionospheric density have been made during both natural and laboratory events. Wave particle interactions in circumterrestrial plasma can excite these waves. Gurnett et al. (1981) were the first to report on studies of Saturn’s plasma wave spectrum made by Voyager 1. Gurnett & Bhattacharjee (2005) presented data from Saturn’s approach and initial orbit for the first time in 2005 for “Cassini Radio and Plasma Wave Science Investigation.” Following its orbit entry in July 2004, Cassini saw Saturn’s magnetosphere for the first time. Using plasma data from Voyager 1 and 2, Richardson & Sittler (1990) were the first to show the ion electron densities in Saturn’s inner magnetosphere in two dimensions. Calculations have been done in Saturn’s magnetosphere like the ion total flux tube content, with the magnetic field model, we hope to study how electromagnetic electron cyclotron (EMEC) waves evolve in Saturn’s magnetosphere. Cassini’s magnetosphere measurements were used to derive the plasma’s characteristics.
Using the Cluster/STAFF instrument, Lacombe et al. (2014) have observed narrowband, right-handed, circularly polarized fluctuations, with wave vectors quasi-parallel to the mean magnetic field, superimposed on the spectrum of the permanent background turbulence. We interpret these coherent fluctuations as whistler mode waves.
Based on previous studies and efforts to done comprehend electron cyclotron waves in the magnetosphere, an attempt was made to analyze the influence of obliquely propagating EMEC oscillations in Saturn’s enormous magnetosphere on the growth rate. The primary goal of the study is to look at how EMEC waves are generated and what their effects are when different parameters are changed. The dispersion relation is incorporated into the study, which is presented in depth in the next part using the thorough formulation and mathematics employed.
2. Mathematical Formulation
Magnetic and electric fields should have the same z-direction in an anisotropic, collisionless, homogenous plasma system and magnitude and electric field . In the current circumstance, inhomogeneity in the interaction zone is expected to be minimal. The altered distribution function and particle trajectories associated with the dispersion relation are obtained using the Vlasov-Maxwell equations. Once the equilibrium and non-equilibrium components have been separated, higher order terms are removed.
The particle trajectories we estimated and, distribution functions, conductivity tensors, and dispersion relations using data from Annex & Pandey (2019) changed along with (equation 9):
The dielectric tensor is denoted by :
where
Terms notation of the above equation have been defined in Annex & Pandey (2019).
The general dispersion relation is used to describe the propagation of electromagnetic electron cyclotron waves, which reduces to ε11 ± iε12 = N2cos2θ, N2 being the refractive index which defined as .
For oblique propagation and order of Bessel function n = 1, the dispersion relation with parallel AC electric field is as follows:
The distribution function of trapped electrons can be described as Maxwellian ring, as Wu et al. (1989) and Kumar et al. (2007)
where s stands for species, and electrons and ions are considered in this example,
are the ions’ and electrons’ related parallel and perpendicular thermal velocities.
ns/n Equation (3) The electron-to-total density ratio, which is caught and defined by high energy, is depicted, whereas erfc(x) is the error function itself. Magnetic fields are used to describe v⊥ and v∥ the thermal velocities in perpendicular and parallel directions, respectively. The drift velocity is denoted by v0 in the mathematical expression.
Substituting and using expression (4) in equation (3) and after solving the integrations, we get the dispersion relation as:
To reduce above expression for electron-cyclotron range of frequencies, ion temperatures are assumed to be T⊥i = T∥i = Ti and |ωr + iγ| ≪ ωci while the electrons are assumed to have T⊥e > T∥e along with |k∥α∥e| ≪ |ωr ± ωce + iγ|.
So, following these approximations, equation (5) is reduced to:
where
We apply the condition and satisfying charge neutrality by Pandey & Kaur (2015) The dispersion relation is rewritten as:
The plasma dispersion function is defined as follows:
Now, the dimensionless parameter called as wave vector is introduced.
A more accurate representation of the true frequency and growth rate may be obtained when propagating electron cyclotron waves obliquely into the magnetic field:
The real part of eq. (8) is
3. PLA SMA PARAMETERS
During the Voyager flybys of Saturn’s inner magnetosphere, plasma wave discharges up to 10 RS in size and complexity were discovered. The magnetosphere of Saturn has revealed a plethora of plasma waves. According to Kurth & Gurnett (1991) and Zarka et al. (2004), Cassini discovered (Electron Cyclotron Harmonics) ECHs in the 1–8 RS region. The Voyager 1 was detecting electron number densities and energetic hot-and-cold distributions distance between the radial distance 6 and 18 Rs. Over the same radial distance, the magnetic field strength varied from 80 to 4.4 nT (Sittler et al. 1983). Inner plasma torus parameters we calculated at radial distance 7 Rs to 5.5 Rs, B0 = 100 nT, no = 14 × 106 m–3, KbT∥ = 20 eV (Akalin et al. 2006;Thomsen et al. 2010).In addition, the equation used to calculate the magnetic field intensity along magnetic field lines at any position:
Where λ is latitude and B0 is the magnetic field at the equator, evaluated by using the measured magnetic field at spacecraft.
4. RESULT AND DISCUSSION
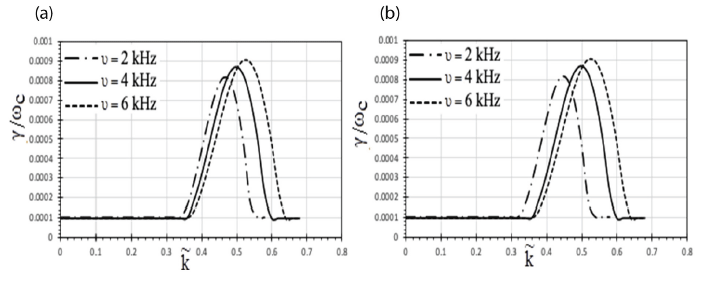
The dimensionless grow rate of EMEC waves changes with wave number () for various A.C frequency values, as shown in Figs. 1(a) and 1(b).

Plots were drawn at a radial distance of 5.5 Rs for two separate scenarios: without a model of magnetic field and with a magnetic field model. Fig. 1(a) has been plotted for without any model. For this case, maxima of growth rate lies at = 0.46 with γ / ωc = 8.1 × 10⁻³ for ν = 2 kHz and maxima shifts to = 0.5 for ν = 4 kHz with γ / ωc = 8.6 × 10⁻³. Peak value of growth rate lies at = 0.52 with γ / ωc = 9.1 × 10⁻³ for ν = 6 kHz. For Fig. 1(b), magnetic field model has been incorporated which is as discussed in previous section. Graph show that maximum growth rate occurs at = 0.44 with γ / ωc = 8.2 × 10⁻³ for ν = 2 kHz, and at and maxima shifts to = 0.5 for ν = 4 kHz with γ / ωc = 8.8 × 10⁻³. Peak value of growth rate lies at = 0.55 with γ / ωc = 9.3 × 10⁻³ for ν = 6 kHz. As the value of A.C. frequency grows, the growth rate increases. With the magnetic field model included for research, but for lower A.C. frequencies, we can see that the spectrum moves to a lower wave number [compare Figs. 1(a) and 1(b)]. As shown in the graphs above, the alternating current frequency activates electromagnetic electron cyclotron waves in the inner plasma torus, which expand at a faster pace as the frequency rises. An electromagnetic electron cyclotron wave growth rate normalized in a parallel AC field was employed by Pandey & Kaur (2015) to construct their graphs.
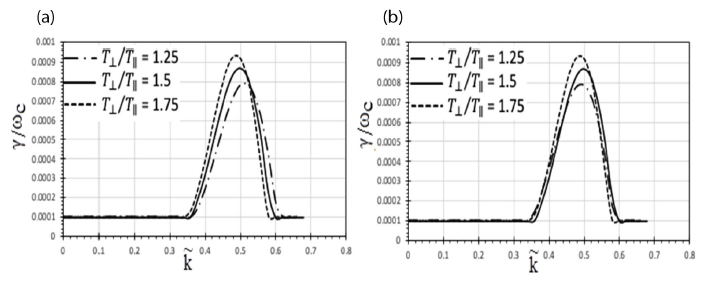
Figs. 2(a) and 2(b) shows the variation of dimensionless growth rate of EMEC waves with wave number () for different value of T⊥ / T∥. From perpendicular to parallel, the thermal energy ratios are changed T⊥ / T∥ – 1 = AT. The effect of temperature anisotropy (AT) on the parallel energy ratio was investigated. Graphs have been displayed for the magnetic field model and non-magnetic field propagation in the oblique direction of the magnetic field at a radial distance of 5.5 RS. In Fig. 2(a), the maxima of growth rate fall about = 0.5 with for T⊥ / T∥ = 1.25, 1.5, and 1.75 at γ / ωc = 8 × 10⁻³, 8.75 × 10⁻³, and 9.3 × 10⁻³ respectively. The growth maxima are different at this point for all the T⊥ / T∥ values and maxim shifts to = 0.52 for T⊥ / T∥ = 1.25 and = 0.48 for T⊥ / T∥ = 1.75 Fig. 2(b), similar growth patterns are observed, but the maxima for T⊥ / T∥ comes before = 0.5. For Fig. 2(b), In this figure, the magnetic field dependence on latitude has been employed in calculations. The maximum is shown by the growth rate at = 0.5 with γ / ωc = 7.9 × 10⁻³ for T⊥ / T∥ =1.25, = 0.5 with γ / ωc = 8.6 × 10⁻³ for T⊥ / T∥ =1.5 and at = 0.48 with γ / ωc = 9.4 × 10⁻³ for T⊥ / T∥ = 1.75.

Since the value of growth rate rises with increasing temperature anisotropy T⊥ / T∥ (in both cases and at 5.5 radial distance), the growth rate rises as well. According to this comparison, the bandwidth of the growth rate has shrunk and the spectrum has shifted to a higher wave number for the value T⊥ / T∥ = 1.25, which has been used in research. For EMEC waves in the Earth’s plasma pause zone, similar outcomes were found by Ahirwar (2012).
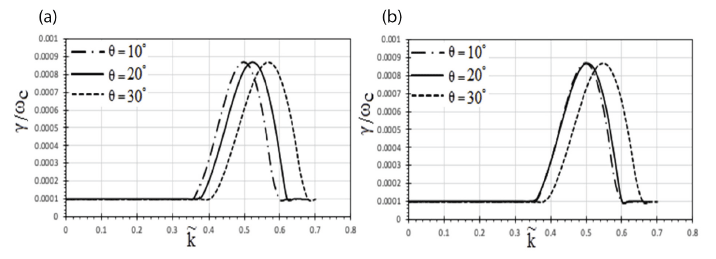
Figs. 3(a) and 3(b) show how the dimensionless growth rate of EMEC waves varies with wave number () for various propagation angles with respect to the planet’s magnetic field. The maximum for the scenario where no model has been examined are in the range of γ / ωc = 8.6 × 10⁻³ to 8.7 × 10⁻³ for = 0.5 to 0.56. The maximum growth rate is nearly the same when the effect of the magnetic field model is incorporated when the angle of propagation advances to 30°. In Fig. 3(b), the growth rate peak coincides at same = 0.5 for angle of propagation of 10° and 20°. As the graphs show, changing the propagation angle has little to no impact on wave growth. Due to the magnetic field model’s effect, the wave can only develop at one particular wavenumber. When the wave normal angle is increased from 10° to 30°, the growth rate also increases. Above 40°, electrostatic components take the place of electromagnetic components, and non-resonant instability kicks in.

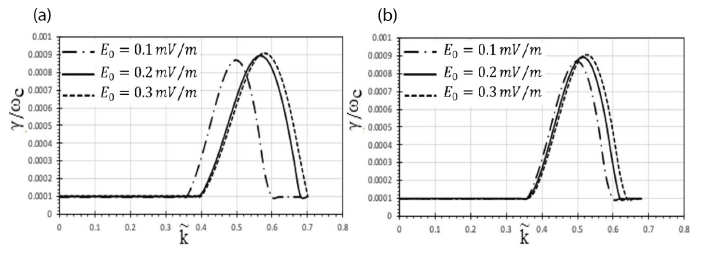
Figs. 4(a) and 4(b) show how the dimensionless development rate of EMEC waves which varies with wave number () for different electric field magnitudes. (E0).

Fig. 4(a) demonstrates how the EMEC wave’s maximum growth rate fluctuates with the electric field’s intensity vs. the number of waves. Wave growth increases as the electric field strength increases, as shown in the diagram. For E0 = 0.3 mV/m, maxima γ / ωc = 9.1 × 10⁻³ occurs at = 0.58, showing maximum growth. For E0 = 0.2 mV/m, γ / ωc = 8.9 × 10⁻³ maxima appears at = 0.57 and for E0 = 0.1 mV/m, the growth rate peaks at 8.6 × 10⁻³ in oblique propagation case shifted to = 0.5. Modeling the impact of the magnetosphere’s EMEC wave growth using a magnetic field model is shown in Fig. 4(b). On comparing two, it is observed that the growth rates are similar, but the apex sites differ slightly. Because maximal growth rates are influenced by electric field intensity, particles may oscillate at different frequencies and absorb energy to grow waves. Kumari & Pandey (2019).
5. CONCLUSION
According to this article, Saturn’s inner plasma torus has high growth rates of electron cyclotron waves. A mathematical model based on the ring distribution function could yield growth rate expressions derived to the dispersion relation. Instability in the magnetosphere can be studied using this technique. These charts demonstrate that in Saturn’s magnetosphere, temperature anisotropy serves as a free energy source. Increases in the electric field’s amplitude and alternating current (AC) frequency hasten the creation of electron cyclotron waves. The loss of perpendicular kinetic energy has increased the magnitude of electromagnetic electron cyclotron waves. There is no doubt that raising the magnetic field model’s dimensionless growth rate has an impact on parameters with lower values of the magnetic field. In case of the magnetic model, the growth rate increases marginally as compare to without the magnetic model, but the band width has been increased in case of a magnetic field model, it means the spectrum covers a wide frequency range. Saturnian magnetosphere VLF (very low frequency) emissions may now be studied across a wider frequency range because of the shift in wave number. This research could be used to understand more about Saturn’s outer radiation belt, whistler mode wave expansion, and other spatial plasmas. EMEC wave studies at higher latitudes, which are thought to be linked to critical high-temperature anisotropies, can be extended to examine pitch angle scattering mechanisms changing plasma characteristics and local loss processes in the inner magnetosphere, which are other ideas we propose for future work in this area.


