1. INTRODUCTION
Recently, considerable attention has been focused on the origin and global distribution of magnetosonic waves (also known as equatorial noise) owing to their potential role in scattering radiation belt electrons, as first suggested by Horne et al. (2007). However, it remains controversial whether the magnetosonic waves can scatter radiation belt electrons as effectively as the whistler-mode chorus (Shprits et al. 2013;Ma et al. 2013, 2016). These waves can also scatter ring current protons (Xiao et al. 2014;Fu et al. 2016;Yu et al. 2019). This paper will only focus on their contribution to electron scatterings. Magnetosonic waves identified between the local proton cyclotron frequency (fcp) and the local lower hybrid resonance frequency (fLHR) are usually distributed within a few degrees of magnetic latitude both inside and outside the plasmasphere (Russell et al. 1970;Laakso et al. 1990;Kasahara et al. 1994;Santolík et al. 2002;Meredith et al. 2008;Ma et al. 2013;Hrbáčková et al. 2015;Kim & Chen 2016;Kim & Shprits 2017, 2018). Previous studies have presented the distribution of magnetosonic waves separately in two regions: high-density plasmasphere and low-density plasmatrough. The dominant energies and pitch angles that magnetosonic waves can scatter can be changed depending on whether they occur inside or outside the high-density region. For example, Horne et al. (2007) suggested that magnetosonic waves can effectively accelerate relativistic electrons outside the plasmasphere but not inside the plasmasphere. In contrast, relatively low energies of approximately a few tens of keV experience a more dominant acceleration inside the plasmasphere. More precisely, such differences are mainly due to the ambient plasma environment, namely, the ratio of plasma frequency (fpe) to the electron cyclotron frequency (fce) on regions experiencing magnetosonic waves. This is because fpe can change the resonant pitch angle and energy of electrons with waves (see Fig. 2 in Horne et al. 2007). Therefore, determining exactly what fpe/fce collocates with the wave enables the accurate evaluation of electron scattering by magnetosonic waves.
Most previous studies first identified the plasmapause location to divide the wave distribution into two regions (Meredith et al. 2008;Ma et al. 2013, 2016;Kim & Chen 2016;Kim & Shprits 2017, 2018;Yuan et al. 2019). However, a spacecraft can detect magnetosonic waves continuously present in two regions while traversing them (an example is herein shown in Fig. 1). In such a case, the wave distribution near the plasmapause can be inferred differently depending on the criteria for identifying the plasmapause location. Information on the criteria can be found in Cho et al. (2015), Li et al. (2015), and Kim & Chen (2016). Furthermore, even at a distance far from the plasmapause, the occurrence rate of the magnetosonic waves, especially outside the plasmapause, may include waves in the plasmaspheric plume. Therefore, identifying the locations of the plasmapause and plume is critical for estimating the magnetosonic wave distribution. If we present the distribution of magnetosonic waves with the ambient fpe/fce ratio, the procedure of artificially dividing the two regions for magnetosonic wave identification is no longer required. This approach can also reduce the misinterpretation of the location of occurrence of magnetosonic waves.
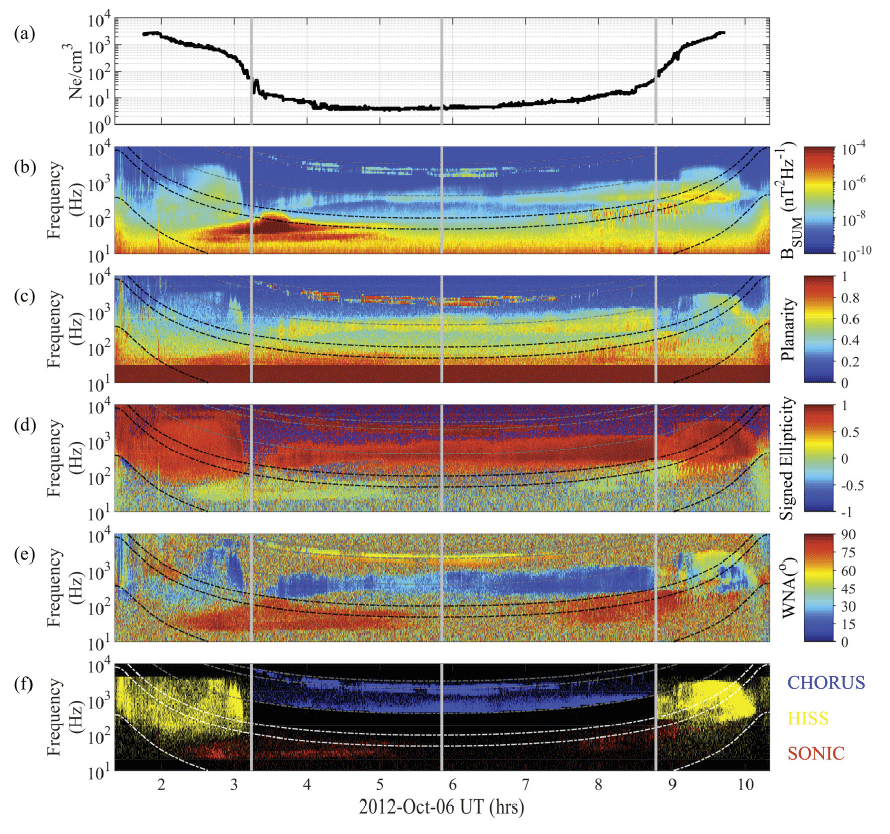
The primary purpose of this study was to develop an empirical model of the global distribution of magnetosonic waves. Unlike previous studies, we did not separate the wave distribution into two regions according to the plasmapause. Instead, the distribution was determined with a ratio of fpe/ fce. Because magnetosonic waves are mainly distributed near the magnetic equator, the twin Van Allen Probes, designed to operate in near-equatorial elliptical orbits launched in August 2012, may be suitable for a complete survey of magnetosonic waves. Under the assumption of a dipole magnetic field, the lowest (fcp) and highest (fLHR) frequencies of the magnetosonic wave band on the equator correspond to ~60 Hz and ~2,500 Hz at 2 RE and ~2 Hz and ~90 Hz at 6 RE. The Electric and Magnetic Field Instrument and Integrated Science (EMFISIS) onboard the Van Allen Probes provides wave spectral densities covering the frequency range of 10 Hz to 400 kHz. Thus, it can provide a global distribution of magnetosonic waves of less than 6 RE. In this study, we express the wave distribution as a function of L*, magnetic local time (MLT), magnetic latitude (λ), and geomagnetic activity. This study adopted the L* derived using the Tsyganenko TS04D model (Tsyganenko & Sitnov 2005) as a radial distance measure. L* indicates the radial distance to the equatorial crossing points of the drift shell on which a particle bounces and drifts, conserving all three adiabatic invariants under the Earth’s dipole magnetic field when ignoring all types of external magnetospheric currents. Therefore, by expressing the wave distribution in terms of L*, we can easily estimate the contribution of magnetosonic waves to particle scattering on the particle drift path. The ephemeris data for Van Allen Probes are available at https://rbsp-ect.lanl.gov/data_pub.
The remainder of this paper is organized as follows. We first statistically provide the global distribution of the wave amplitude and wave normal angle of the magnetosonic waves, as well as fpe/fce using Van Allen Probe A and B observations in Section 2. We then develop an empirical model based on the statistical distribution in Section 3. The conclusions are presented in Section 4.
2. GLOBAL DISTRIBUTION OF MAGNETOSONIC WAVE AND AMBIENT fpe/fce RATIO
In this section, we statistically provide the global distribution of magnetosonic waves as well as the fpe/fce ratio derived from observations from Van Allen Probes A and B. Fig. 1 shows an example of the magnetosonic wave signals observed by Van Allen Probe A on October 6, 2012. From top to bottom are the plasma number density, inferred from the upper hybrid resonance frequency measured by the EMFISIS High-Frequency Receiver (HFR) (Kurth et al. 2015) (Fig. 1(a)); the magnetic field wave spectra from the EMFISIS Waveform Receiver (WFR) (Fig. 1(b)); the planarity (closer to 1 means that the waves are polarized nearly in a single plane) (Fig. 1(c)); and the signed ellipticity (negative for left-handed polarized waves, positive for right-handed polarized waves, and near-zero for linearly polarized waves) (Fig. 1(d)). Additionally represented are the wave normal angle (WNA) (Fig. 1(e)), and the wave flag (blue for the whistler-mode chorus, yellow for the plasmaspheric hiss, and red for the magnetosonic wave) (Fig. 1(f)). The vertical lines at both ends and the center represent the plasmapause location for each half orbit and apogee passage, respectively. The plasmapause is determined as the innermost L* at which the plasma number density measured as in Fig. 1(a) intersects at a higher value between 10 × (6.6 / L*)4 and 50 / cm3 (Li et al. 2015). If the measured plasma density is higher than the comparative value, the spacecraft is inside the plasmasphere; otherwise, it is outside the plasmasphere. Furthermore, curves related to frequencies to capture various magnetospheric waves are shown in Figs. 1(b)–1(f). The top to bottom curves correspond to 0.8fce, 0.5fce, 0.1fce, 1.0fLHR, 0.5fLHR, and fcp. These are estimated using the following relations:
where e is the electric charge (1.6022 × 10⁻¹⁹ C), me is the electron rest mass (9.1094 × 10⁻³¹ kg), mp is the proton rest mass (1.6726 × 10⁻²⁷ kg), fce is the electron cyclotron frequency, and B is the background magnetic field (in Tesla) obtained from the EMFISIS fluxgate magnetometer. We used a singular value decomposition technique to estimate the wave propagation parameters (Santolík et al. 2003) and identified the magnetosonic waves as signals between local fcp and fLHR with a wave normal angle ≥ 80° and an absolute ellipticity of ≤ 0.2 (Li et al. 2015). Other types of waves—plasmaspheric hiss inside the plasmapause in a frequency range of 20 Hz–4 kHz with ellipticity of > 0.7 and planarity of > 0.2, as well as whistler-mode chorus outside the plasmapause in a frequency range of 0.1fce – 0.8fce with ellipticity of > 0.7 and planarity of > 0.2 (Li et al. 2015)— were identified and excluded. Fig. 1(f ) shows that the magnetosonic wave event occurs across both sides of the plasmapause. In this case, depending on the technique used to determine the plasmapause, the wave distribution near the plasmapause may be different.
Based on the criteria above, we surveyed the magnetosonic waves during the entire mission period using Van Allen Probes A and B (October 2012–October 2019 for Van Allen Probe A, and October 2012–July 2019 for Van Allen Probe B). The root-mean-square amplitude (Bw) of the magnetosonic waves was estimated by integrating the wave power spectral density (BPSD) over the frequency range of fcp – fLHR. Wave power-average WNAi at each time i was weighted by the wave power and estimated using the following relation:
Figs. 2(a)–(d) (top row) show the occurrence rates of wave detections normalized to the spacecraft dwell time in each bin of 0.5 L* × 1° λ for different MLT zones with an interval of 6 h. The dwell time is counted only when the EMFISIS WFR data are available, as some data may not be available even if the spacecraft is in operation. It is displayed in the small insert in the upper-left corner of each panel. Note that, owing to the trajectory of the Van Allen Probes, WFR data are available up to L* = 6 and |λ| = 20°. Some noise was reported in the vicinity of the perigee (Yuan et al. 2019), and we ignored data in the regions of less than 2 RE in our database. It can be observed that waves are frequently evident within λ ~5°. The maximum detection occurs near the post-noon (12–18 MLT) sector, consistent with the region where the proton ring distribution, known as a source of magnetosonic waves, favorably occurs (e.g., Kim & Shprits 2018). Meanwhile, the post-midnight (0–6 MLT) sector shows a relatively low occurrence compared to other MLT sectors. To better understand the MLT distribution, we also provide Figs. 2(e)–(n) (middle and bottom rows) showing the L*- MLT distribution in each bin (0.5 L* × 0.5 h) for different latitudinal zones at one-degree intervals. The corresponding dwell time of each bin is shown in the inset of each panel. Within ~5° of latitude from the equator, one can confirm the apparent asymmetry in the MLT distribution, that is, the higher occurrence on the dayside than on the nightside; the maximum is near the post-noon (12–18 MLT) sector and the minimum is near the post-midnight (0–6 MLT) sector. This finding is qualitatively consistent with those of previous studies (Hrbáčková et al. 2015;Kim & Shprits 2017, 2018).
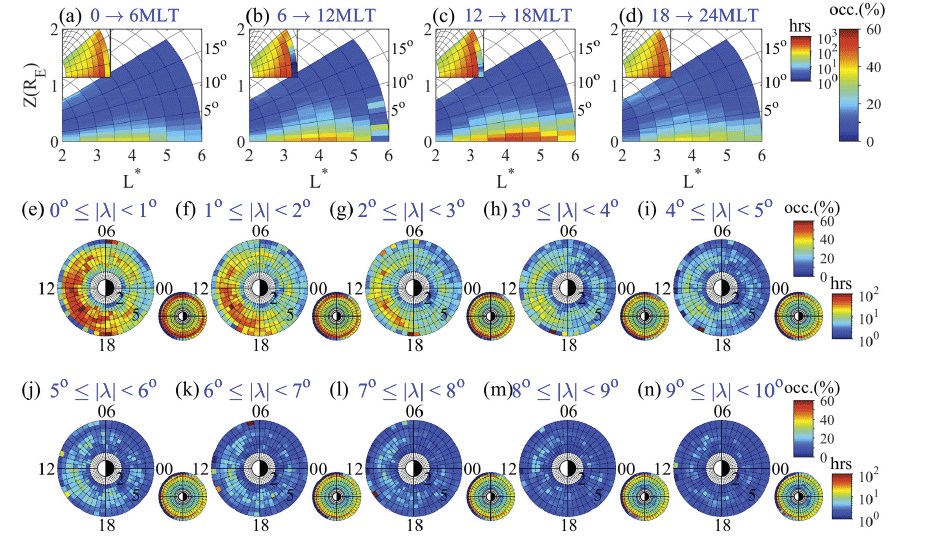
Fig. 3 shows the average distribution of the wave amplitude and wave normal angle in L*-MLT bins for the two latitudinal zones—the equatorial region (|λ| ≤ 5°), and the non-equatorial region (|λ| > 5°)—in terms of the Kp index. The corresponding sampling distributions are displayed in the small insets of each panel. We adopted the Kp index as an indicator of geomagnetic activity to easily apply the results to the diffusion model, which is widely used in our community to understand the role of wave–particle interactions in distributing magnetospheric particles (e.g., Shprits et al. 2009;Glauert et al. 2014). For the near-equatorial distribution of wave amplitude (Figs. 3(a)– (e)), it can be observed that, with increasing Kp, the dayside amplitude significantly increases, expanding the intense reddish region azimuthally from the post-noon (12–18 MLT) sector and radially toward the inner regions from L* ≥ 4. For Kp > 4, the amplitude reaches > 100 pT. The non-equatorial distribution shown in the third rows (Figs. 3(k)–(o)) also depicts a similar behavior to that of the equatorial region. However, the amplitudes are relatively low compared to those in the equatorial region. In both latitudinal zones, the lowest amplitudes are observed in the 0–6 MLT sector.
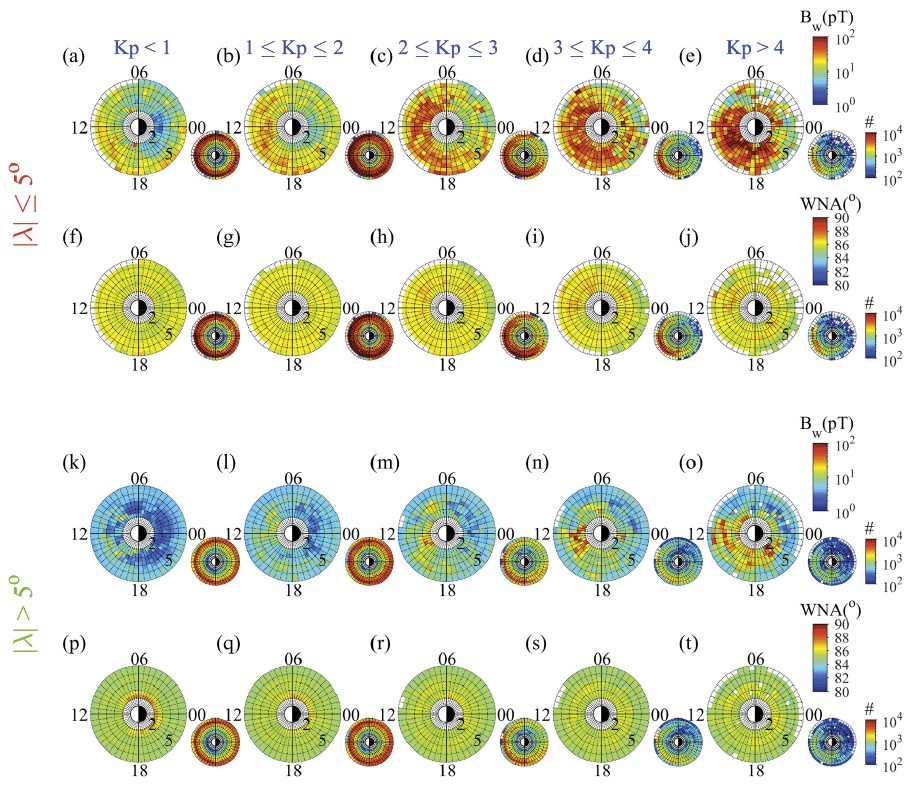
In this study, we do not separate the occurrence region of waves according to whether the spacecraft resides inside the plasmapause. As in previous studies, if we consider the distribution according to the plasmapause location, we can understand the propagation feature in this way. Plasmapause shrinks for higher Kp; thus, one can ascertain that the peak amplitude that appears in the post-noon sector for L* < 4 for Kp > 4 (Fig. 3(e)) may occur inside the plasmapause. On the other hand, with respect to the enhanced waves that appear on the dayside for L* > 4 for all geomagnetic activities, they may include waves inside and outside the plasmapause depending on the Kp intensity. This is because the plasmapause expands for lower Kp outward to higher L*; thus, the region of L* > 4 could be inside the plasmapause, and vice versa for higher Kp. This explanation is consistent with the findings of Kim & Shprits (2018), who presented wave amplitude distributions separately inside and outside the plasmasphere. Their results showed intense magnetosonic waves on the dayside (6–18 MLT) outside the plasmapause and in the post-noon (12–18 MLT) sectors inside the plasmapause.
Meanwhile, the WNA distribution for all MLTs in the equatorial region increased slightly. A day–night asymmetry became more pronounced for stronger Kp, that is, higher WNA was distributed on the dayside than on the nightside. The ranges of variation in WNA were within a few degrees. A similar feature is observed in the non-equatorial distribution shown in the bottom row of Figs. 3(p)–(t), albeit with a relatively low WNA. Based on a diffusion coefficient calculation, Lei et al. (2017) presented that even small changes in the WNA significantly change the energy and pitch angle of electrons to be scattered by magnetosonic waves.
Even if the wave amplitude and wave normal angle are distributed adequately for effectively scattering the magnetospheric particles, waves can behave differently depending on the ambient plasma environment fpe/fce ratio, as noted in the Introduction. In Fig. 4, we present the L*- MLT distribution of the average fpe/fce ratio as a function of the Kp index for two different latitudinal zones. The plasma frequency fpe (Hz) is estimated as
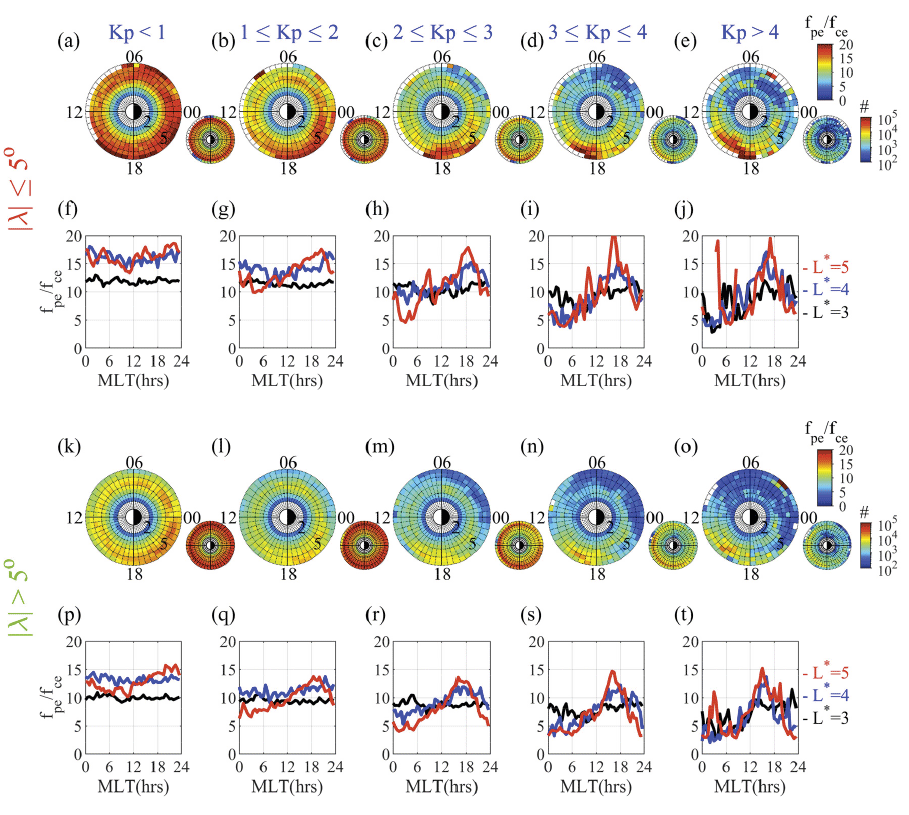
where ε0 is the vacuum permittivity (8.854 × 10⁻¹² F∙m–1), ne is the electron number density (cm–3) derived from the EMFISIS HFR, as shown in Fig. 1(a) (Kurth et al. 2015). Multiplication by 106 is applied to the numerator to convert the units of ne entered as cm–3 to m–3. The bin size of L* and MLT is 0.5 L* × 0.5 h. For a more precise understanding, the second and fourth rows show fpe/fce values at a given L* value, that is, 3, 4, and 5 against MLT derived from the first and third rows. One can observe that, for the equatorial region, with an increasing Kp index, the region of relatively high fpe/fce > ~10 is reduced, and the maximum region of fpe/fce rotates from the pre-midnight to post-noon sector, which is interpreted as the development and motion of plasmaspheric plume during the enhanced activity (Moldwin et al. 2004;Darrouzet et al. 2008;Usanova et al. 2013;Goldstein et al. 2014). In the second row, one can confirm a pronounced peak of fpe/fce around the postnoon sector at a higher L* with increasing Kp. The fpe/ fce distribution is mainly governed by the plasma density distribution rather than the B-intensity distribution, as the B-intensity distribution in the region of L* < 6 is close to the dipole approximation and thus has a symmetrical distribution on the MLT (not shown). The same is applied to the non-equatorial region; however, fpe/fce at the same L*-MLT bin is relatively low. This is because, as the latitude increases, fpe decreases on account of a smaller ne while fce increases owing to a larger B intensity.
3. MAGNETOSONIC WAVE AND fpe/fce RATIO MODELING
In this section, we provide the modeling results of amplitude Bw and the WNA of the magnetosonic waves as well as the fpe/fce ratio. For modeling of the desired parameters, we use the following function form, introduced by Wang et al. (2019):
It consists of two parts: (1) f depending on MLT, L*, and |λ|, and (2) g depending on the Kp index. The model output is one of Bw, WNA, and fpe/fce, which depends on MLT, L*, |λ|, and Kp. We apply a least-squares method separately for each part to fit the measurements for any of the three parameters to the function form. The fitting procedure is as follows (the general processes are similar to those of Wang et al. 2019; however our chosen grid size and g function are slightly different). First, we bin all the measurements for any desired output into 6 h × 1° × 1 intervals of MLT × |λ| × L*, and calculate the arithmetic mean in each bin. The chosen MLT, L*, and |λ| ranges are all for MLT, 2–6 for L*, and 0°–20° for |λ|. In this procedure, the Kp dependence of each parameter has not yet been considered. Second, by using a weighted least squares method, we fit the average values with the following functional form of f :
where , depending on the MLT given in the hour unit. This polynomial form includes the first-order terms of MLT expressed in A and B and the second-order terms of L* and |λ|, as well as their cross terms. Note that, while fitting, more weight is applied for more measurements. The weight in each bin i is estimated by , where Ni is the total number of measurements in the ith bin, and Ntotal is the total number of measurements for all bins. Third, to consider the Kp dependence of each output in the modeling, we separately estimate the scaling factor g(Kp) expressed in a dimensionless form, which is defined as follows:
where
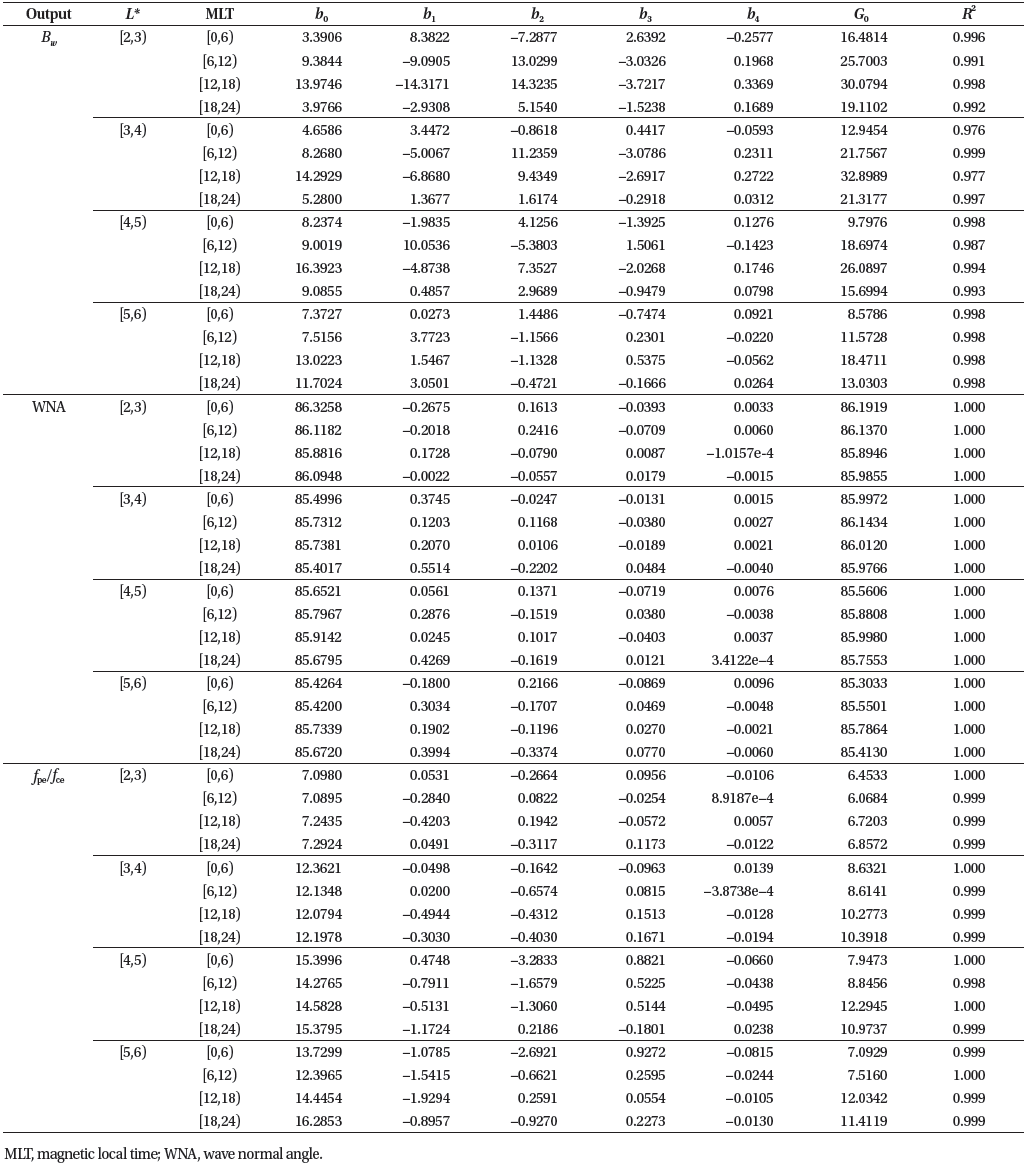
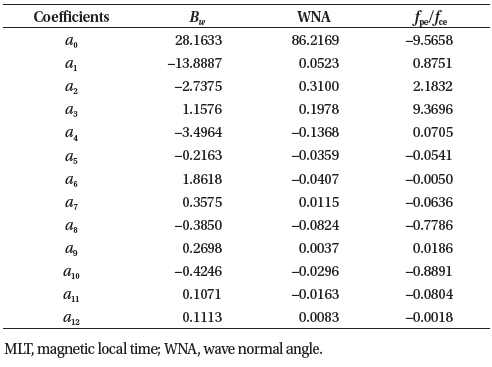
For the estimation of function g0, we first bin all the measurements of any desired output at 6 h × 1 intervals of MLT × L*. We then sort and average the data for each bin in one interval of the Kp index for 0 to 6, and finally apply a weighted least squares method in each bin. The denominator is a normalization factor obtained by integrating g0(Kp) from 0 to 6 of the Kp index. Note that the coefficients related to the g function are estimated differently for each bin. They are listed in Table 1 with the value of the denominator denoted by G0. In contrast, those associated with the f function are obtained independent of the bins, as listed in Table 2. For the model performance, we estimate the coefficient of determination, which is defined by
|
|
where yi is one of the observed Bw, WNA, or fpe/fce in the ith bin, is its corresponding model output, and is the weighted average value over all the bins. The coefficient indicates how well the model output captures the observed variation. Higher R2 values in the range of 0–1 indicate that the model produces more accurate changes in observations. For the fitting result by function f, we obtain 0.984, 1.000, and 0.997 between the observation and model outputs for Bw, WNA, and fpe/fce, respectively. The relatively high value of WNA due to the variation in WNA is not significant, and its range is also small. For the relevant result by function g, the coefficient of determination for each bin is provided in the last column of Table 1. The average values over all the bins are 0.993, 1.000, and 0.999 for Bw, WNA, and fpe/fce, respectively.
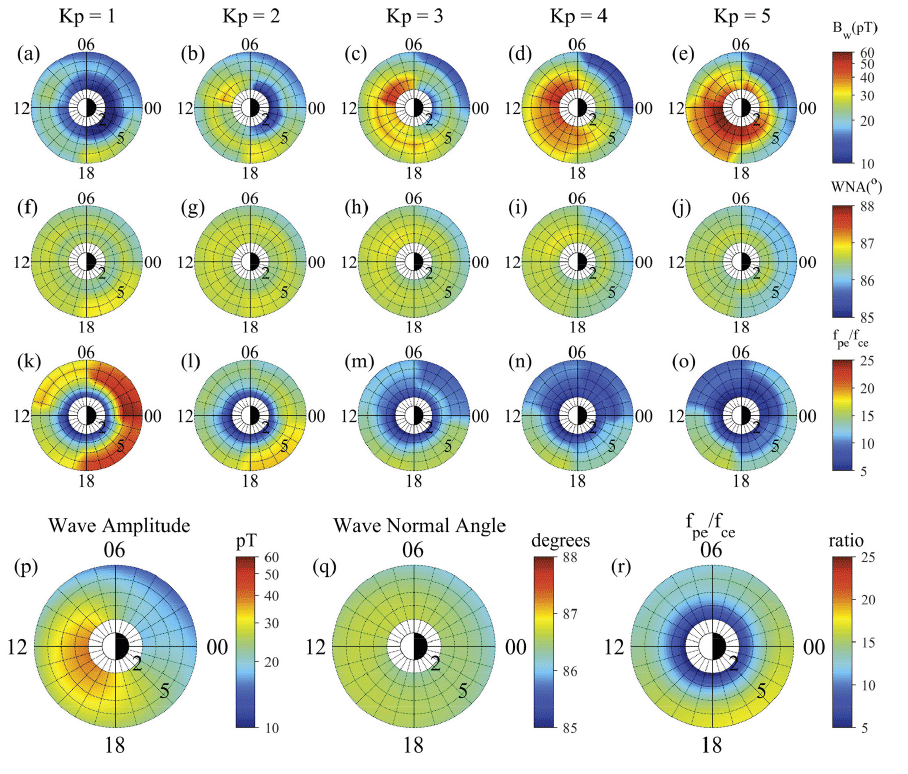
The model results at the equator, where the most intense waves are frequently observed, are shown in Fig. 5. The top three row panels show the L*-MLT distribution of Bw, WNA, and the ratio of fpe/fce for different Kp values from 1 to 5. The bottom row panels show the distribution of each parameter estimated by function f, which does not depend on the Kp index. The model outputs are linearly interpolated between the adjacent bins. From the bottom row, that is, when ignoring the Kp dependence, one can observe that most intense waves are found around the 9–18 MLT sector, wave normal angles are evenly distributed (although it shows a slight day–night asymmetry), and higher fpe/fce is found in the 18–24 MLT sector. As for the Kp dependence, the wave amplitude first intensifies in the pre-noon and dusk sectors between L* = 4–6. As Kp increases, there is a significant enhancement in the region and the 6–18 MLT sector at L* ≤ 4. The variation in the wave normal angle is less pronounced because of the tiny variation range, that is, within almost one degree; nevertheless, with an increasing Kp index, a relatively high WNA is found at the peak location of Bw, namely, in the dusk sector up to Kp = 2 and the pre-noon sector for higher Kp. As these changes occur, the ratio of fpe/fce also responds to Kp variations. With increasing Kp, it generally decreases in all regions. For Kp ≤ 2, a relatively low fpe/fce is found in the 12–18 MLT sector, whereas for Kp > 2, the region peaks by decreasing fpe/fce in the other MLT sectors. In other words, the peak regions of fpe/fce rotate toward 12–18 MLT from the pre-midnight sector. The modeling results reproduce the statistical results in the previous section.
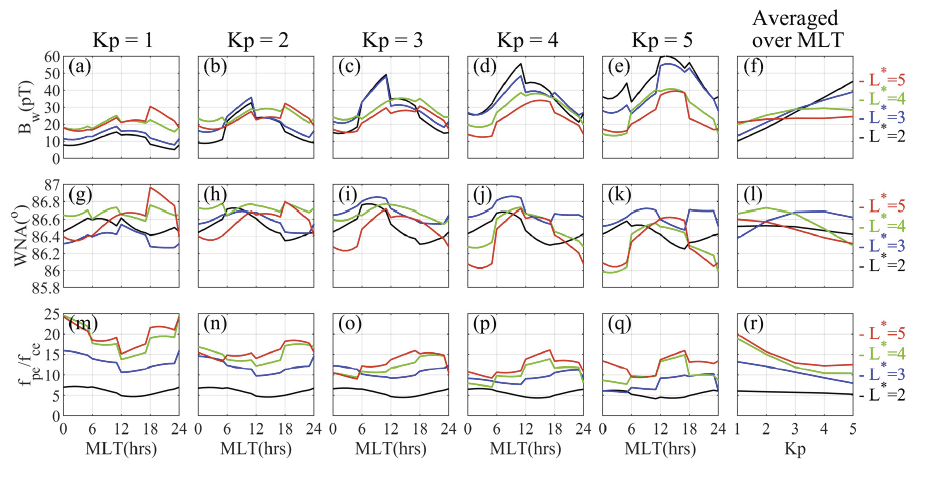
For a more precise understanding of how the magnetosonic waves and the fpe/fce ratios are co-located, we present in Fig. 6 the line profiles of each of the three parameters for different L* as a function of MLT and the Kp index, as derived from Fig. 5. The first to third rows show variations in Bw, WNA, and fpe/fce for different Kp values from 1 to 5. Different colors in each panel indicate different L* values. Averaged values over all MLTs for different L* values are presented against Kp in the rightmost column of each row. The most interesting feature is the fpe/fce with Bw. As Kp increases, the wave amplitude generally increases for all L* values; however, its variation is more pronounced for inner L*. As shown in Fig. 6(f ), Bw conspicuously changes at L* = 2 and 3, whereas it gradually increases at L* = 4 and 5. Conversely, fpe/fce decreases for all L* with increasing Kp, and its variation is more distinct in the outer L* than in the region where there is a significant variation in Bw. For the WNA distribution, no general pattern can be found for Kp or L*; however, the variation range is within one degree. By comparing the first and second rows, we can further confirm that the peak region of WNA roughly moves along with the movement of the peak region of Bw.
4. CONCLUSION
When assessing the relative contribution of magnetosonic waves to radiation belt electrons, the diffusion coefficients, which represent how effectively (or how fast) waves can scatter particles in a wave–particle interaction process, are typically estimated (e.g., Horne et al. 2007;Lei et al. 2017). The distribution of wave amplitudes and wave normal angles has been regarded as the most crucial factor in determining the diffusion coefficient (e.g., Shprits et al. 2013;Ma et al. 2016). In contrast, the role of the background electron plasma-to-cyclotron frequency ratio co-located with magnetosonic waves has been less directly emphasized, despite being able to efficiently change the energy and pitch angle, which are more likely to be scattered by magnetosonic waves (e.g., Lei et al. 2017). Therefore, for accurate assessment of magnetosonic waves in wave–particle interactions with electrons, the spatial and temporal global distribution of fpe/fce should be derived simultaneously with the wave distribution. In this paper, we presented the statistical distribution of the wave amplitude, wave normal angle, and fpe/fce ratio using the whole mission period of Van Allen Probes A and B, and we developed an empirical model based on the statistical distribution. The model provides the wave amplitude, wave normal angle, and fpe/fce ratio as a function of L*, MLT, λ, and Kp.
The main conclusions from the statistical and modeling results are summarized as follows. Magnetosonic waves are found frequently within a few degrees of magnetic latitude and 6–18 MLT, showing a peak occurrence that tends to shift toward the post-noon sector. With increasing Kp, wave amplitudes intensify predominantly on the dayside. However, the Kp index at which the amplitude increases varies from region to region. It first intensifies at outer L* for lower Kp and then at inner L* for higher Kp. However, the variation in WNA by Kp is less significant compared to that of Bw. Nevertheless, one clear feature is that the peak region of WNA roughly follows the motion of the peak region of Bw. The ambient fpe/fce ratio responds to Kp variations: as Kp increases, the ratio decreases for all regions on account of lower fpe owing to a smaller plasma density. Moreover, a relatively high ratio is localized at L* > 4 and in the postnoon sector, which is consistent with the development of the plasmaspheric plume.
It is interesting to note that, by comparing variations in Bw and fpe/fce, the fpe/fce responds differently to Kp according to locations on the equator: as Kp increases, the ratio gradually decreases at 2 ≤ L* < 4 with considerable increases in Bw, whereas it notably decreases at L* ≥ 4 with a slight increase in Bw. First, only when comparing variations in Bw between the two regions, we can expect that scattering rates by waves in the inner regions increase significantly because they usually increase in proportion to Bw. Second, the variations in fpe/fce imply that the energy and pitch angle, which magnetosonic waves can preferentially scatter, can be changed. According to the diffusion coefficients estimated by Horne et al. (2007) and Lei et al. (2017), a higher fpe/fce allows magnetosonic waves to scatter higher pitch angles and lower energies preferentially because increasing the plasma frequency reduces the parallel phase velocity of the waves. Thus, we expect that the range of change in energy and pitch angle to be scattered by magnetosonic waves may remain unchanged or is slightly changed for 2 ≤ L* < 4 (corresponding to the slot region in the Earth’s radiation belt) regardless of Kp. Nonetheless, it significantly changes for L* ≥ 4 (corresponding to the outer radiation belt) by a significant change in fpe/fce with Kp. In addition, fpe/fce is relatively low for the inner region, regardless of the intensity of the geomagnetic activity. Thus, we expect a relatively lower pitch angle and higher energy of electrons to be scattered by magnetosonic waves in the inner regions. A diffusion simulation that considers all variations is required for a more detailed analysis of how effectively magnetosonic waves can affect the magnetospheric particles in different regions and different geomagnetic activities. This aspect will be the subject of future work.


