


1. INTRODUCTION
Active galactic nuclei (AGNs) are compact regions at the center of galaxies that consist of a supermassive black hole, bipolar jets, a surrounding accretion disk and dusty torus, and line-emitting regions (Blandford et al. 2019). AGNs having a jet that is aligned with Earth’s line of sight are called blazars (Urry & Padovani 1995). The jets, which are powered by accretion onto and/or the rotation of the central black hole (Blandford & Znajek 1977;Blandford & Payne 1982), carry enormous amounts of energy; thus, particles in the jets are very energetic. Consequently, it is thought that AGN jets can affect the evolution of the universe and be a primary source of ultrahigh-energy cosmic rays (UHECRs) detected on Earth (Murase et al. 2012). Moreover, these jets enable the study of the environment in the early universe (e.g., Ackermann et al. 2016;An & Romani 2018, 2020). To further our understanding of the universe and UHECRs, we need to understand these jets in detail. However, the components of the jets (e.g., the magnetic field B and particle species) and the acceleration and flow of particles in the jets are not yet well understood.
It is well known that AGN jets are extended (even beyond the kiloparsec scale) and emit radiation in broad wavebands. The broadband emission exhibits complex variability: correlated variability in multiple wavebands (e.g., Hodgson et al. 2018), orphan flares in one waveband (e.g., MacDonald et al. 2017), and time-delayed correlation between the variabilities in multiple wavebands (e.g., Larionov et al. 2020). The observed complexity is related to the emission mechanism, jet flow structure, and propagation of disturbances in the jet (e.g., Sokolov et al. 2004;Rieger & Aharonian 2012). An extended jet scenario is often used to explain the complexity, where particle cooling and the synchrotron self-absorption (SSA; Türler et al. 2000) effect significantly influence the observed emission (e.g., Rieger & Aharonian 2012).
In the extended jet scenario, high-energy particles are injected into the inner region of the jet (near the black hole) and propagate along the jet to the outer region. In the inner region, high-frequency radiation is emitted by energetic (freshly injected) particles, and low-frequency radiation is attenuated by SSA. The particles lose energy via radiation; thus, their emission frequencies decrease with increasing distance from the black hole. This phenomenon is called frequency or longitudinal stratification of the jet (e.g., Rieger & Aharonian 2012). If an event such as sudden particle injection or the formation of a shock occurs in a region of the jet, a signature of the event (e.g., flaring activity) is observed first in the high-energy emission and then in the low-energy emission when the event propagates to the outer region. This scenario can be tested using multiband spectral correlation studies.
3C 279 is a bright blazar with a redshift of 0.5362 (Marziani et al. 1996). The source has been monitored for a long time (e.g., Lee et al. 2016;Lister et al. 2018), and its light curves show complex variability (e.g., Rani et al. 2017) with minute-scale gamma-ray flares (e.g., Hayashida et al. 2015) and long- (> 1,000 d) and short-term (~100 d) radio activity (e.g., Hovatta et al. 2008;Larionov et al. 2020). Studies using polarimetric and interferometric data have revealed various phenomena (e.g., polarization swing and jet bending; Kiehlmann et al. 2016;Kim et al. 2020) associated with multifrequency activity that provided information about the source. However, these observed properties of the source are too complex for the limited observational data and analyses to fully address. Therefore, further studies are needed.
In this study, we used contemporaneous radio observations taken with the Korean VLBI Network (KVN) (e.g., Lee et al. 2014) at 22, 43, 86, and 129 GHz to study the jet of 3C 279. We measured the radio spectral properties and their variation using KVN VLBI data taken over ~5.6 years, from MJD 56265 (December 4, 2012) to MJD 58270 (June 1, 2018). We compared the radio and high-energy spectral properties to investigate the relationship between the low-energy and high-energy emission zones in the extended jet. We describe the data reduction processes in Section 2, present the analysis results in Section 3, and interpret the results using an extended jet scenario in Section 4.
2. DATA REDUCTION
We used four-band (22, 43, 86, and 129 GHz) contemporaneous radio observations of 3C 279 by the KVN between MJD 56265 (December 4, 2012) and MJD 58270 (June 1, 2018). Observations were taken with a 30-d cadence (except for maintenance periods) in the interferometric configuration (Lee et al. 2016), and the observational data were reduced using the KVN pipeline (Hodgson et al. 2016). We conducted an imaging process using the CLEAN algorithm (Högbom 1974); we fit the VLBI image (dirty map) with a model having a source component and gradually added more components until the residual level converged This process provided CLEAN images (Fig. 1, left). We then inspected the reliability of the CLEAN images using imaging parameters (e.g., residual noise; Fig. 1, right) and discarded data with an unreliable CLEAN image.
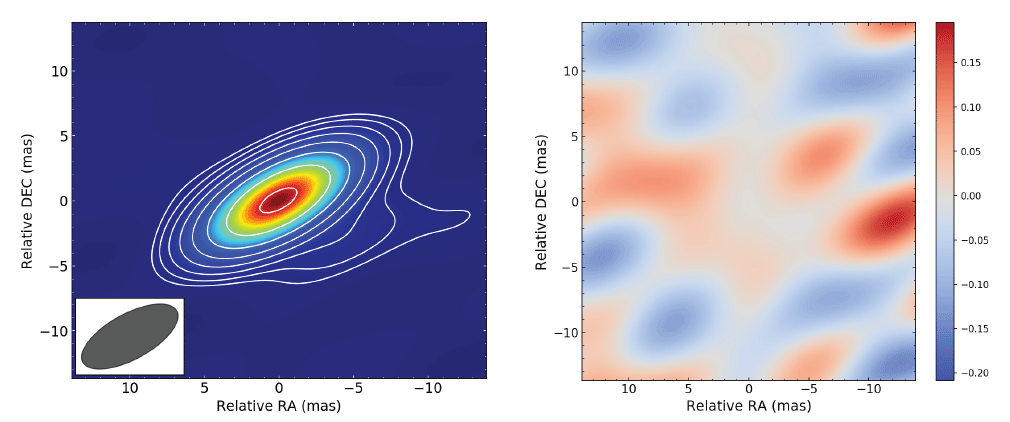
We estimated the quality of the cleaning process using the image quality factor ϵr, which is the ratio of the measured and expected maximum flux densities in the residual image, and was used to calculate (Lobanov et al. 2006). A small value of κσ (e.g., < 1) indicates that the residual follows a Gaussian distribution and that the model represents the data well (Lee et al. 2016). A CLEAN image and residual map are shown in Fig. 1. We followed this procedure for each observation and obtained an average κσ value of 0.5, which indicates that the cleaning process performed reasonably well.
We measured the source flux density by integrating the (modeled) CLEAN flux densities, most of which were from a central compact region (Fig. 1, left). The brightness decreases very rapidly with distance from the center. Because highenergy emission is produced in a compact region (inner region), we focus on a small region and use the radio flux densities within a central 10 × 10 mas2 region to study the correlation between the radio and high-energy properties. We verified that the results presented below did not vary with the size of the region (e.g., 2 × 2 mas2, 6 × 6 mas2, or 15 × 15 mas2) or source model (e.g., delta functions or Gaussians). We assumed uncertainties of 5%, 5%, 10%, and 30% for the 22, 43, 86, and 129 GHz flux densities, respectively, as reported previously (Lee et al. 2020). The measured light curves of the four bands are shown in Fig. 2(a).
Note that the transverse physical scales considered are rather large (e.g., ~10 pc for the smallest region). Because high-energy emission is thought to be produced in a very compact region (e.g., < 1 pc), it is desirable to use a comparable (or slightly larger) radio region. Resolving such a small region is impossible using our data (even if we use higher-resolution VLBI data); therefore, our radio measurements include emission from large-scale regions. The large-scale emission may blur the radio/high-energy correlation below (Section 3.2). However, as noted above, the radio brightness decreases quite rapidly with distance; thus, the blur might not be very severe.
Note that the KVN VLBI data provide four-band images with modest angular resolution. We inspected our images for any noticeable features that may be related to highenergy activity, but we did not find any. Therefore, we do not present detailed image analysis results but focus on contemporaneous broadband (22–129 GHz) radio spectral variability in this paper. Note, however, that higherresolution (0.2 mas) radio images of 3C 279 showed features that might be related to high-energy activity (e.g., Larionov et al. 2020).
The high-energy data were published results (Figs. 2(b)–2(e)) in the optical and X-ray bands from Steward, SMART, and Swift/UVOT (optical band) and Swift/XRT data (Yoo & An 2020). The optical-band spectral index α0 and flux F0 were measured in the 2 × 10¹⁴ – 1.5 × 10¹⁵ Hz band, and the X-ray band spectral properties (αX and FX) were measured in the 0.3–10 keV band. The gamma-ray data are the daily light curve (0.1–300 GeV flux, Fγ; Fig. 2(f );Fermi, 2021) measured by the Fermi Large Area Telescope in the 0.1–300 GeV band.
3. DATA ANALYSIS
We first measured the radio spectral indices using radio flux density measurements (Fig. 2(a)). For a pair of flux densities ( and ) at two adjacent radio frequencies (ν1 and ν2), we computed the power-law spectral index . This calculation was made for 22–43 GHz, 43–86 GHz, and 86–128 GHz pairs; the results are displayed in Figs. 3(a)–3(c). Note that the low-frequency spectral indices (α22–43 and α43–86) seem to decrease until MJD 57700 and then increase, but the highest-frequency index (α86–129) shows no apparent long-term change, indicating that the radio spectral variability was stronger in the low-frequency band. We quantify these results by fitting the temporal trends of the indices with two linear functions, one before MJD 57700 and the other after it. The best-fit functions are shown as green and blue lines in Fig. 3, and the best-fit slopes are given in the figure. The slopes are consistent with 0 (at the < 2σ level) before MJD 57700. After MJD 57700, the low-frequency indices, α22–43 and α43–86, increase with a positive slope (i.e., they increase with time) at the ≥ 3σ level, whereas the slope for the highest-frequency index, α86–129, remains consistent with 0. To determine whether the changes in the spectral index evolution are accompanied by a change in radio morphology, we inspected our KVN images before and after the epoch MJD 57700. The radio morphology seemed to change randomly over the observation period, and we found no systematic difference between periods before and after MJD 57700.
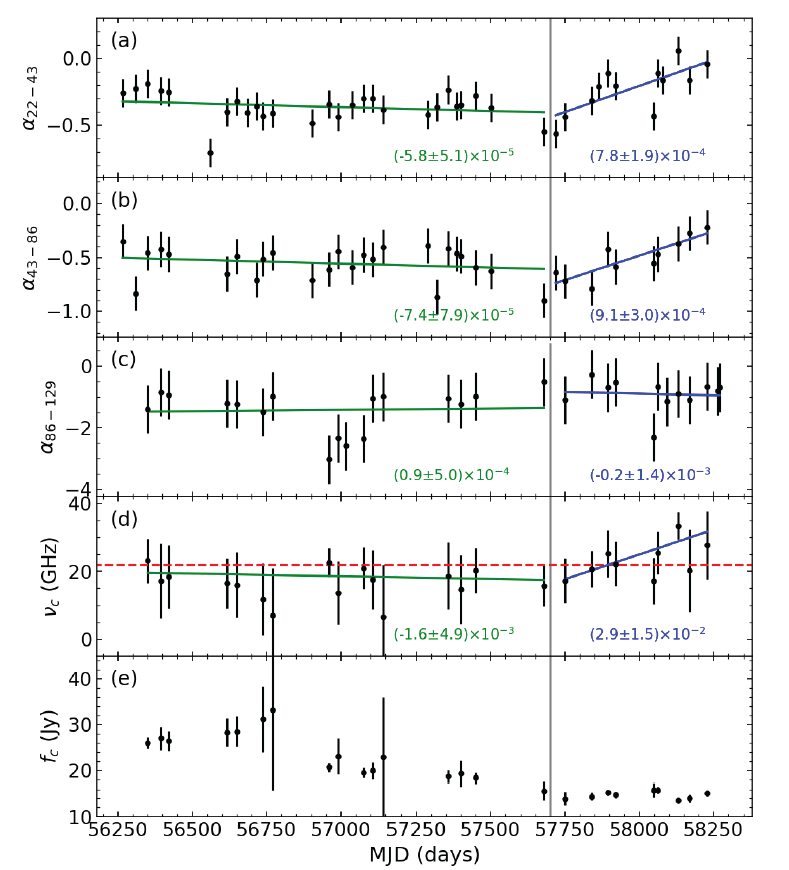
Next, we characterized the broadband radio emission by measuring the spectral turnover frequency. Specifically, we fit the four-band radio spectra with a log-parabolic model (e.g., Algaba et al. 2018), where νc is the turnover frequency, fc is the turnover flux density, and a is a slope parameter. Although this characterization can provide new information on the variability, the measurements have large uncertainties because we have only four-band (or three sometimes) measurements. The results are presented in Figs. 3(d) and 3(e). The temporal trend of νc is similar to that of α22–43, decreasing before MJD 57700 and then increasing. We fit the νc evolution with two linear functions, as described above, and found that the slope changed from (–1.6 ± 4.9) × 10–3 day–1 to (2.9 ± 1.5) × 10–2 day–1. The change is significant at the 2σ level. Note, however, that the positive trend after MJD 57700 seems to be driven by a single point at MJD 58130; if we ignore it, the slope after MJD 57700 is consistent with 0. Moreover, the measured νc value is below 22 GHz, the lowest frequency of the KVN observations, in some epochs; these measurements may be less reliable. Thus, the change in the temporal trend of νc is less certain than those of α22–43 and α43–86.
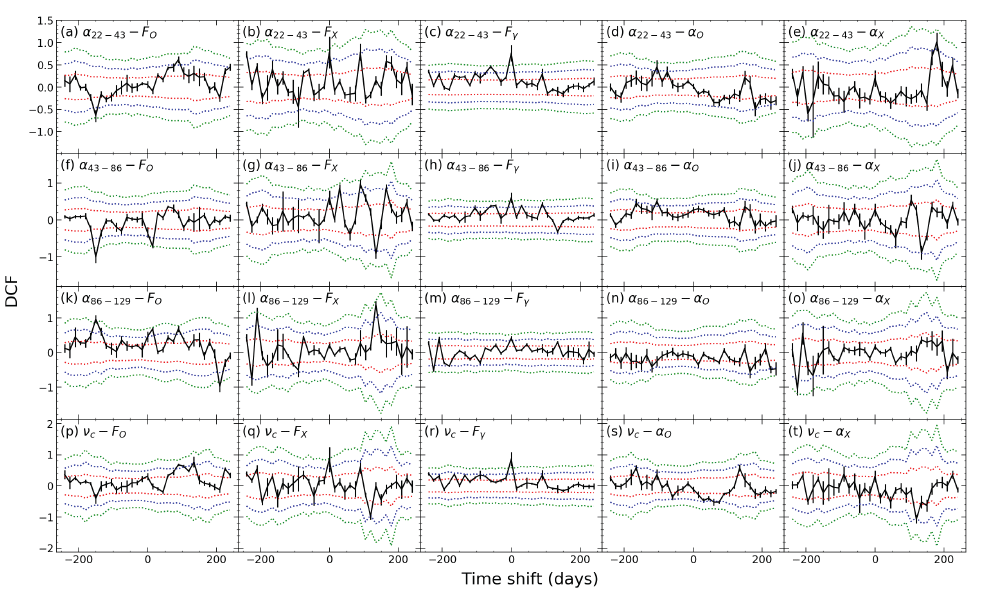
We first conducted a correlation study between the four-band radio flux densities and high-energy spectral properties (flux and spectral index) using the discrete correlation function (DCF) (Max-Moerbeck et al. 2014). The 22, 43, 86, and 129 GHz and turnover flux densities are cross-correlated with the high-energy properties, flux Fx, and spectral index αx, where x is O,X, and γ for the optical, X-ray, and gamma-ray bands, respectively. For each pair, we computed the DCF on a 500-d time scale (15-d bins). The results are presented in Fig. 4, where our measurements are shown in black, and the 1σ, 2σ, and 3σ confidence intervals are denoted by red, blue, and green dotted lines, respectively. The confidence intervals for the DCF values were computed using 5000 synthetic (simulated) light curves (Emmanoulopoulos et al. 2013;Connolly 2015). In this study, we found a ~3σ (pre-trial) negative correlation between the 129 GHz flux density and the optical flux (Fig. 4(p)). However, this result might have been obtained by chance considering the trial factor of 33 (i.e., 500 d divided by 15 d). We used different bin sizes (7, 15, 20, 25, and 30 d) in the DCF study and found that the results were not significantly affected by bin size.
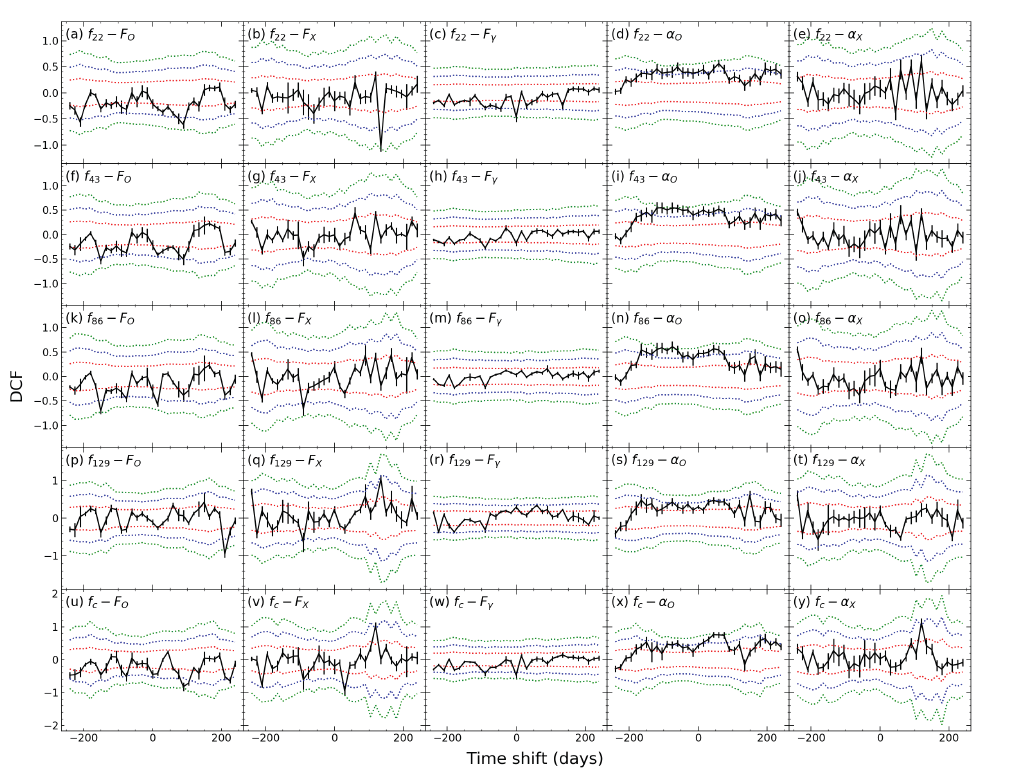
A similar cross-correlation study was performed between a radio spectral index (α22–43, α43–86, or α86–129) or the turnover frequency (νc) and the high-energy properties (α0, F0, αX, FX, and Fγ). The results are presented in Fig. 5. In a few pairs (e.g., Figs. 5(f ) and 5(k)), we found marginally significant (~3σ) correlations. However, these correlations may be insignificant considering that the trial factor is 33. Highly significant correlations were found in the α22–43 – Fγ (~4.5σ, pre-trial) and αc – Fγ (~4.5σ, pre-trial) pairs without a time delay (Figs. 5(c) and 5(r)). These correlations are significant (> 3σ), even considering the trial factor. We verified that using different bin sizes in the DCF study did not affect the results.
4. Discussion and Conclusions
We analyzed four-band radio data obtained in contemporaneous KVN observations of 3C 279 and measured the radio spectral indices between pairs of flux density measurements. During the 5.6 year observation period, the radio flux density decreased somewhat smoothly, as observed in single-dish data taken during the same period. The low-frequency radio spectral indices (α22–43 and α43–86) did not show significant long-term variability before MJD 57700 but started to increase after that date; the turnover frequency νc exhibited a similar but less significant trend. We performed a cross-correlation study and found a significant correlation between α22–43 and Fγ without a time delay.
We modeled the measured radio spectral energy distributions (SEDs) using a parametric model to estimate the turnover frequency, which can provide information on SSA and thus allows us to speculate on the reasons for the radio spectral variability. Because the SSA effect is stronger at low frequencies, the SED is likely to decrease at a low frequency (the spectral turnover frequency). The measured spectral turnover frequencies for the source are between ~10 and ~40 GHz; these values are similar to the results of an earlier study (Larionov et al. 2020). Note that we have only four data points, and the highest-frequency data (129 GHz) have a very large uncertainty and thus are not very useful. Consequently, our measurements of the turnover frequency have large uncertainties, and thus its long-term variability was not clearly detected (at the 2σ level; Section 3.1). Moreover, the νc values measured in some epochs lie below the lowest frequency of the KVN observations; these measurements must be interpreted cautiously.
The radio spectral changes (Figs. 2 and 3) can be qualitatively understood in terms of the SSA effect in the radio-emitting region. An intrinsic (unabsorbed) powerlaw spectrum is observed to turn downward at the turnover frequency because the low-frequency emission is strongly absorbed. Because the lowest-frequency range, 22–43 GHz, is close to the turnover frequency (Fig. 3(d)), a change in the turnover frequency (e.g., one associated with an opacity change) due to an event in the radio-emitting region is well represented by a change in α22–43, where α22–43 is assumed to be larger (i.e., the spectrum is harder) for higher νc. Thus, the hardness (spectral index) of the low-frequency emission can vary depending on the SSA opacity (which is determined by the particle number density Ne or magnetic field B). The radio spectral variability (Fig. 3) observed in the source can be explained as a result of changes in Ne or B, which are caused by activity such as particle injection or shock compression in the radio region. Weaker variability in the radio flux (weaker than that in the spectral index; compare Figs. 2(a) and 3(a)–3(b)) can also be explained by the SSA effect because the activity strengthens the radio emission, but the enhancement of the SSA effect by the activity itself simultaneously decreases it. The gradual increase in the low-frequency radio spectral indices after MJD 57700 (Figs. 3(a) and 3(b)) may suggest that particles and/or a magnetic field B were injected into the radio-emitting region after that epoch, increasing the SSA effect.
In the extended jet scenario, the correlation and time delay between the radio and high-energy variability can provide information about the nature of the disturbance causing the variability (e.g., a shock and/or particles). Suppose that the distance between a gamma-ray region and a radio-emitting region is d = v(t2 – t1) ≡ vdt (Fig. 6), where v is the propagation speed of a disturbance, t1 is an epoch of high-energy emission resulting from a disturbance at the same epoch, and t2 is the epoch at which the disturbance arrives at the radio-emitting region. Then, the observed time delay between the two events is computed as , where c is the speed of light. Because a disturbance such as a shock cannot propagate at a speed greater than c, dtobs is greater than 0; thus, a highenergy lead (i.e., radio lag) can generally be expected.
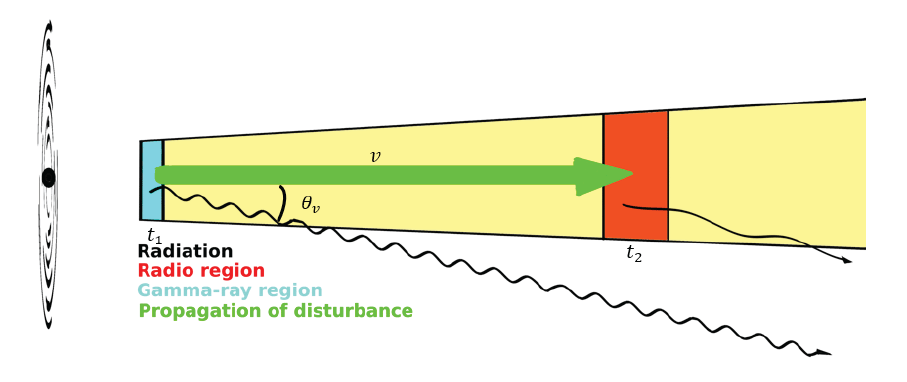
In this scenario, the contemporaneous variability (no delay, i.e., dtobs ≈ 0) of the radio and gamma-ray emission properties (the α22–43 – Fγ and αc – Fγ correlations without a time delay) implies that the disturbance propagated at nearly the speed of light, and the jet viewing angle θv is very small. Because the θv value of the jet in 3C 279 is indeed very small (≈3˚; Hovatta et al. 2009;Liodakis et al. 2017), dtobs can be approximately equal to 0 if the disturbance propagated at the speed of light. Because a shock cannot propagate at the speed of light, we speculate that the injected particles themselves are disturbances; they produce a gamma-ray event and propagate at the speed of light (Γ ~15 in 3C 279; Hovatta et al. 2009;Liodakis et al. 2017) to the radio region, increasing the SSA effect (i.e., producing a hard radio spectrum). Thus, the positive correlation between α22–43 (or αc) and Fγ with no delay can be explained by this scenario.
Alternatively, the contemporaneous variability of the radio and gamma-ray emission may imply that the gammaray- and radio-emitting electrons are in the same region. However, in this case, strong SSA would prevent radio photons from leaving the emission region to approach the observer, and contemporaneous increases in the radio and gamma-ray emission are impossible. To avoid SSA, radioemitting electrons should exist outside (low Ne and/or B) the compact gamma-ray jet. However, this scenario is not commonly used because it is unclear why the radioemitting electrons remain in the outer envelope of the gamma-ray emission region, as radio-emitting electrons have much smaller gyro radii (e.g., , where Pe is the electron momentum) than gamma-ray emitting electrons. Thus, unless there is a compelling mechanism of radio envelope formation, this scenario seems infeasible.
Note that the correlation significance we found was not very high. Furthermore, accurate flux density measurements using VLBI imaging data are challenging. Therefore, the results should be interpreted cautiously. Our conclusion awaits further confirmation, and continuing contemporaneous observations of 3C 279 will be very helpful.