1. INTRODUCTION
The physical, morphological and dynamic characteristics of small Solar System bodies are important for understanding the formation and evolutionary processes of our planetary system (Bottke et al. 2002). Despite their importance, there are few asteroids located in the main belt whose disks can be resolved with observations by ground-based telescopes due to limitations in angular resolution caused by atmospheric turbulence (Marchis et al. 2006). This situation is even more critical for Kuiper Belt Objects (KBOs) because due to the distances at which they are found (a > 30.1 AU), determining their fundamental properties, such as size, mass, albedo and density, is a challenging task (Stansberry et al. 2008). In fact, the smallest (D < 1 km) KBOs are even invisible to the largest telescopes (Lehner et al. 2018).
Unlike techniques based on direct observation, stellar occultation is a technique used for the study of asteroids and KBOs that is not directly contingent on their magnitudes. This technique is ideal for determining the sizes and shapes of small Solar System bodies with kilometric precision (Wasserman et al. 1979;Millis et al. 1989;Dunham et al. 1990;Brown 2013;Alvarez-Candal et al. 2014;Leiva et al. 2017;Schindler et al. 2017;Camargo et al. 2018), and can be used to derive albedos and densities (Elliot et al. 2010;Sicardy et al. 2011a;Braga-Ribas et al. 2013;Benedetti- Rossi et al. 2016). This technique allows the detection of ring systems (Elliot et al. 1977;Braga-Ribas et al. 2014;Duffard et al. 2014;Ortiz et al. 2015;Ortiz et al. 2017), the detection and characterization of atmospheres at nanobar levels (Hubbard et al. 1988;Elliot et al. 1989;Elliot et al. 1996;Ortiz et al. 2012), and the detection of satellites and jets (Elliot et al. 1995;Gulbis et al. 2006;Sicardy et al. 2011b;Ruprecht et al. 2015;Sickafoose et al. 2019).
A stellar occultation occurs when an object, for example, a small Solar System body, blocks the light of a star seen from the Earth (Elliot 1979). Light rays intercept the object in parallel, casting a shadow of the same shape and size, which passes across a fraction of the Earth’s surface (Souza et al. 2006). A recording of the event by an observer located on the shadow path corresponds to a positive occultation chord (Olkin et al. 1996). The real trajectory sometimes differs from the predicted trajectory given the associated uncertainty. Recordings outside the real shadow path are called negative detections. The deployment of multiple observers distributed perpendicularly to the shadow movement has two advantages. First, it increases the probability that the occultation will be positively detected by at least one station (Buie & Keller 2016). Second, most of the measurements discussed in the previous paragraph are constructed from multiple chords (Lockhart et al. 2010).
The relevance of collecting multiple observations means that stellar occultations are characterized by being highly collaborative work (Mousis et al. 2014), involving the participation of professionals and amateurs who coordinate observation campaigns through international networks. The occultations are widely distributed over the Earth’s surface (Barry et al. 2015a), and many occur over Colombian territory. However, to date, the Astronomical Observatory of the Technological University of Pereira (hereinafter OAUTP) is the only team that has reported positive detections of stellar occultations by small Solar System bodies from Colombia, within which the events by (257) Silesia and (386) Siegena in June 2019 (https://ocultacionesliada.wordpress. com/2019/11/21/dos-ocultaciones-positivas-desde-el-obsde- la-ut-de-pereira-en-colombia/), and (41) Daphne in September 2020 will be discussed later in the results section.
Additionally, in August 2018, different teams, both Colombian and from other countries, participated in the campaign to observe the stellar occultation by (486958) Arrokoth (Before 2014 MU69) with the aim of preparing for the close encounter of the New Horizons mission with said KBO (Buie et al. 2020b). Despite the fact that the meteorological conditions did not allow a positive detection from Colombia to be recorded, this event confirmed that stellar occultations constitute a great opportunity for collaborative work at an international level, where both professional and amateur observers play leading roles.
In this paper, we present the methodology that we developed for the observation from the OAUTP of stellar occultations due to small Solar System bodies. The aim is that our methodology contributes to the ability of other observatories and teams of astronomers to join in the observation of stellar occultations and, in this way, encourages collaborative observations of these events and continued participation in international networks.
2. METHODOLOGY
The observation of stellar occultations involves three major processes: planning the observations, recording the event and treating the data. First, the planning process involves defining the events to be observed, as well as scheduling the observation session according to the characteristics of the observer. Second, through the operation of the instrumentation, the capture process is reached, in which the detector is set up and the event is recorded. Finally, once the data is acquired, data treatment is carried out that will lead to the morphology of the small body, its astrometry and other characteristics. In our case, as these are single-chord events, the lower limits of the diameter of the minor body and its astrometry are determined, assuming a spherical body.
An intrinsic requirement of the stellar occultation record is the ability to move the observation station. This is necessary first because the shadow can sweep across regions where there are no fixed observatories. Second, the uncertainty in the location of the shadow path can be on the order of the size of the object, which is commonly refined in predictions in the days before the event. This refinement can shift the shadow path by a few kilometers. Having a mobile station allows expanding the set of observable occultations. Furthermore, if the mobile station complements a fixed station, it is possible to take advantage of multiple observations. Thus, a key factor in occultation observing systems is portability. This requires high robustness in these systems and the ability of the systems to withstand heavy handling, together with a compact and light size that facilitates transport (Baron et al. 1983). Given the above, we developed our methodology involving both a fixed station (located in the OAUTP) and a mobile station.
The main objective of the fixed station is to record the occultations, which, due to their magnitude-duration relationship, are demanding in instrumental terms. The array of the OAUTP consists of the Meade LX200-GPS 16” telescope (https://www.meade.com/pub/media/ downloads/104/LX200-ACF_manual_01.10.pdf), the QHY174M-GPS (https://www.qhyccd.com/index.php?m =content&c=index&a=show&catid=94&id=46&cut=1) and SBIG STF-8300M detectors (http://diffractionlimited.com/ product/stf-8300/), and the Moon-Lite rotating focuser. In contrast, the main objective of the mobile station is the recording of stellar occultations whose shadows do not move over the geographical coordinates of the OAUTP (4° 47’ 25.79’’ N, 75° 41’ 25.48’’ W), in addition to enabling multiple-chord recording of the events of interest that can also be recorded by the fixed station. Our mobile station consists of the Celestron Ultima 11 telescope (https://www. manualslib.com/manual/221830/Celestron-Ultima-11. html#manual) (C11) and the QHY174M-GPS detector.
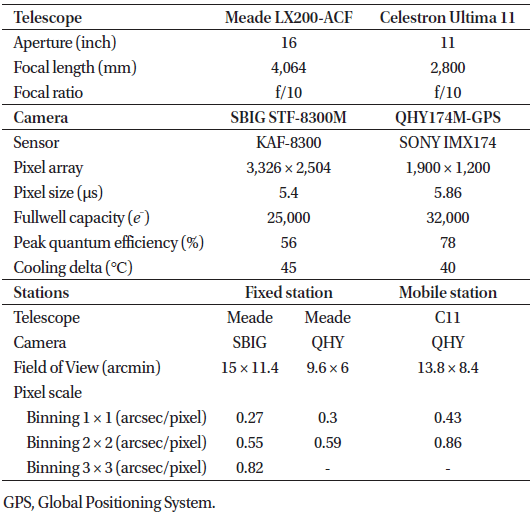
The Meade telescope is a computerized telescope, while C11 is robotic; the Schmidt-Cassegrain (SCT) design is the optical arrangement of both telescopes. For their part, both detectors are monochromatic, the QHY with a CMOS sensor and the SBIG with a CCD. The full technical specifications of this equipment are listed in the first two sections of Table 1. The FOVs and pixel scales obtained in the different detectortelescope arrays are listed in the third part of Table 1.
|
In this section, we present the planning process for observing stellar occultations by small Solar System bodies. The flowchart in Fig. 1 describes this process, which broadly consists of filtering the events and scheduling the observations.
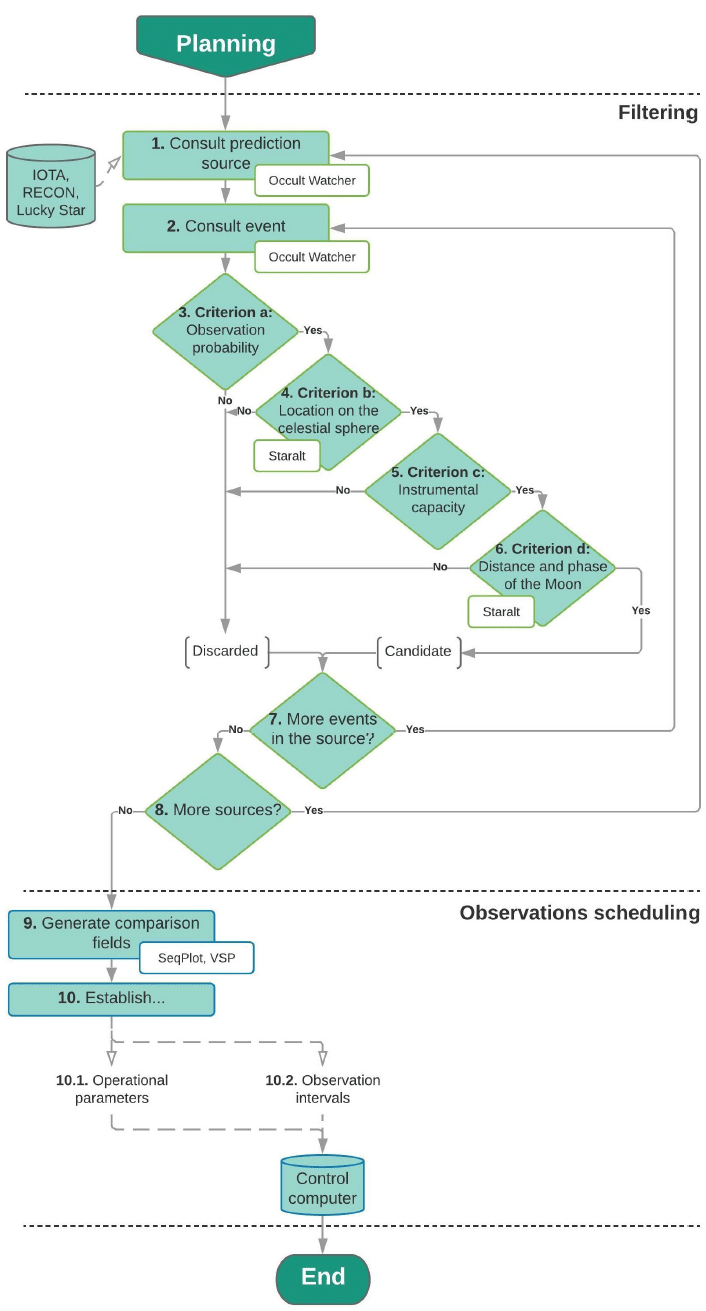
The observation planning process begins with the filtering of events that are favorable for observation (blocks 1 to 8 in Fig. 1). These ephemerides of stellar occultations are taken from different prediction sources. To understand the process of occultation prediction, we recommend referring to Assafin et al. (2010). Among these prediction sources is the IOTA (International Occultation Timing Association) (https://occultations.org/), which supplies predictions of stellar occultations by asteroids. These data can be articulated with Occult Watcher software (https:// www.occultwatcher.net/), which is a useful tool that groups events from different sources and performs filters according to the observer’s preferences. To plan the observations of occultations by TNOs, we recommend the use of the database built by the collaborative project Lucky Star (http://lesia.obspm.fr/lucky-star/index.php), as well as the use of the RECON (Research and Education Collaborative Occultation Network) (http://tnorecon.net/) database.
Considering that the prediction platforms list events with different characteristics, we introduce a series of criteria to guide the filtering process of favorable events according to the observer’s particularities and to a specific period. An event defined in blocks 1 and 2 of Fig. 1 must be evaluated in the framework of the 4 criteria (blocks 3 to 6) successively. If the event in question does not meet any of the criteria, it will be discarded, and the ephemeris sources will be examined in search of more events, as seen in blocks 7 and 8 of Fig. 1.
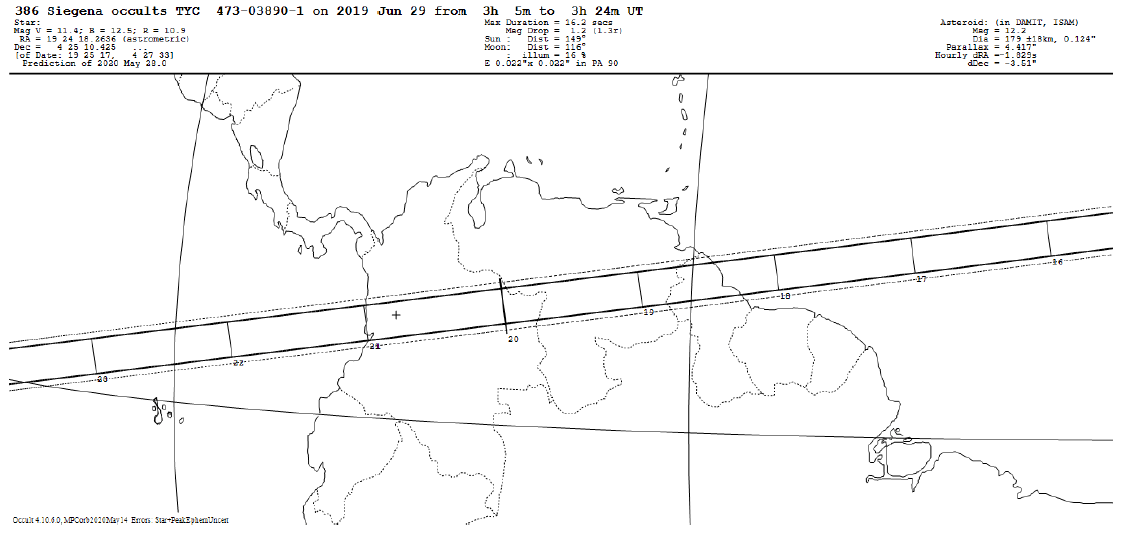
The first observability criterion (block 3) addresses the relationship between the shadow path and the location of the observer. The trajectory calculated from the prediction is characterized by 2 different regions. The first region corresponds to the limits of the object according to the nominal prediction, while the next region indicate the zone limited by the 1σ uncertainty. In Fig. 2, these two areas are shown. In solid black are the shadow path limits, and outwards from the solid lines, in dotted lines, is the precision of 1σ-uncertainty in the prediction of the event. In the case of occultations due to MBAs, this criterion is met if the geographic coordinates of the observer are contained within the coordinates of the shadow path. If the observer is in the 1σ-zone of the trajectory, or if the shadow passes through surrounding regions, the event will be a candidate for a fixed station observation or a mobile station observation, respectively. Occultations involving TNOs or Trojans are characterized by high uncertainties that propagate in the predictions and are mainly due to the imprecise astrometry of these objects (Desmars et al. 2015). Given the relevance of TNOs, we suggest that the events associated with these objects are candidates if the observers are at least in the 1σ-uncertainty region for both fixed and mobile stations.
Continuing with block 4 of Fig. 1, the location of the event on the celestial sphere composes the second criterion. For example, in our case, considering that the fixed station is located on the southern periphery of the city of Pereira, Colombia, we define a range of horizontal coordinates in which we establish the favorability of observations over the local celestial sphere. First, our observations are restricted to altitudes above 30°, considering the increase in airmass below this value. In addition, observations from altitudes between 30° and 60° and azimuths between 292.5° and 67.5° are available only for the brightest events due to light pollution from the city of Pereira. Another factor to consider is the extent of the OTA-camera array, as it can restrict the movement of small telescopes in some areas. In our mobile station, the QHY camera hits the telescope fork in the region between altitudes of 30° and 60° and azimuths between 333.75° and 26.25°, so an event that takes place within these regions cannot be observed with this array. To determine the altitude of a star at the time of occultation, we recommend using Starlalt (http://catserver.ing.iac.es/ staralt/). The visibility curve calculated with this tool is also useful during the evaluation of the criterion shown in block 6 of Fig. 1.
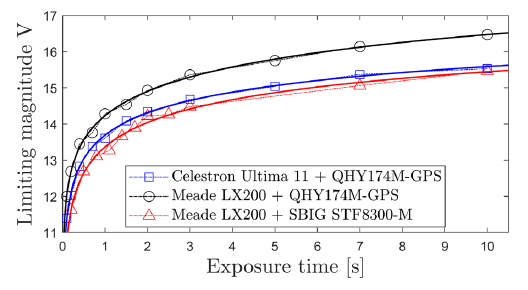
The third observability criterion (block 5 of Fig. 1) corresponds to the instrumental capacities of the stations. The differences in the telescopes’ apertures and in the sensor characteristics of the cameras used in the stations determine the limiting magnitude that can be registered as a function of the exposure time. For our case, the limits are presented in Fig. 3. Thus, the different responses of the systems are derived from the scope of each of the stations, and the responses are fundamental to defining an event as observable. To construct this curve, we suggest observing, using different exposure times, standard photometric fields such as Landolt fields (Landolt 1992) (https://www.eso.org/ sci/observing/tools/standards/Landolt.html) with sufficient calibration stars. Moderately populated fields can also be used, and their apparent magnitudes can be determined from the AAVSO Photometric All-Sky Survey (APASS) (Henden et al. 2009) (https://www.aavso.org/apass). The recorded images of the selected star fields must be calibrated with bias, darks and flats images. The SNR is then determined for the most representative stars in the field, with a wide range of magnitudes covered in a distributed manner. Later, the SNR versus the apparent magnitude from the V-band dataset is fitted with an exponential curve for each exposure time. Considering that the minimum advisable SNR for photometric reduction is 20, the magnitude is interpolated to this SNR, thus determining the limiting magnitude per exposure time. From these data, a power function is fitted to obtain an equation that characterizes the limiting magnitude as a function of the exposure time for each of the evaluated detector-telescope arrays. This equation is an approximation since it does not consider the effects of the airmass. The event’s characteristics to be evaluated in terms of this factor are the estimated duration of the occultation and the magnitude of the star. In general, events involving stars of lower magnitudes admit shorter durations. Considering that the minimum number of photos necessary to determine an occultation detection as positive is 2, the maximum exposure time allowed by the system is determined from the estimated duration of the event. Finally, with the maximum exposure time and the characteristic equation of the system, it is determined whether the calculated limiting magnitude is greater than the star magnitude; with this, it is established whether the event continues its process towards the next criterion or if it is discarded. For example, in the OAUTP case, an occultation of a 1-s duration can be recorded with the Meade + QHY array of the fixed station as long as the star magnitude is less than V 13.53, since at least two captures, each with an exposure time of 500 ms, can be made.
Finally, the fourth criterion (block 6 of Fig. 1) refers to the distance and phase of the Moon during an occultation event. These two data can be determined from the visibility curve calculated in block 4. The scattering of the light reflected by the Moon is especially important when the Moon is close to its totality phase. A decision will have to be made regarding whether an occultation event will be observable depending on the magnitude of the star involved. In our case, the conditions of the presence and proximity of the Moon are critical for the observation of occultations by TNOs, considering that these occultations mostly take place with faint stars. For asteroid occultations, the observability should be carefully examined considering, as mentioned earlier, the magnitude of the event star.
Once the candidate events have been defined for the planned time period, we proceed with the scheduling of the observations. This phase is made up of blocks 9 and 10 of Fig. 1. The objective of this stage is to optimize the use of time (which in many cases is limited), during the observation session. For each of the events, the operational parameters of the detector and the intervals to be recorded must be determined, and the comparison fields must be generated. We recommend avoiding the use of photometric or color filters in the camera to record as much light from the source as possible; this method maximizes the SNR. In addition, the use of adequate binning is essential at the time of observation, since, by using different combinations of detector pixels, it is possible to increase the SNR of the sources, which allows to reach higher magnitudes. Since binning affects the resolution of the instrumental assembly, this parameter is set according to the resolution of the observer’s seeing. For example, although our best resolution is 0.27”/pixel (Meade LX200 + SBIG STF8300-M), we generally use 2 × 2 binning for our observations, as the resulting resolution (0.55”/pixel) is still much lower than our best seeing (1.5”).
Block 9 of Fig. 1 corresponds to the generation of comparison fields. In general, comparison fields are representations of a specific portion of the sky that can be generated given an FOV and its central coordinates, α and δ, and can be depicted as survey images or as schematic images of the real field. Before generating comparison fields, the magnitudes of the stars around the target star are examined to identify comparison stars. We simplified this process through the JAVA application SeqPlot (https:// www.aavso.org/seqplot). Comparison stars are stars that will be used for the differential photometry process that will be described in the data treatment section. These stars must satisfy the following requirements: they must be close to the target star, have similar magnitudes to the target star, must not be variable stars, and, as far as possible, must not have stars in their vicinities (Henden & Kaitchuck 1982). In our case, whenever possible, we identify two comparison stars for each event. For the comparison fields, we use the Variable Star Plotter (VSP) (https://www.aavso.org/apps/ vsp/), as it allows the identification of variable stars. The comparison field corresponds to the FOV of the system that includes the target star and the two comparison stars distributed in its center, which we will call the capture field. This will be the region of the sky recorded during the observation session.
Continuing with block 10.1 of Fig. 1, the operational parameters of the telescope-camera assembly are defined from the magnitude of the occulted star and the estimated duration of the event. Since temporal resolution translates into spatial resolution when measuring distances over an object, if we consider comparison stars for the differential photometry, a balance must be sought between sampling at a given exposure time and the SNR of the stars of interest. For example, in the case of our fixed station, an occultation with a 1-s duration can be detected at 2 Hz if the star has a magnitude of V 13.53. If the magnitude of the star is lower, then we know that this duration can be sampled by a greater number of photos. However, assuming the brightest comparison star is V 13.53, it is necessary to keep 2 Hz as the capture frequency. In contrast, the visibility of the occulting body will define the observation ranges (block 10.2). If the occulting body is visible, we recommend programming spaced captures moments before and after the contact between the discs of the small object and the star (this false contact is generated by the scattering of light in the Earth’s atmosphere); this is useful to perform photometry of the objects separately. The contact and occultation interval must be captured continuously to avoid event loss. For the case in which the occulting body is not visible, only a continuous series of photos is programmed that includes the limits given by the uncertainty of time. Once the operational parameters and capture intervals have been defined, block 10 of Fig. 1 ends, and the planning process is over.
The next phase in the recording of stellar occultations consists of capturing photographs during the event. As explained below, this phase involves critical elements, such as the detector’s characteristics and the adequate temporal synchronization of the observations.
The occulting body and the occulted star are usually faint, so the dominant source of error is read noise, which is critical in captures with short exposure times. Stellar occultations have durations of a few seconds; the duration depends mainly on the size of the occulting body. As the temporal resolution of the observations translates into spatial resolution in the morphological characterization of the object, the exposure times must be as short as the instrumentation and the event characteristics allow. The above situation imposes the following characteristics to describe a good detector for recording stellar occultation: high quantum efficiency, high frame rates, low read noise, and no or minimal dead time between captures (Young et al. 2011).
The characteristics of the detectors determine the most convenient observational technique to record stellar occultation. The most commonly used technique requires high-cadence equipment such as camcorders, frametransfer CCDs detectors and CMOs detectors. The objective is to measure the variation in the combined fluxes of the small body and the star; this objective can be reached through the successful capture of as many photos as possible. Thus, frame-transfer CCDs, and CMOs are the preferred detectors due to their sensitivity. The second method is called drift scan and was borne as a consequence of the long read times of the CCD full-frame detectors, which are widely used by the astronomical community. This technique aims to record, in a single image, the trail of the star obscured by the occultation, for which the telescope’s tracking is deactivated (Fors et al. 2001;Ma et al. 2005).
Considering the above, the QHY174M-GPS camera is suitable for recording stellar occultations through the first technique thanks to its negligible read time. With respect to the high digitization rate of the SBIG (10 MPix/sec), if 2 × 2 binning is used, in addition to subframes (giving up part of its wide FOV), it is possible to go from 0.83 s to 0.15 s of read time. With this camera and the Meade telescope, we also implement the drift scan technique. To give an idea of drift scan: with 2 × 2 binning, the pixel scale is 0.55”/pixel. Considering a field displacement at the sidereal rate, this scale is equivalent to a resolution of 0.037 s/pixel. With this resolution, it takes a star approximately 60 s to cross the full width of the sensor. In a 1-s occultation, the length of the obscured trail will be ~27 pixels.
The fact that several stations participate in observations of stellar occultations requires adequate synchronization of measurements (Manzano et al. 2019). For multiple chords of the same event to be analyzed, it is necessary that the data be accurately referenced to UTC as the common time base (Dunham et al. 2000). The UTC referencing method par excellence is through the Global Positioning System (GPS). UTC referencing and GPS can be used in a variety of ways; with GPS receivers, the time can be stamped on the image, either as text on the image itself using video time inserters (VTIs) or embedded in the image header with specialized cameras. In addition, there are systems that use GPS to shoot exposures. A simple but less accurate method uses the Network Time Protocol (NTP), synchronizing the internal time of the computer through time servers (Barry et al. 2015b).
In our case, the QHY174M-GPS camera, thanks to its GPS module, can stamp the capture time in the image header with an accuracy of 1 μs, which corresponds to 0.0002% of an exposure of 500 ms. Unlike the QHY, our SBIG STF8300-M camera does not have a built-in GPS system, so we use Dimension 4 software (http://www. thinkman.com/dimension4/) for its synchronization. This software synchronizes the system time through NTP, which, during capture, is read by the software that controls the camera (MaxIm DL) and recorded in the header image. A properly set NTP synchronization is accurate typically to milliseconds, but absolute errors of hundreds of milliseconds should be expected (Pavlov & Gault 2020).
With regard to the software used during the observation session, the best option for controlling the QHY174M-GPS camera is SharpCap (https://www.sharpcap.co.uk/), since it allows control of all functionalities. We suggest the use of MaxIm DL (http://diffractionlimited.com/product/maximdl/) for controlling SBIG cameras as well as for reviewing captured photos, as it has a wide variety of statistical tools for analysis of the recorded images.
At the time of observation, considering that the exposure time to be used is established from a prediction, we advise evaluating the effectiveness of the exposure time directly in the star field. For this, one of the MaxIm DL tools can be used, which allows quick determination of the SNR of the stars of interest on a captured image. By evaluating the measured SNR, it is possible to determine whether the exposure time is adequate or whether it needs to be adjusted. It should be remembered that the suggested minimum SNR is 20 and that at least 2 observations are required during the occultation of the star. At the time of the event, the continuous capture interval containing the occultation is recorded in addition to the spaced intervals before and after contact (if these were programmed), thus fulfilling the objective of the observation session. Finally, the observation session concludes with the capture of the flats, darks and bias calibration images that will reduce instrumental noise present in the photographs.
The last component of our methodology corresponds to the treatment of the data acquired during the observation session. This phase is outlined in the flowchart in Fig. 4. The treatment of the collected data will allow the event detection to be classified as positive or negative in addition to morphologically characterizing the occulting object and determining its astrometry (in the case that the event detection is positive).
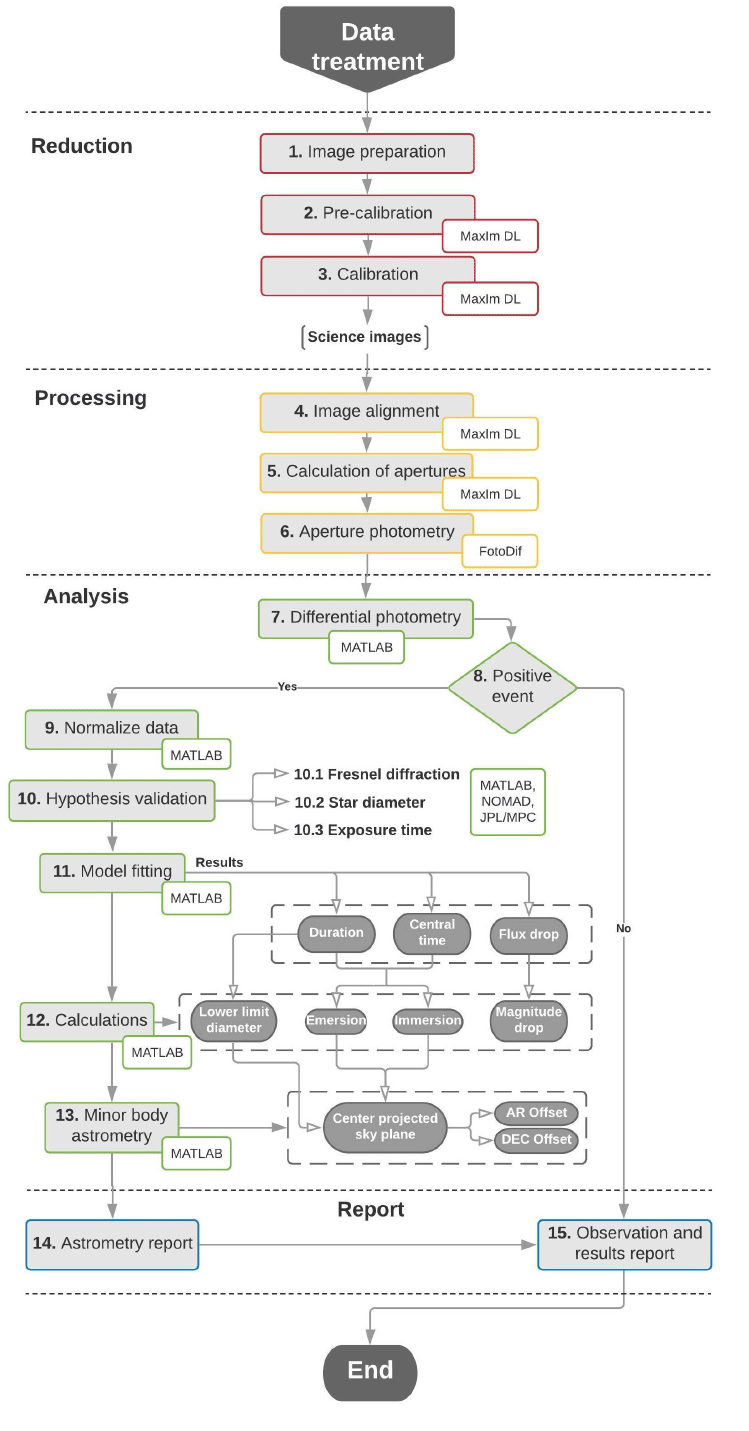
The data treatment phase begins with the reduction of the noise present in the captured images (blocks 1 to 3 of Fig. 4). Since a large number of images are generally recorded during an observation session, we recommend standardizing the names and locations of the files to simplify the configuration of the processing programs and facilitate their work. Next, standard calibration procedures for bias, darks and flats images are run to eliminate electronic noise, thermal noise and sensitivity differences due to sensor defects or imperfections and/or dirt in optics (Berry & Burnell 2000). In our case, we use the calibration tools of MaxIm DL software for this task. Next, we proceed with image alignment to correct problems in telescope tracking (block 4 of Fig. 4). For this process, we use the MaxIm DL alignment tools, configured in “displacement” mode. We suggest not using the target star as the reference star, since if it is completely occulted, the software will not be able to establish its centroid.
Before starting the aperture photometry processing to quantify the decrease in brightness of the target star due to occultation, it is necessary to determine the value of apertures to apply. These are defined from the average FWHM of the target star and of the comparison stars (in our case, 3 stars in total; block 5 of Fig. 4). If, in the event, the small body is visible, the FWHM is determined by measuring a sample of photos before and after contact. We use the FWHM value as the aperture radius, considering the advantages shown by Mighell (1999), while for the annulus and dannulus radius, we generally use 3 and 4 times the FWHM value. With the determined apertures, we perform aperture photometry on the stars of interest in the selected images (block 6, Fig. 4). In our case, we use the FotoDif software (http://www.astrosurf.com/orodeno/fotodif/) for its efficiency when operating with large numbers of images. The final result of the process is exported as a text file that includes the times, measured fluxes and uncertainties of the image data.
According to block 7 of Fig. 4, our methodology continues with the differential photometry process, the objective of which is to eliminate variabilities induced by atmospheric effects. First, the ratio between the flux of the target star and the flux of the first comparison star is calculated. As they are located on the same column of air, the conditions that affect one star affect the other star equally; calculating the quotient of their fluxes, or the difference in their magnitudes, eliminates this atmospheric component and brings out the variation (in some cases of low amplitude) given by the occultation, as long as the comparison star does not vary intrinsically. Continuing with differential photometry, the ratio between the flux of the first comparison star and the flux of the second comparison star is calculated. The above steps are completed in order to check the nonvariability condition of the first comparison star. If this second differential curve approaches a straight line, any variability found in the first differential curve is validated. If not, it indicates that the first comparison star has variations in its magnitude.
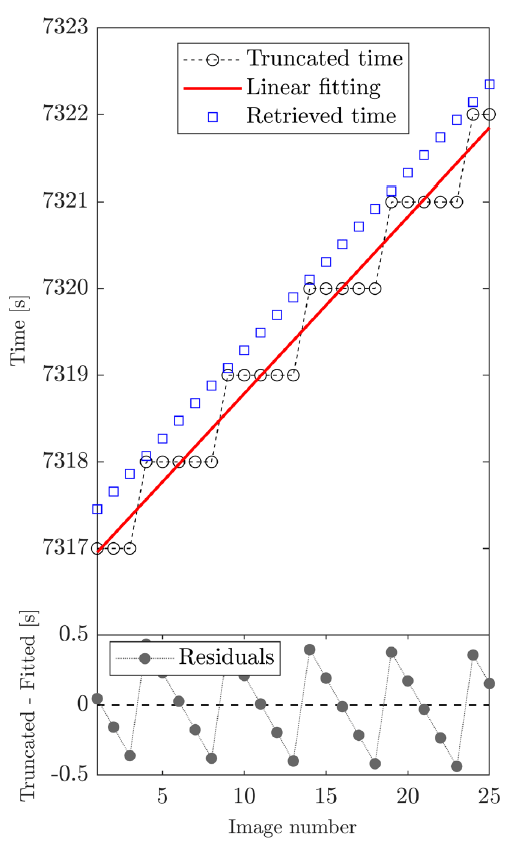
The image captures of the event, in addition to the accuracy given by the synchronization, require high precision in the stamped times. Despite the fact that some software truncates the seconds to only their integer when recording the time in the image header (as is the case with MaxIm DL), it is possible to retrieve the values of the fractions of seconds (Dias-Oliveira et al. 2017). For this, a straight line is fitted to the instants of time (j, tj) with which the acquisition cycle ν and a constant t0 are obtained. The residuals of this fitting show a saw pattern that oscillates between –0.5 s and 0.5 s, confirming the existence of the truncation and the periodicity of the acquisition cycle. The corrected times tf are obtained through Eq. (1) with a precision that depends on the square root of the number of photos. Fig. 5 shows, in blue, the times tf that were obtained when applying the method described above to a set of timetruncated photographs taken every 200 ms. It should be noted that the times stamped by the control software generally correspond to the beginning of the capture, so they must be offset to correspond to the mid-time of each capture.
The differential light curve of a positive occultation detection has a series of characteristics that are key to distinguishing it as positive: the moment at which the drop in magnitude begins, due to the blocking of the star’s light as the small body passes; the moment at which that drop in magnitude ends; and the magnitude of this drop. In our case, to carry out the described analysis by differential photometry, we imported the photometric reports produced by FotoDif using MATLAB’s own routines. If the event detection is determined to be positive, we continue with block 9; otherwise, we continue with block 15 (which will be described later). In block 9, a dataset centered on occultation is selected and subsequently normalized.
The analysis of the light curve allows us to establish the key parameters of an occultation; from these parameters it is possible to determine the morphology of the occulting small body, in our case as a measure of its diameter. These parameters are obtained by fitting a model to the acquired curve. In our methodology, we use a simple square well model, which represents the edges of the object’s shadow in the geometric optics regime. This means that the transition, whether of immersion or emersion, occurs between a point of full flux and minimal or no flux (Buie et al. 2020a). This model, represented by Equations (2) and (3), expresses the flux recorded as a function of time t, parametrized by the drop in normalized flux ΔA, the central time of the occultation tc and the duration of the occultation δt.
where:
The above model considers the stars as point sources and ignores diffraction effects. Therefore, before its application, it is necessary to assume these conditions as a hypothesis to be validated (block 10 of Fig. 4). This is done by evaluating whether the integration time dominates the Fresnel diffraction effect and the effect of the diameter of the star.
To determine the magnitude of the diffraction effect, the Fresnel scale (Castro-Chacón et al. 2019) is used (represented in Eq. (4)), where λ is the observed wavelength and r is the geocentric distance of the object.
To determine the effect of the angular diameter of the star, its projection at the geocentric distance of the occulting object must be calculated. For this, it is necessary, first, to know the value of the said diameter θ, which can be estimated by converting the zero-magnitude angular size θV = 0 through Eq. (5) (Van Belle 1999). The term θV = 0 depends on whether the star is giant, variable, or main sequence. Thus, to determine the evolutionary phase of the star, we suggest using the spectral type and the luminosity class. If the star does not have these measurements, for calculation purposes, it is assumed to be a giant. The B, V and K magnitudes can be determined from the NOMAD catalog (https://vizier. u-strasbg.fr/viz-bin/VizieR?-source=I/297) (Zacharias et al. 2004).
Finally, considering that a small body moves on a celestial sphere at an angular velocity μ, the angle traveled in each image and at the geocentric distance r is translated into the distance measured on the small body. This distance can be calculated according to Eq. (6), where t is the exposure time. The r and μ values can be determined from JPL Horizons (Giorgini et al. 1997) (https://ssd.jpl.nasa. gov/?ephemerides) or from the MPC Ephemeris Service (https://minorplanetcenter.net/iau/MPEph/MPEph.html).
It is worth mentioning that if the small body has an atmosphere, the square well model is no longer applicable since the differential refraction effect must be considered (Elliot & Olkin 1996). For the case in which the diffraction and the angular diameter are substantial, the square well model is convolved with the Fresnel diffraction (Roques et al. 1987), the projection of the star’s diameter, the sensor’s bandwidth and with the integration time. For more information about this procedure, we suggest referring to Widemann et al. (2009).
As seen in block 11 of Fig. 4, our methodology proposes to fit the model to the N data, minimizing the χ2 function (Press et al. 1992), as represented in Eq. (7) in which Φi,obs is the value of the measured flux, σi is the uncertainty of the measured flux and Φi,cal is the value of the flux calculated through Eq. (2). To optimize the function χ2, we used the Downhill Simplex method (Nelder & Mead 1965). Once the values of the parameters that best fit the data have been found, we proceed with the calculation indicated in block 12.
From the fitted ΔA value, the drop in magnitude Δmi is determined through the difference of instrumental magnitudes found in Eq. (8).
From φ, it is observed that the immersion time ti and the emersion time te can be calculated with the fitted values tc and δt according to Equations (9) and (10).
With Eq. (6), using the fitted duration δt as input, the projection of the arc subtended by the object at the distance r, that is, the length D of the chord, is determined. If we assume the small body to be spherical and consider the uncertainty of the chord, it is possible to determine a lower limit dlim on the diameter of the object.
Additionally, assuming the shape of the object is spherical and its diameter is the calculated value D, it is possible to obtain an astrometric measurement of the small body at the time of occultation. This measurement is calculated using, for the times ti and te, the position (f, g) of the small body relative to the star projected on the sky plane (Elliot et al. 1978). The first step is to calculate the position (ξ, η) of the observer on this plane through Equations (11) and (12), where ϕ´ is the geocentric latitude of the observer; ρ is the geocentric distance of the observer; z is the height of the observer above sea level; h* is the hour angle of the star at time t; and α* and δ* are the star coordinates of right ascension and declination, respectively. Smart & Green (1977) indicate how to calculate both ρ and ϕ´, while h* can be determined by calculating the local sidereal time (Curtis 2013) and knowing the value of α*.
Subsequently, using Equations (13) and (14), the position (x, y) of the center of the shadow projected on the sky plane is determined, where αo and δo correspond to the coordinates of right ascension and declination of the object in the respective interest time.
The coordinates αo and δo can be obtained with the necessary precision by carrying out a polynomial fit of degree 2 to the object ephemeris, as indicated in Equations (15) and (16), where t is the mid-time of the fitted observations (Milani & Gronchi 2010).
Finally, the coordinates (f, g) are determined with Equations (17) and (18), where f and g are the relative position in right ascension and declination, respectively, with east and north as the positive directions.
The origin of the coordinate system of the sky plane corresponds to the position of the small body according to the ephemeris. The times ti and te lead to two sets (f, g) that represent the extremities of the recorded chord. Therefore, the central point (fc, gc) of this straight line is translated into an offset (Δαc cos(δc), Δδc) with respect to the position predicted by its ephemeris at tc.
Finally, as observed in blocks 14 and 15 of Fig. 4, the parameters of the occultation, as well as the calculated characteristics of the small body, are reported to the prediction source, while the event astrometry is reported to the Minor Planet Center (Details on the astrometry reporting process to the MPC can be found at https://www. minorplanetcenter.net/iau/info/Astrometry.html and in the references therein). If the detection is negative, the result and the conditions of the observation are reported.
3. RESULTS AND DISCUSSION
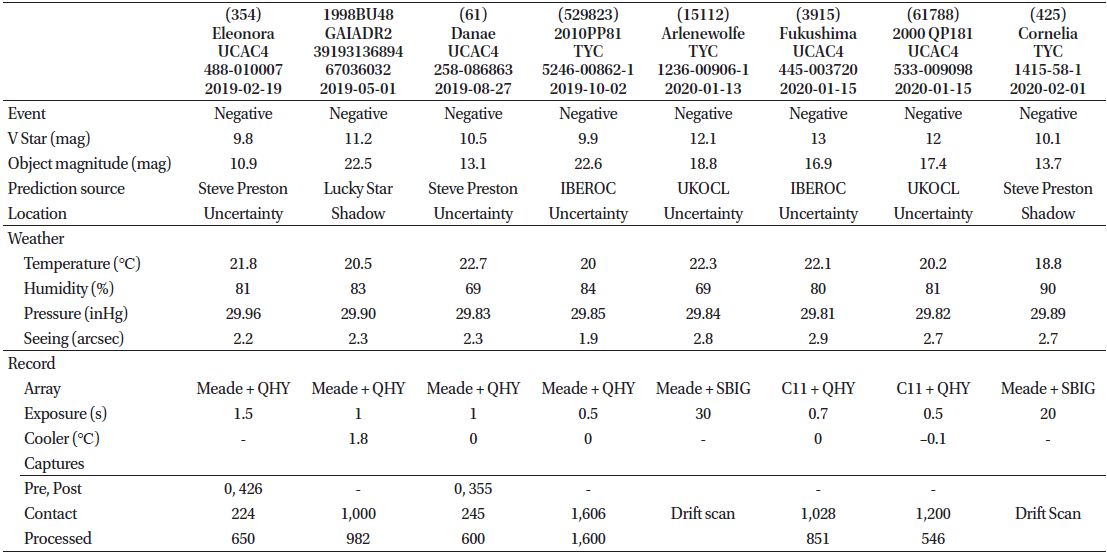
We applied our methodology to the observation of 11 stellar occultations due to MBAs and TNOs from the OAUTP using fixed and mobile stations. Eight of the events were negative, 6 of which were occultations by MBAs ((354) Eleonora (61) Danae (15112) Arlenewolfe (3915) Fukushima (61788) 2000 QP181 and (425) Cornelia), and 2 of which were occultations by TNOs (1998BU48 and (529823) 2010 PP81). In Table 2, we present detailed information for each of the negative events. The light curves built from the observations of the negative events are condensed in Figs. 6 and 7. The differential light curves of the events captured as photosequences are presented in black in Fig. 6, while Fig. 7 shows, in brown, the light curves of the events recorded with the drift scan technique. The curves are centered on the predicted tc value. The vertical dashed lines in red indicate the limits that result from the duration and error estimated by the prediction. These curves show that the events are negative since a drop in flux considerably greater than the standard deviation is not identified within the time interval given by the prediction.
|
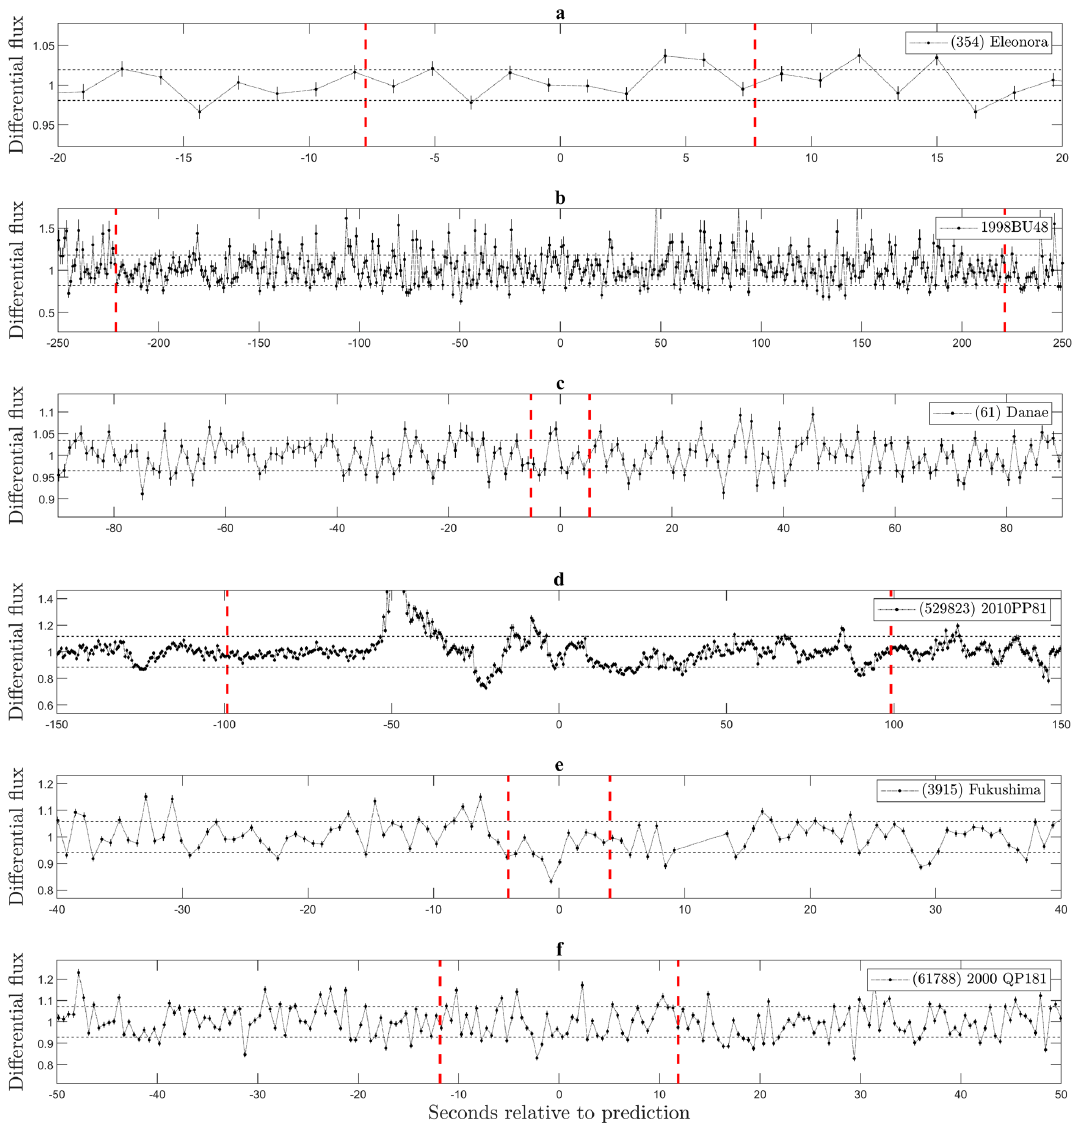
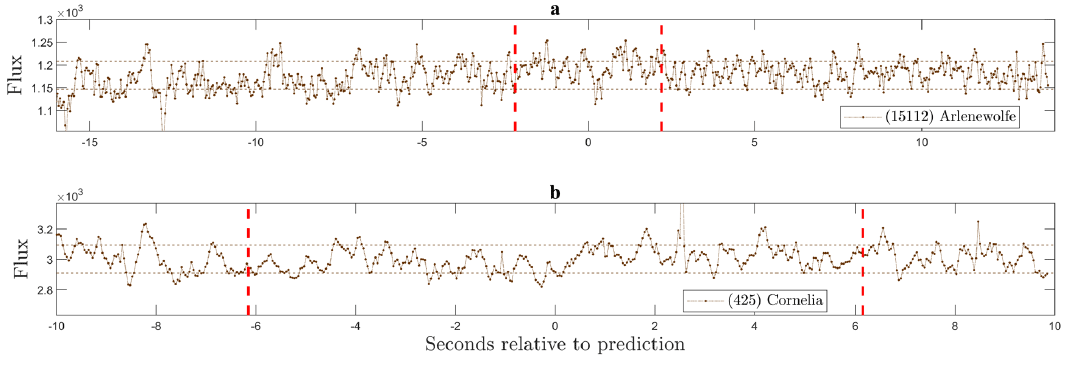
The common denominator in most of our negative events is that we were not in the nominal path of the shadow but within the uncertainty region. The above was true for negative events except for the events given by the centaur 1998BU48 and by the MBA (425) Cornelia, for which we were within the nominal path of the shadow. The negative detection of the 1998BU48 event is explained by considering that the uncertainty in the projected distance was 2,505.6 km. Despite the fact that other observers participated in this campaign, no positive record of the event was reported. The (425) Cornelia event presented low uncertainty, and our station was 8 km from the centerline; therefore, the negative detection could be explained by a 1.5-σ shift in the shadow path. The light curve of the event by (529823) 2010 PP81 (Fig. 6, part d) shows high variability as a consequence of the climatic conditions at night. However, from its behavior, the event can also be concluded as negative. The event by (61788) 2000 QP181, in addition to being recorded using the mobile station, was complemented with a drift scan photograph using the Meade + SBIG array. However, with a star very close in α on the same level of δ, the resulting drift scan image was not noteworthy, as the trails of both stars overlapped.
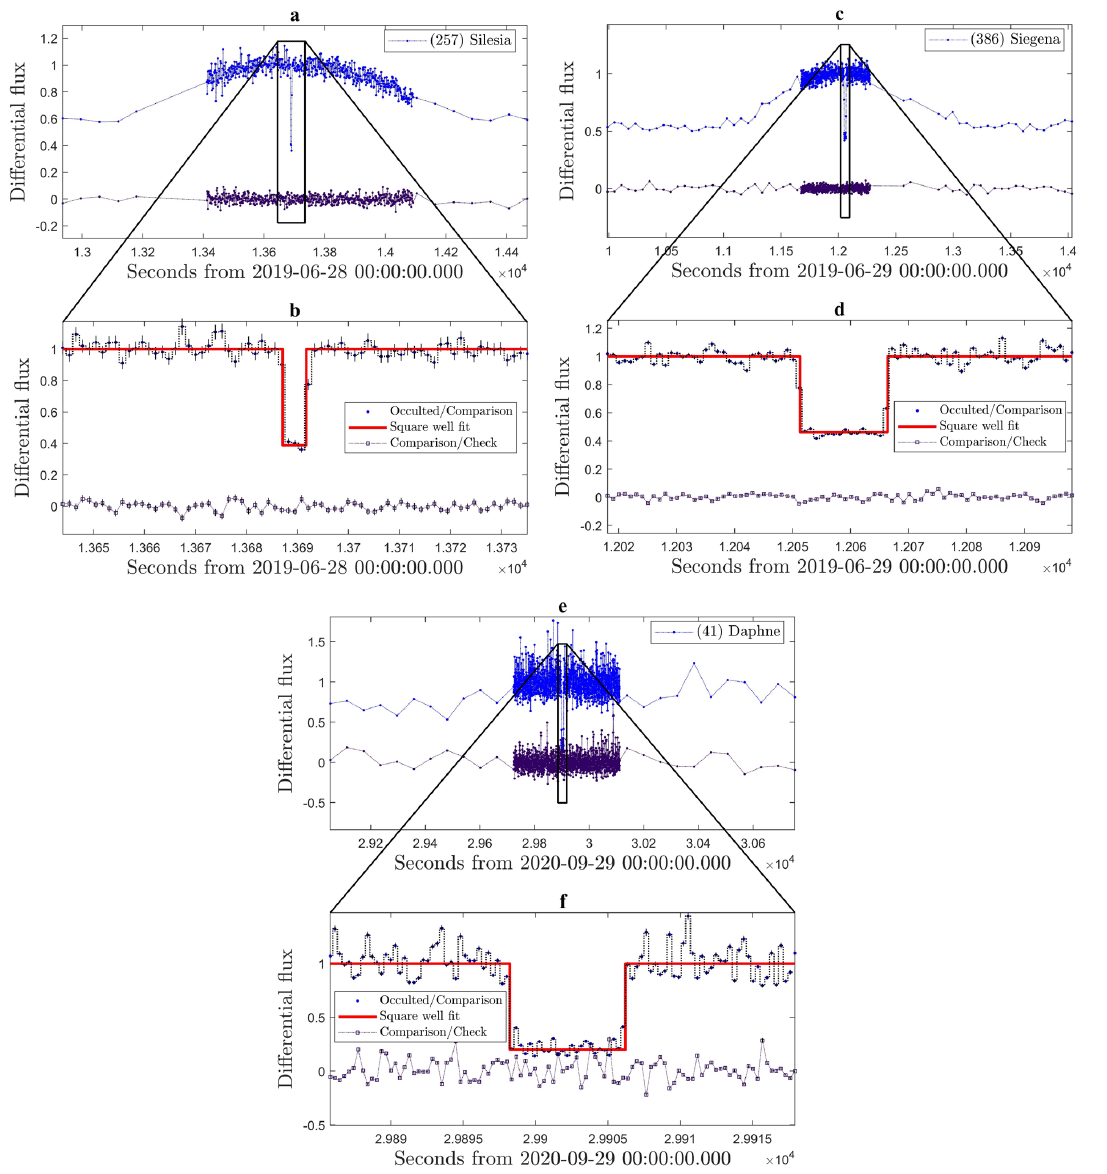
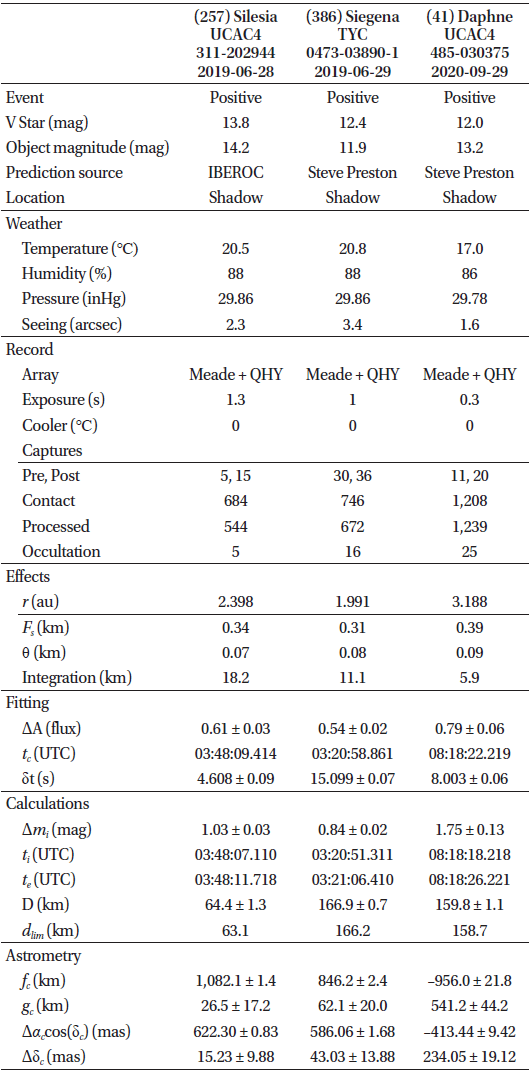
The positively detected events were the occultations by MBAs (257) Silesia (386) Siegena and (41) Daphne. The general details of these events and the technical information of the observation sessions can be found in Table 3. In the (257) Silesia and (386) Siegena events, prior to the beginning of the captures, we increased the exposure times initially programmed to avoid the loss of the SNR in the stars of interest, considering the presence of cloudiness at the beginning of the captures. This prevented us from registering events at a higher frame rate and, consequently, with a better spatial resolution than the resultant images. The event of (41) Daphne was recorded with almost the maximum resolution allowed by the star’s magnitude and the detector-telescope array. After data reduction and processing, we performed differential photometry and derived the light curves shown in Fig. 8, in which the spaced capture intervals (pre- and postcontact) and the continuous interval (contact and occultation) are observed. For each of the events, the r and μ values were determined from the JPL, while the V and K magnitudes were determined from NOMAD. Using a typical wavelength of λ = 650 nm, we calculated the Fresnel diffraction effect (Eq. (4)) for the three events. We calculated the angular diameter of the star using Eq. (5) and its projection to the geocentric distance of the occulting object, in addition to the resolution, in kilometers, obtained for the exposure time used (Eq. (6)). These effects are summarized in Table 3, from which we conclude that in all three cases, the integration time dominates over the diffraction effect and the star diameter, which validates the application of the square well model. For the calculation of the star’s diameter effect, we assumed all three target stars as giants. This assumption has an intrinsic error, for our events is ± 0.02 km. Considering this error, the effect of the star diameter is still the lowest, ~1/3 of the Fresnel diffraction effect.
|
Regarding the event of (257) Silesia, the parameters obtained by minimizing the χ2 function (Eq. (7)) and the calculations derived from them are found in Table 3. The correspondence between the fit and the data are observed in the light curve in part b of Fig. 8. The blue dots indicate the center times of the photographs, and the horizontal dotted lines represent the integrated interval. The prediction estimated a drop of 1 magnitude and a maximum duration of 5.5 s; in addition, our location was 6 km from the centerline. According to our results, the duration was δt = 4.608 ± 0.09 s, while the drop in magnitude was Δmi = 1.03 ± 0.03 magnitudes (Eq. (8)).
Using Eq. (6), we determined that the distance measured on the object was D = 64.4 ± 1.3 km. With this value, we obtained a lower limit of dlim = 63.1 km for the object diameter. Despite being unable to estimate the diameter of (257) Silesia, we can compare the above results with measurements in the literature. There are numerous techniques and analysis methods used for determining the diameters of small bodies. According to Carry (2012), these methods can be grouped into 4 categories: absolute magnitude, thermal modeling of infrared radiometry, direct measurements of a single geometry (such as stellar occultations or adaptive optics) and shape modeling based on several geometries (such as light curve inversion). For asteroid (257) Silesia, previous records are found in the Planetary Data System (PDS) (https://sbn.psi.edu/pds/ resource/occ.html) stellar occultation database (Herald et al. 2019); however, from these, it is only possible to obtain lower limits of the diameter. In contrast, there are measurements derived from observations from IRAS (Tedesco et al. 2002), AKARI (Usui et al. 2011) and NEOWISE (Masiero et al. 2017), of 72.66 ± 2.2 km, 79.20 ± 0.97 km and 76.873 ± 17.449 km, respectively; these values represent the volume-equivalent diameter as determined through the fitting of thermal models. Comparing these values, the recorded chord length is consistent with the indirect measurement determined from NEOWISE, and our lower limit agrees with the presented values.
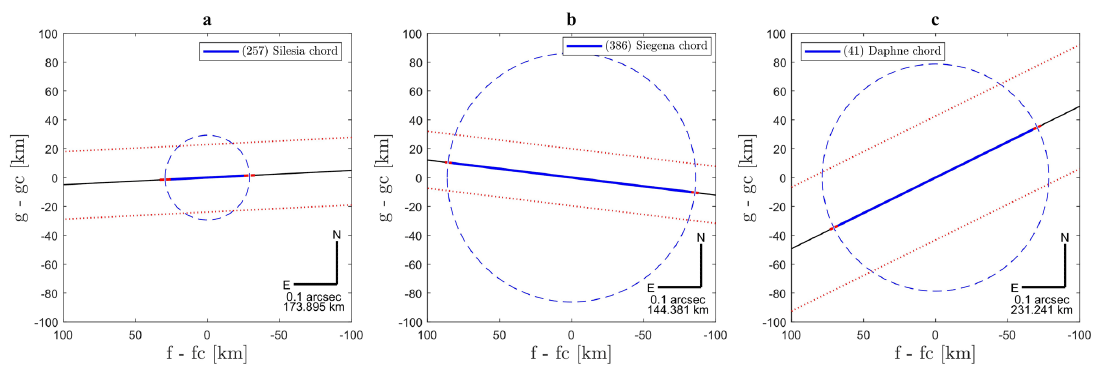
Assuming that the shape of (257) Silesia is spherical and that its diameter is the length of the measured chord, we projected the asteroid onto the sky plane. First, we calculated the values of ρ, ϕ´ and h*; from these, knowing that the height of the OAUTP is z = 1,450 meters above sea level and using Equations (11) and (12), we calculated ξ and η. The latter were calculated for the times ti and te, determined with Equations (9) and (10). From Horizons JPL, we generated the small body ephemeris for an interval centered on time tc, and the data obtained were fitted to Equations (15) and (16) to interpolate, with precision, the αo and δo values at both moments of interest. Subsequently, we used Equations (13) and (14) to calculate x and y, with which it was possible to determine the coordinates (f, g) using Equations (17) and (18). These coordinates represent the extremities of the recorded chord in the sky plane. The value of the central point (fc, gc) can be found in Table 3. Fig. 9 shows the projection of the asteroid in the sky plane. The blue dashed circle represents the object according to the assumed shape and size. The solid blue line represents the chord, and the solid red line indicates the uncertainty associated with the time. In dotted red, the uncertainty associated with the location of the real center of the asteroid is indicated. Finally, knowing that the distance at which the object was 0.1 arcsec corresponds to 173.895 km, we determined that the correction to the ephemeris in right ascension is Δαc cos(δc) = 622.30 ± 0.83 mas and the correction in declination is Δδc = 15.23 ± 9.88 mas. These values indicate the difference between the position determined by the ephemeris and the position in which the object actually was.
When fitting the square well model for the (386) Siegena event, we found the characteristic parameters of the light curve; these parameters are summarized in Table 3 and can be compared with the light curve in Fig. 8. We were 30 km from the central line according to the prediction. The estimated maximum duration was 16.2 s, and a 0.5-magnitude drop was predicted. As observed in Table 3, we recorded a drop in magnitude of Δmi = 0.84 ± 0.02 magnitudes.
The recorded duration of the Siegena event was δt = 15.099 ± 0.07 s, which represents a measured chord of D = 166.9 ± 0.7 km with dlim = 166.2 km as the lower limit of the diameter. Within the literature, there are several measurements of the diameter of the asteroid (386) Siegena. The IRAS, AKARI and NEOWISE missions report volume-equivalent diameters of 165.01 ± 2.7 km, 201.17 ± 3.52 km and 198.377 ± 72.296 km, respectively. The diameters determined by this type of observation, being model-dependent, are not very accurate; however, they are many in number thanks to the observations of the satellites that have mapped the sky in the mid-infrared. There are previous records in the stellar occultation database of the PDS; two were multiple-chord events of special quality that allowed elliptical fitting, and the record with the highest accuracy determined a volumeequivalent diameter of 178 km. Stellar occultations, by directly measuring the shape of the occulting small bodies, are characterized by the derivation of diameters with great accuracy. In general, stellar occultations provide 2-D constraints because, due to their high temporal location and considering the irregularity and rotation of the asteroids, it is only possible to record the profile of the occulting object in one of all possible geometries. The only exceptions are the largest small bodies, which can be approximated to simple rotational ellipsoids. This leads us to the last category for the determination of sizes in the small Solar System bodies: shape modeling based in multiple geometries. Marciniak et al. (2012) determined the shape of the asteroid (386) Siegena using the light curve inversion method. This method uses previous stellar occultations of the object to calibrate the obtained model. In this case, Marciniak et al. (2012) obtained two possible solutions with a mean value of 180 ± 25 km. Hanuš et al. (2017) used a different inversion method to determine the shape and size of (386) Siegena. In this case, they started from resolved images of the asteroid taken with adaptive optics and combined these images with rotational light curves and stellar occultations, thus obtaining a volume-equivalent diameter of 167 ± 5 km. The 3-D models of asteroids, including those of (386) Siegena, obtained by inversion techniques are published in the DAMIT database (https://astro.troja.mff.cuni.cz/ projects/damit/) (Durech et al. 2010). The value obtained by us is consistent with the measurements previously reported (except with the value calculated by AKARI) and is especially close to the value calculated by the last method presented, which is considered more accurate than the values obtained by other methods.
After making the assumptions of the size and shape of the asteroid based on the length of the measured chord, we calculated, for the times ti and te, the coordinates (f, g) with which we constructed the projection of the asteroid (386) Siegena on the sky plane (Fig. 9, part b). The values (fc, gc) are found in Table 3, as well as the offset in right ascension and declination (Δαc cos(δc), Δδc). This offset of 586.06 ± 1.68 mas and 43.03 ± 13.88 mas was calculated with consideration of the corresponding scale of 144.381 km per 0.1 arcsec.
The occultation of (41) Daphne was recorded with the star at almost the limit of SNR given the exposure time used. This maximum integration resolution was not enough to detect the effects of Fresnel scale and star’s diameter, as can be seen in Table 3 and part f of Fig. 8. The results of the square well model fitting for this event and the subsequent calculations are shown Table 3. The prediction estimated a magnitude drop of 1.5 mag and a maximum duration of 9.4 s. Our location was 46 km from the expected centerline. We measured a drop of Δmi = 1.75 ± 0.13 magnitudes and found δt = 8.003 ± 0.06 s of duration. The asteroid (41) Daphne has a small satellite of < 2 km but the prediction did not provide the path of its shadow. Even if it had been provided, our spatial resolution would not have been enough to detect it.
From the fitted duration, we derived a chord length of D = 159.8 ± 1.1 km and a lower limit of dlim = 158.7 km for the object diameter. IRAS, AKARI and NEOWISE report for (41) Daphne volume-equivalent diameters of 174.00 ± 11.7 km, 179.61 ± 2.58 km and 184.783 ± 60.202 km, respectively. The PDS report several occultation detections for this object, the best multi-chord event among them derived, through elliptical fitting, a volume-equivalent diameter of 185 km. There are measures of (41) Daphne diameter using shape modelling, Hanuš et al. (2017) calculated a volumeequivalent diameter of 188 ± 5 km, while Carry et al. (2019) recently found a value of 187 ± 21.5 km, both combined light curve inversion with data of adaptive optics and stellar occultations. Our value as a lower limit is consistent with these previous reports.
Assuming that (41) Daphne is spherical and that its diameter is equal to our recorded chord, we projected the asteroid’s shape on the sky plane (Fig. 9, part c). The offsets (fc, gc) and (Δαc cos(δc), Δδc) between the real center and our detections are found in Table 3. The offset in angular values, for right ascension (–413.44 ± 9.42 mas) and declination (234.05 ± 19.12 mas) were calculated with a scale of 231.241 km per 0.1 arcsec.
4. CONCLUSIONS
The methodology presented here explains the essential processes (planning, data capture and treatment) for making observations of single-chord stellar occultations due to small Solar System bodies. These processes were described in such a way that they can be followed even by inexperienced observers with basic knowledge of astronomy. Therefore, this work represents an important tool for communities of professional and amateur astronomers and allows these communities to participate continuously in the observation of stellar occultations and, with this, in the international networks of collaborative work.
The stellar occultations positively detected during the application of the methodology allowed us to characterize all three occultations and establish, from these characterizations, lower limits of the objects’ diameters. In each event, the right ascension and declination offset for the asteroid ephemeris was determined and was reported to the Minor Planet Center. All positive and negative occultation detections and derived calculations were reported to the corresponding prediction sources. The OAUTP occultation observation program, during its execution, recorded the first stellar occultation by a small body positively detected from Colombia and participated in the campaign to observe the stellar occultation by (486958) Arrokoth; these represent two events of noteworthy relevance in the Latin American context. Our objective is to positively detect future occultations by TNOs, apply models that consider diffraction, and positively detect an event using both stations simultaneously to determine the objects’ morphology more precisely from these two chords than would be possible with a single chord.


