


1. INTRODUCTION
Coronal mass ejections (CMEs) are explosive solar phenomena that trigger geomagnetic storms in two different ways when they arrive at Earth. Firstly, the southward magnetic field component of magnetic flux rope in corresponding interplanetary CMEs (ICMEs) may reconnect with the northward magnetic field component of Earth’s magnetosphere (Gosling 1990). Secondly, high-speed, dense plasma may also compress the geomagnetic field and act as dynamic pressure (Kim et al. 2013). As human activities in space and the number of space assets expand exponentially, the impact of CMEs and preparation for their arrival are becoming increasingly important. Hence, various studies on CME parameters and related consequences have been performed in recent decades (Kim et al. 2005;Kim et al. 2008;Choi et al. 2017;Kim & Chang 2019). Interplanetary (IP) space is filled with background solar wind, which is essentially a plasma stream that is constantly blowing out from the sun and permeating the entire heliosphere. When CMEs propagate through IP space, their speed and direction may be affected by interaction with this solar wind or other CMEs (Manoharan et al. 2004). Such interactions often contribute to the ambiguities in space weather prediction.
To understand the interaction process between CMEs and background solar wind, as well as the consequent evolution of disturbances in IP space, a large number of studies have been performed including kinematic and magnetohydrodynamic (MHD) simulations (Chen 1996;Odstrcil 2003) and empirical relations (Dryer 1994;Gopalswamy et al. 2001;Moon et al. 2002;Kim et al. 2007). For these types of model simulations, the initial CME conditions are needed. Therefore, we employ instruments such as the Large Angle and Spectrometric Coronagraph (LASCO) onboard the SOlar and Heliospheric Observatory (SOHO), which has continuously monitored CMEs within the range of 1.5 to 32 Rs over the past two decades (Brueckner et al. 1995), and allowed us to study not only CME physical properties, but also the effects of space weather in close proximity to Earth.
However, we are now facing several difficulties with determining CME geo-effectiveness. Future stable monitoring of CME cannot be guaranteed since LASCO’s operating period already has been exceeded, and there is no plan to replace it. Additionally, although there are numerous existing space-based observations (Rollett et al. 2016;Möstl et al. 2017), we still lack direct observations of IP space beyond the LASCO field-of-view (FOV). Since CME propagation speed can be modified by interactions with background solar wind, CME arrival time may also be affected, and this may degrade the geomagnetic storm forecast, increasing ambiguities when the storm occurs. In this regard, IP scintillation (IPS) is a useful remote sensing technique which can be used to study solar wind in the heliospheric region from 0.2 to 1 AU. Observations of solar wind in this region are essential to explain CME evolution. For example, Iwai et al. (2019) have suggested that the accuracy of CME arrival time may be improved if MHD simulations could include IPS observation data.
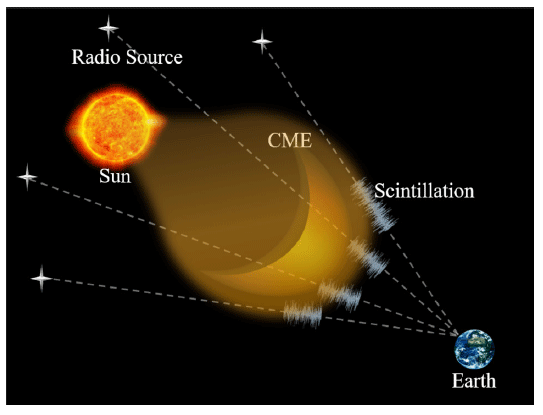
Several radio telescope arrays (Coles & Kaufman, 1978;Tokumaru et al. 2003;González-Esparza et al. 2004;Manoharan et al. 2017;Morgan et al. 2019) actively monitor IPS on a large-number grid of compact radio sources every day, and detect CMEs and ambient solar wind plasma by estimating the turbulence of radio sources for all heliographic latitudes at a range of distances from the sun to 1 AU. As illustrated in Fig. 1, CMEs and/or any disturbances of solar wind in the line-of-sight (LOS) block the observation of the radio source. Previous studies on IPS have focused on the 3-dimensional (3D) structure of CMEs (Tokumaru et al. 2003) or confirmation of ICME arrival as a means of forecasting geomagnetic storms, using an IPS estimation based on a global MHD simulation of the inner heliosphere (Iwai et al. 2019).
In this study, we present an algorithm for tracking CME propagation, leading to estimation of CME speed based on IPS g-values obtained from single-station observations. CME speeds were determined based on the assumption that the density enhancement at a CME’s leading edge may be observed as a high g-value. The algorithm functions by performing daily forecasts and giving the updated forecast during a CME’s propagation. The IPS g-value is given by g = mε/<mε>, where mε and <mε> correspond to the observed scintillation index, m, and the expected mean value at a certain solar elongation, ε, for a given source (Gapper et al. 1982;Jackson et al. 1998;Tokumaru et al. 2000). Section 2 describes the data and methodology used to develop this algorithm. We present a reproduction of CME propagation and forecast results in Section 3, as well as statistical evaluation. A discussion and summary are presented in Section 4.
2. DATA AND METHODOLOGY
To track CME propagation, and to obtain the updated speed and arrival time at Earth every day, we developed an algorithm that calculates the range of expected CME position and selects the maximum g-value within the range as a proxy for the CME speed. The main procedure of the algorithm is the analysis of IPS observation data in the corresponding time and location.
The flow speed in IP space was derived from multiple IPS observations from different stations based on the assumptions that 1) density irregularities in the solar wind propagate at the speed of its bulk motion (Armstrong & Coles 1972), and 2) if we use as many radio sources as possible, the IPS observations will give more accurate global information on the solar wind (Gapper et al. 1982). The Institute for Space-Earth Environmental Research (ISEE) in Nagoya University provides multi-station IPS measurements of the solar wind ranging back to the early 1970s. ISEE observes about 30 to 40 radio sources per day at the frequency of 327 MHz, which corresponds to a 92 cm wavelength and is optimized to survey the heliosphere. This enables the collection of solar wind information of several tens of points within 0.2 AU and 1 AU once per day.
Since cross-correlation analysis of multi-station IPS data is needed to derive the solar wind speed (Coles & Kaufman 1978;Kojima & Kakinuma 1990), only limited data are available. In contrast, the scintillation level g-value may be obtained from any given source at any given single station (Tokumaru et al. 2000). Assuming that fluctuations in solar wind density parameterized by g-values are related to the location of the CME, we can estimate the CME propagation speed. As the g-value is normalized to the turbulence level of the quiet solar wind, a g-value larger than 1 would indicate an excess of density fluctuation, while an abrupt increase in the g-value would indicate the passage of CMEs or any irregularities along the LOS.
The g-values used for tracking and forecasting historical CMEs were obtained from ISEE. Furthermore, since real- time data was also provided, the algorithm was also used for real-time forecasting. IPS observation of ISEE started at 21 universal time (UT) of the previous day and ended at 9 UT of the current day. The IPS data consisted of the source name, date and time (UT) of observation, radial distance of P-point from the sun (AU), heliocentric latitude and longitude of the P-point (degree), and g-value.
Fig. 2 shows the flowchart of the algorithm for forecasting near real-time CME speed and arrival time. The algorithm was performed at 9 UT on a daily basis if a CME was detected in the LASCO FOV during the previous 24-h time window. If a CME occurred, the algorithm performed daily forecasts until the time of the CME’s arrival, using IPS observations. The first D-day forecast results were used as updated input data for the second D+1-day forecast. Assuming that the density enhancement at a CME’s leading-edge may be observed as a high g-value, the position of the maximum g-value, gM was selected as the location of CME’s leading edge.
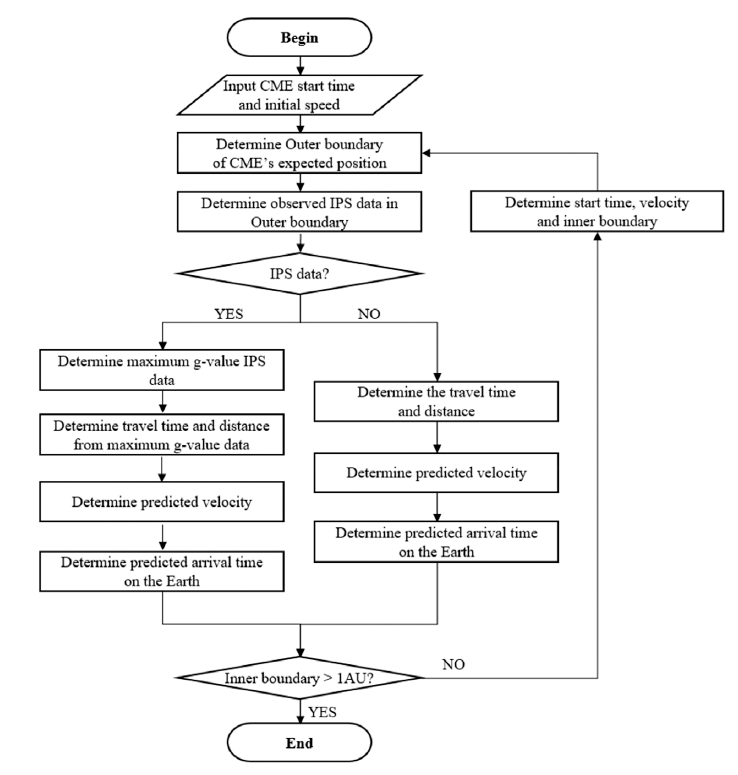
For the D-day forecast, the initial time, ti and speed, vi of the CME at a position di were measured by LASCO coronagraph observations. The Coordinated Data Analysis Workshop (CDAW) LASCO CME Catalog (https://cdaw.gsfc. nasa.gov/CME_list/index.html) was used to develop the algorithm, while for the real-time forecast, ti, vi, and di were determined directly from SOHO/LASCO real-time images (https://sohowww.nascom.nasa.gov/data/realtime-images.html). In order to track the CME’s leading edge, the algorithm located gM between the inner and outer boundaries, defined as Ri and R0, where the CME was propagating. Ri and di for the first day were 0, and R0 was determined by
where, Tf is the forecast time. If R0 was less than 0.2 AU, which is the inner-limit of the IPS data, then the algorithm stopped the process and retained R0 as the Ri+1 for the next day’s forecast. R0+1 was then recalculated with a new Tf.
If IPS observations were available, then the algorithm selected gM. The position dM and time tM of gM were then used to calculate the CME’s speed, vp and its arrival time, tp as
and
For all equations, distance and time were in units of km and s. Forecast values of vp and tp, and distance and time for gM, dM and tM were used as input values for the D+1-day forecast. If the inner boundary, Ri, was larger than 1 AU, this indicated that the CME had already arrived at Earth and the algorithm stopped. The algorithm then repeated the forecast and gave daily updated CME propagating speed, vp and arrival time tp, until the CME arrived at Earth.
3. FORECAST OF CME ARRIVAL
To validate our algorithm, we performed one case study on a real-time CME propagation and also a statistical study of the CME speed and arrival time forecast using CMEICME pairs.
Fig. 3 shows an example of a CME-ICME pair. The left panel is a running difference image of white-light CME observation by LASCO/C2. A halo CME was observed on the LASCO coronagraph at 20:26 on October 2, 2000 with an initial speed of 569 km/s, and the event was associated with an M-class flare in an active region on N27W51. As indicated by the red line, the leading edge appears to be heading southwest.
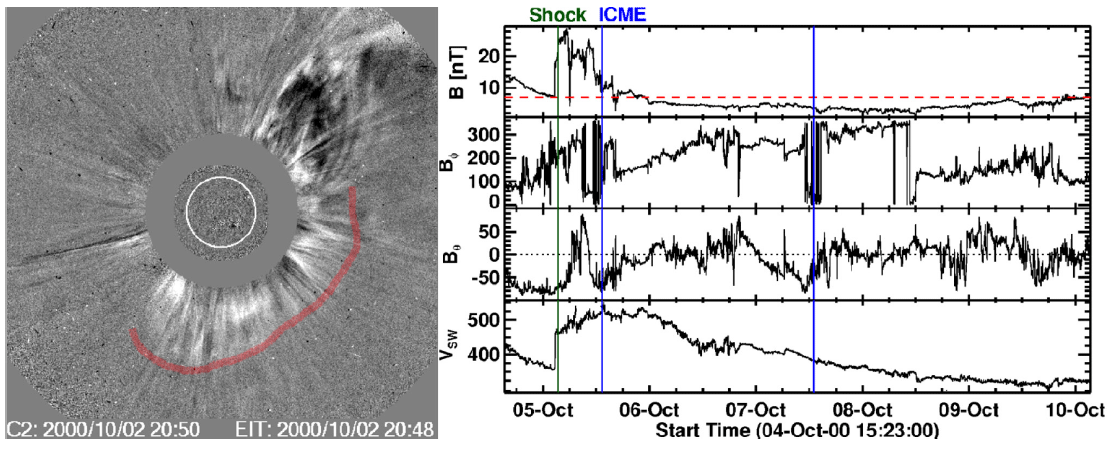
To find out if the CME actually arrived at Earth, we reviewed the Advanced Composition Explorer (ACE) solar wind data. The right panel of Fig. 3 shows an arrival of an ICME with the preceding shock. The determination of shock and ICME arrivals followed the ICME data table provided by CDAW (https://cdaw.gsfc.nasa.gov/meetings/2010_ fluxrope/LWS_CDAW2010_ICMEtbl.html). There was a shock structure starting at 03:23 UT and an ICME starting at 13:13 UT. Assuming that the ICME was the consequence of the halo CME event, then the mean 1 AU transit speed (mean speed) was found to be 756 km/s. We also confirmed the CME’s arrival by the geomagnetic field response, such as the Dst minimum and Kp index. The minimum value of the Dst index was –181 nT at 14 UT on October 5, and the maximum Kp index was 8 at 6 UT and 12 UT on that same day.
In spite of multi-station observation, IPS velocity data was available for only 36% of radar sources during the daily observation for this event. However, the IPS g-value data exist continuously from October 3 to October 5, making our algorithm extremely useful even when there is a lack of IPS velocity observation data. In Fig. 4, g-maps for three days are illustrated. In each map, the center is the position of the sun, while white circular lines represent the distance from the sun, increasing by 0.2 AU from the center outwards. The colored circles on the all-sky map of g-values indicate observation point projections on a 2-D plane using the heliocentric latitude, longitude, and radial distance of the observed source. The green dotted line in each map indicates the outer boundary, R0, for the forecast.
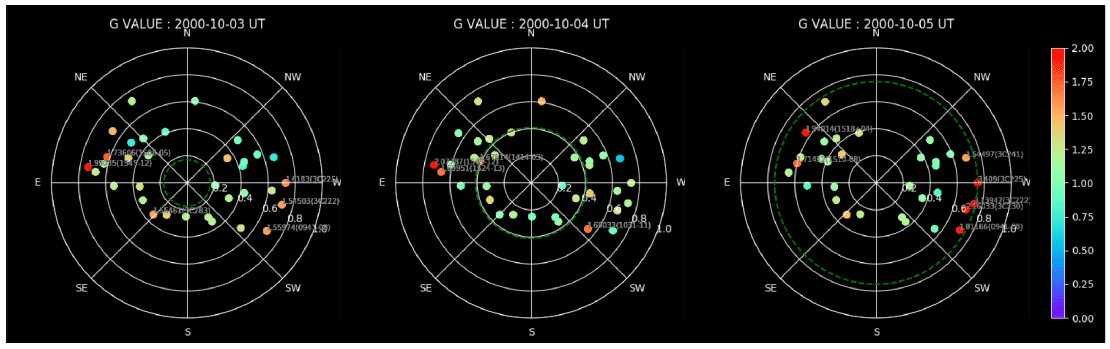
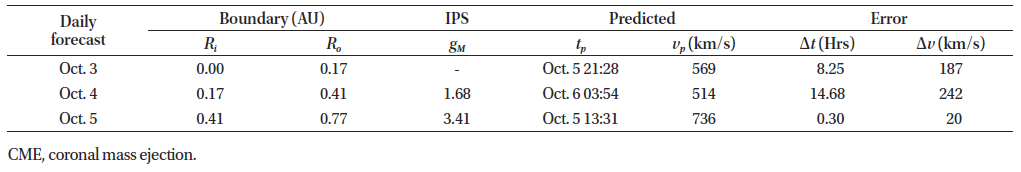
As shown in the left panel, there were no g-values inside of the R0 on October 3. Therefore, the algorithm predicted that the CME would arrive at 21:28 UT on October 5 with the same speed of 569 km/s. Then the forecast stopped and waited until the next day’s forecast. For the second day forecast, we selected 1.68 as the gM in the range of 0.17 AU and 0.41 AU, as marked by the green dotted line. Relatedly, there were several points having higher g-values outside of this range as shown in the middle panel; however, there was the possibility that they represented effects by other CMEs, so they were not used. Based on the selected gM value of 1.68, the predicted arrival time was 03:54 UT on October 6 with a speed of 514 km/s. For the third day forecast, we selected 3.41 as the gM in the range of 0.41 AU and 0.75 AU, as shown in the right panel. From this, we expected that the CME would arrive at 13:31 UT on October 5 with a speed of 736 km/s. When the CME arrived on October 5, the algorithm stopped the forecast.
Table 1 summarizes the forecast results for all three daily forecasts, and demonstrates that the last updated forecast provided a relatively accurate prediction, with errors of 18 mins and 20 km/s for the arrival time and speed, respectively. Note that even though there were no g-values for October 3, and the g-value for October 4 gave larger errors, the last updated g-values for October 5 yielded the most accurate forecast.
|
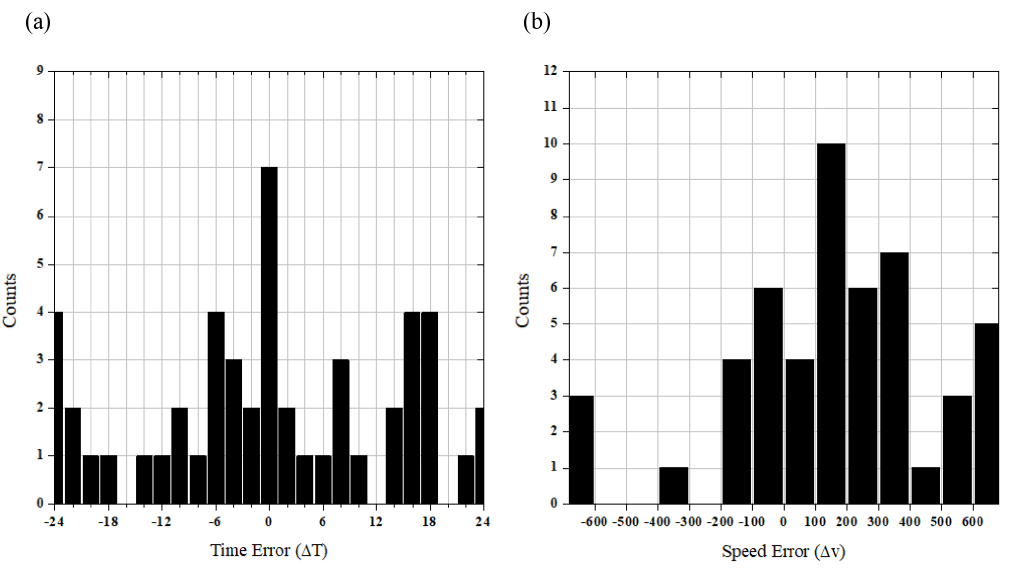
To evaluate the algorithm, we performed the forecast of CME arrival time and speed using CME-ICME pairs provided by Cane & Richardson (2003;http://www.srl. caltech.edu/ACE/ASC/DATA/level3/icmetable2.htm), who compiled information for ICMEs which arrived at Earth and affected the magnetosphere. Among the pairs, we selected 50 events that satisfied the following conditions: Firstly, that IPS g-value data were available during the full dates of CME origin to arrival; and secondly, that the previous day’s prediction speed was between 280 km/s and 3,387 km/s, which are the minimum and maximum values, respectively, of the 1 AU transit speed in the pairs. Unrealistic forecasts, such as arrival time being earlier than forecasting time, were excluded. Fig. 5 shows histograms for the errors of arrival time (a) and speed (b), for which the average values are 11.14 h and 310 km/s, respectively.
4. DISCUSSIONS AND CONCLUSIONS
The algorithm was verified using three daily storm forecasts of propagation for a real-time CME event which occurred on October 2, 2000. Results demonstrated that we could track CME propagation based on g-values of IPS observation provided by ISEE, and the algorithm was able to successfully forecast the CME arrival within errors of 18 mins arrival time and 20 km/s speed. Statistical evaluation of the algorithm was also carried out in the form of geomagnetic storm forecasting using 50 selected events from the CME-ICME pairs provided by Cane & Richardson (2003), and yielded average errors for arrival time and speed of 11.14 h and 310 km/s, respectively.
The main advantages of our algorithm may be stressed as follows. By using IPS observation, we show that it is possible to track the CME propagation, which cannot be obtained by image observation alone. Additionally, CME speed may be calculated using g-values from single station observation data. Therefore, our algorithm can give stable, daily forecasts of CME position and speed during CME propagation in the region of 0.2 AU and 1 AU, even if there are insufficient IPS velocity observations.
However, we also note that this algorithm could benefit from improvements regarding the time resolution and spatial distribution of g-value observations. For example, the observation data is provided only once per day, and the time resolution of the forecast is therefore only one day, resulting in the inability to forecast CME arrivals that take place in less than 24 hours. In addition, for the CME event on October 2, 2000, the IPS data were distributed mainly in the east-west direction and therefore did not give results for the leading edge in the southern part of the coronagraph image. This indicates that the resulting gM may not have been the true maximum.
Nevertheless, IPS data is considered meaningful for CMEs of moderate speed. Since the halo structure in the whitelight coronagraph image was a shock signature generated by the CME propagation, it was therefore isotropic in IP space. Compared to this, IPS observation gives a truer representation of moving material which may be causing turbulence. This is also true for non-halo CMEs with invisible shock fronts.
We emphasize that our results show that continuous g-values obtained from any single station observation may be used for space weather investigation, and especially for geomagnetic storm forecast. By using g-values, this algorithm can provide stable, daily forecasts of CME position and speed during CME propagation in the region of 0.2 AU to 1 AU, even in the case of insufficient IPS velocity observation data. We expect that this algorithm may be easily applied to space weather forecasting in the near future.