1. INTRODUCTION
It is well known that there are no global magnetic fields on the Moon, but many places exhibit localized magnetic fields ranging from tens to hundreds of nanoteslas. These local magnetic fields may interact with the solar wind to produce mini-magnetospheres of several tens of kilometers in size. Since the solar wind does not penetrate into the magnetosphere and moves around it or is reflected from it, both the magnetic fields and the plasma density increase on the surface of the magnetosphere (Bamford et al. 2012). The mini-magnetosphere formed on the surface of the moon may protect human activities from the dangerous solar wind to some extent. Hence, finding such mini-magnetospheres is just as important as finding water (Kim et al. 2018). Nevertheless, lunar mini-magnetospheres have never been observed directly: only a few cases of circumstantial evidence exist such as increase in magnetic field called limb compression (Lin et al. 1998) and scattered energetic neutral atoms above a magnetically anomalous region (Wieser et al. 2010).
Some of the regions with strong magnetic fields match the whirlwind-shaped bright areas tens of kilometers in size, known as lunar swirls (Garrick-Bethell et al. 2011;Glotch et al. 2015;Hemingway & Tikoo 2018;Lee et al. 2019). The reason why the lunar swirls look bright is presumably because the weathering effect has been less at those features than in the surroundings. Given their association with magnetic fields, the formation of lunar swirls may be considered the result of some form of interactions between the solar wind and the magnetic field and hence, they may be closely related to the formation of mini-magnetospheres. For example, differences in the motions of solar wind electrons and ions can generate electrostatic fields, which may cause dust transport and affect surface characteristics.
Several simulation studies have investigated the formation of lunar mini-magnetospheres. In early days magnetohydrodynamic (MHD) simulations were performed (Harnett & Winglee 2000), but the MHD explanations for the physical phenomena of the mini-magnetospheres were not quite valid because the size of the mini-magnetospheres was not large enough to ignore the difference in electron and ion motions. Hence, most of the recent studies were based on the particle-in-cell (PIC) or hybrid simulations (Harnett & Winglee 2002;Kallio et al. 2012;Deca et al. 2014, 2015; Zimmerman et al. 2015). Deca et al. (2014, 2015) conducted three-dimensional full kinetic and electromagnetic simulations for a lunar crustal magnetic anomaly to show the formation of a mini-magnetosphere above a dipole, which was driven by electron motions. Further, they noticed back-streaming ions, the deflection of magnetized electrons, as well as the formation of a halo region of enhanced density around the dipole. Zimmerman et al. (2015) performed kinetic simulations for a region as small as 3 km wide with a strong crustal magnetic field and showed that charge separation of magnetic origin produced an electric potential difference of ~kV over a height of less than 200 m.
In this paper, we present the results of a PIC simulation study, to better understand the microphysics of the solar wind interaction with the sunlit side magnetic anomalies. We especially focus on the formation of a mini-magnetosphere as well as the effect of charge separation caused by the difference in electron and ion motions. The present paper is organized as follows: The simulation model is described in Section 2, and results and discussions are given in Section 3, followed by a brief summary in Section 4.
2. SIMULATION MODEL
In principle, the explicit PIC codes must be run with small temporal steps and cell sizes that resolve the Langmuir oscillations and the Debye length, respectively. Therefore, a large amount of computational resources are required to identify the phenomena that occur in spaces much larger than the Debye length or much slower compared with Langmuir oscillations. Further, such long duration simulations may not return correct results because of the accumulated numerical errors. These limitations may be overcome by adopting implicit schemes: Hence, we adopted the iPIC3D code (Markidis et al. 2010) for the present simulations. The main features of the iPIC3D code are as follows.
The iPIC3D code solves the second-order Maxwell equation, which is the curl-curl equation supplemented by a divergence constraint (Jiang et al. 1996;Ricci et al. 2002). In this scheme, electric fields at grid points are evolved via implicit moments (charge and current) defined at the grid points, and the implicit moments (charge at time tn+1 and the current at time tn+1/2) are obtained by making use of charge, current, and pressure tensor at time tn. The new electric fields are interpolated to the particle positions based on the Taylor expansion (Vu et al. 1992). Inserting the moments into the second-order Maxwell’s equations, the field equation becomes
where μ is the implicit susceptibility tensor, I is the identical matrix, and are the modified source terms (Markidis et al. 2010). After the En+1 is calculated using Eq. (1), the magnetic fields are obtained by the Faraday’s law,
Particles are also pushed by an implicit scheme using the below equations (Ricci et al. 2002)
The plasma parameters in the present study were basically the same as those adopted in Deca. et al. (2014) with slight modifications due to the limited computing resources: The solar wind velocity was 350 km/s and the thermal velocities were 81.9 km/s for ions of 35 eV and 1,310.0 km/s for electrons of the same temperature with ion-electron mass ratio of 256. The plasma density was taken to be 3 cm-3, and the solar wind magnetic field was 3 nT. The corresponding ion skin depth di was 130 km. A magnetic dipole oriented in the x direction was assumed to be located at y = –0.1 di (~13 km) below the lunar surface. The dipole moment was taken to be 1.12 × 10¹² Am2, which corresponds to a larger dipole moment when the Reiner Gamma anomaly is modeled with two dipoles.
We performed both three-dimensional and two-dimensional simulations. The purpose of the three-dimensional simulation was to examine the global morphology of the min-magnetosphere, while the two dimensional simulation was conducted to understand the local structure with higher resolution. The two-dimensional simulation was carried out by removing the z direction from the geometry of the three-dimensional simulation: It corresponds to a structure in which the magnetic dipole is repeated in the z direction. The two-dimensional field strength was determined so that the two-dimensional field had a magnetic null point at the same location as that of the three-dimensional case in the antiparallel case (see Section 3).
The simulation parameters for the three-dimensional run were chosen as follows: the simulation box size (Lx, Ly, Lz) = 1.0 di, 0.5 di, 1.0 di), the grid number (Nx, Ny, Nz) =(64, 32, 64), the grid size Δx,y,z is 1.56 × 10⁻² di, the time step 1 Δt = 0.05 , and the total number of time steps Nt = 30,000, which corresponds NtΔt = 1,500 . The number of particles per cell was 256 for each species. For the two-dimensional simulation, we used a larger simulation box with higher resolution: (Lx, Ly) = (1.0 di, 1.0 di) and (Nx, Ny) = (256, 256). Therefore, the grid size in the two-dimensional simulation was Δx,y = 3.90 × 10⁻³ di. We employed perfect conductor conditions for the fields at all of the boundaries. At the top boundary (y = 0.5 di in 3D and 1.0 di in 2D), new particles having random thermal speeds and drift speed were injected, while they escaped the simulation domain when they reached the bottom boundary (y = 0.0 di). Outgoing particles were reflected at the side boundaries.
3. RESULTS AND DISCUSSIONS
Fig. 1 shows the results of the three-dimensional simulation with the solar wind magnetic field antiparallel to the dipole field: (a) ion density on the lunar surface at 1 pi t = 250 and (b) ion density on the central cross section of x = 0.5 di at t = 250 , 500 , and 700 . In Fig. 1(a), it can be seen that mini-magnetosphere is formed on the lunar surface. The ion density inside the mini-magnetosphere is significantly lower than the solar wind density, indicating that a cavity is formed. In addition, the magnetopause portion of the mini-magnetosphere is observed to be very thin, comparable to the electron skin depth, which is 1/16 of the ion skin depth for the ion-electron mass ratio of 256.
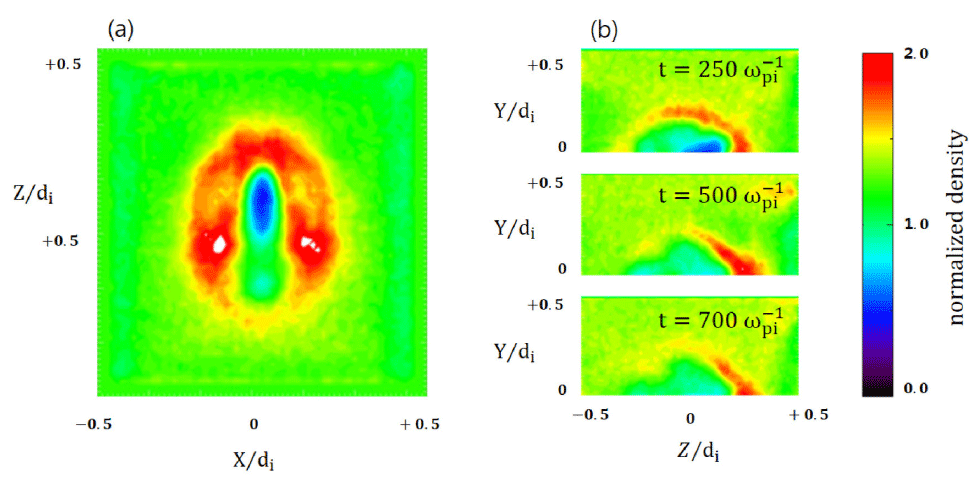
The structure of this mini-magnetosphere was not stable and slowly faded over time, as shown in Fig. 1(b): the density in the magnetopause decreased gradually from the maximum value of t = 250 . This seems to be consistent with the findings in Deca et al. (2014) that mini-magnetospheres can be unstable by mirror instability. In addition, unlike the magnetopause of the Earth, the surface of the mini-magnetosphere shows no shock structure even though the solar wind is supersonic. This suggests that the formation of a mini-magnetosphere or magnetopause is caused by electron dynamics, not an MHD phenomenon, which is formed by the (magnetic) pressure of the magnetosphere and the solar wind. The mini-magnetosphere seen in this three-dimensional simulation was asymmetrical on the plane parallel to the lunar surface, which could be the result of the E × B and gradient B drifts.
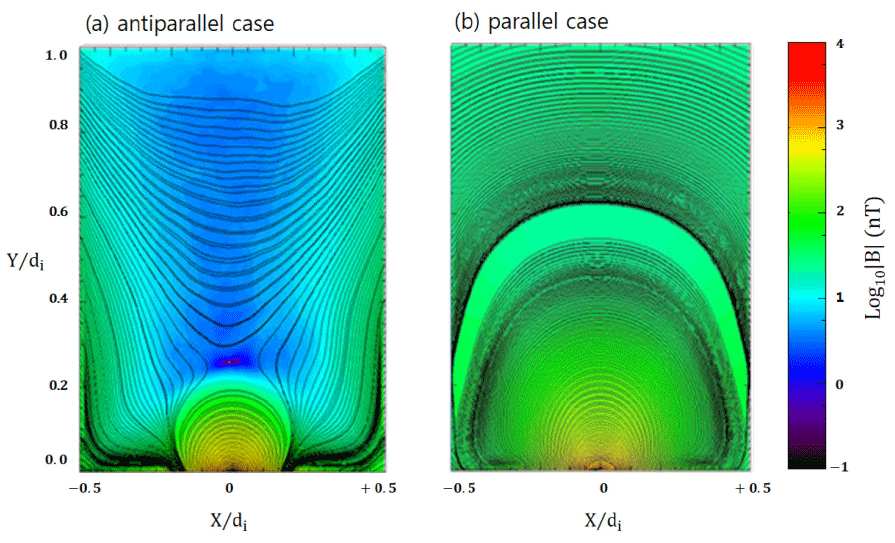
Two-dimensional simulations were performed with the solar wind magnetic field parallel and antiparallel to the dipole field, as shown in Fig. 2. First, as seen in Fig. 2(a), there was a minimum B point in the anti-parallel case. This minimum B point is formed at an altitude of about 0.3 di (~40 km), which is consistent with the highest altitude of halo identified in the plasma density plot (shown in Fig. 3). Below this area is the dipole magnetic field whereas the upper part is occupied by the solar wind magnetic field. The field directions of the two regions are opposite to each other in this antiparallel case. In the parallel case in Fig. 2(b), the magnetic field structure is different from the antiparallel case: there is no minimum B point and the solar wind zone and the dipole zone are not distinguished in this plot of magnetic fields.
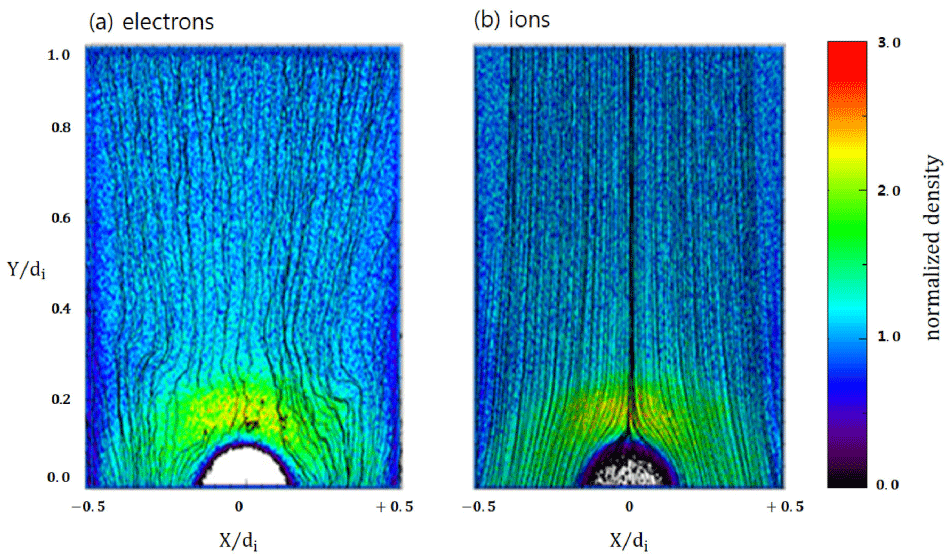
In Fig. 3 of the electron and ion densities and their streamlines, it is seen that a cavity area with low plasma density is well formed in the antiparallel case: The cavity is seen below the altitude of ~0.1 di (~13 km). The streamlines clearly show the deflection of both the electrons and ions around the cavity.
A magnetopause is formed over the region of ~0.1 to ~0.3 di (~13–40 km), which is larger in width compared with that of the three-dimensional simulation result. Electrons become turbulent in this region of the magnetopause, as can be seen from their streamlines whereas the ion plot shows well-defined streamlines. Although the electron and ion densities appear generally to be similar to each other, there is a very thin region just inside the magnetopause from ~0.08 di to ~0.1 di, where the ion density is higher than the electron density. This charge separation occurs when unmagnetized ions enter farther into the lower altitudes of the cavity than the magnetized electrons, which is consistent with the findings of Deca et al. (2014, 2015).
In the parallel case in Fig. 4, the magnetopause is seen below ~0.3 di (~40 km), but the formation of the density cavity is not as clear inside the magnetosphere as in the antiparallel case. A region of enhanced density is even seen deep inside the magnetosphere both in the electron and ion plots. Electron streamlines show turbulent motions in the magnetopause as well as inside the magnetosphere, while the ion stream lines are more or less well defined even inside the magnetosphere, where ion motions seem to follow the dipole magnetic fields.
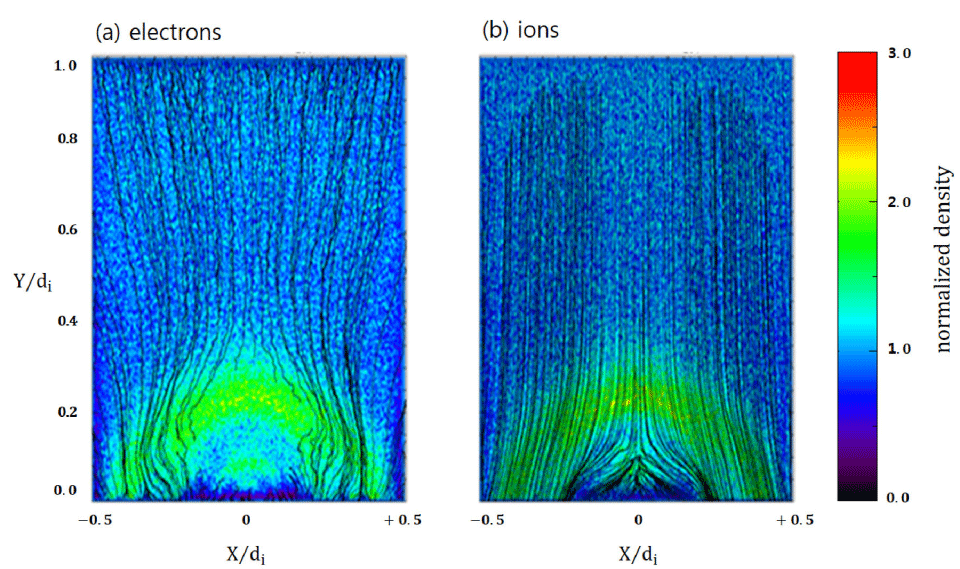
Fig. 5 shows the phase space plots of the three components of the velocities against altitudes (y direction) for the antiparallel case, with the velocities normalized by the solar wind speed (350 km/s). First, it can be seen that the electron distributions in the x and y directions become broad below ~0.3 di, which means that the electrons are thermalized in the magnetopause region. We believe there are two origins of this thermalization. One is mirror reflection (Fermi acceleration), as indicated by Deca et al. (2015). The other is magnetic reconnection, since the field strength is so small in the reconnection region that the electron motions are not organized by the magnetic field, whereas the streaming motions of the original solar wind flow are blocked by the dipole field.
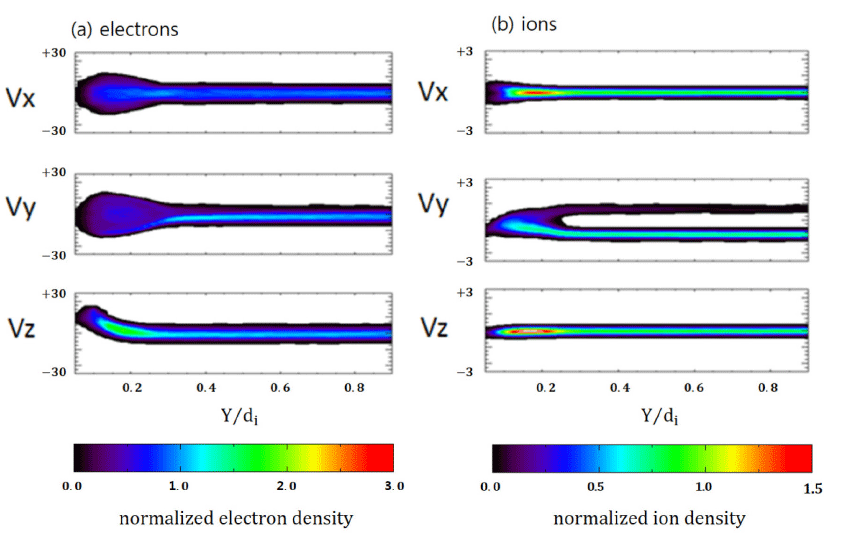
It is also seen that the Vz component increases below ~0.3 di. This is the result of the gradient B drift due to the variation in the strong Bx component in the y direction. The electron drift in the z direction generates an electron current that affects the magnetosphere in return. On the other hand, the ion velocities do not change significantly with altitudes in the Vx and Vz components, but have distinct characteristics in the Vy component. Ions are reflected in the vicinity of ~0.3 di and then move back to the +y direction, resulting in an electrostatic potential formed by the charge separation that is sufficient to reflect the incident ions. We counted the number of ions having positive and negative Vy just above y = 0.3 di. Approximately 10% of the incident ions are reflected, which is consistent with the observations of Saito et al. (2012) or the simulation results of Kallio et al. (2012) and Deca et al. (2014, 2015).
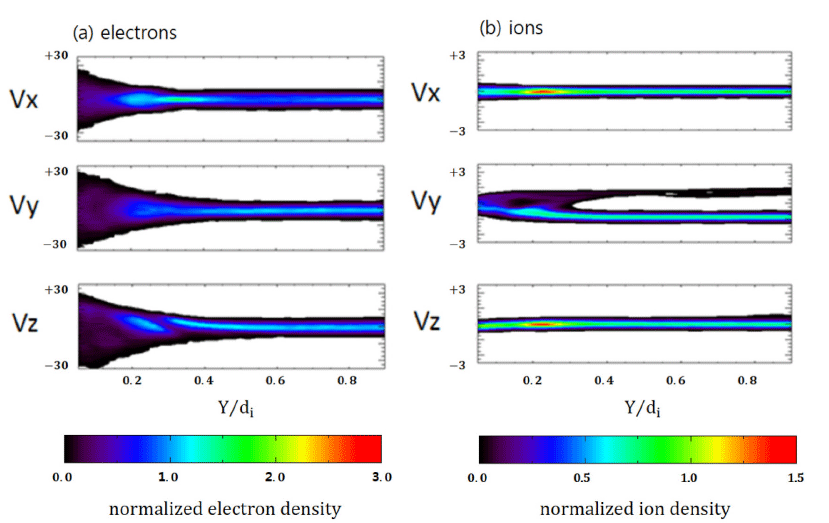
On the other hand, the electron motions in the parallel case, as shown in Fig. 6(a) where the velocities are normalized by the solar wind speed (350 km/s), are quite different from those of the antiparallel case. Thermalization of electrons occurs in all three components of Vx, Vy, and Vz over the whole region of the magnetosphere, and the velocity dispersion is approximately twice that of the antiparallel case. The electron gradient B drift is also observed in the Vz component, but it appears as a separate distribution in the altitude region of ~ 0.2–0.3 di. The ion velocity distribution in Fig. 6(b) is quite similar to that of the antiparallel case, except that the Vy component is more dispersed close to the lunar surface.
4. CONCLUSIONS
In this paper, two dimensional and three dimensional numerical simulations were performed using the iPIC3D code for the interaction between the solar wind and the Moon’s local magnetic fields. It was confirmed that a mini-magnetosphere was formed, and the magnetopause was very thin, corresponding to a few electron skin depths. Hence, the formation of the magnetopause is not due to the MHD effect, but is rather an electrical phenomenon. In the three dimensional simulation it could be seen that the mini-magnetosphere was not stable. In addition to thermalization, electrons were seen to make gradient B drifts, especially near the magnetopause, due to the difference in the magnetic field intensity between the solar wind and the dipole field. On the other hand, a small portion of incident solar wind ions were reflected at the magnetopause due to the electrostatic effect.


