


1. INTRODUCTION
Electromagnetic ion cyclotron (EMIC) waves have been thought to be the source of Pc1 pulsations in the Earth’s magnetosphere. The EMIC waves are known to be generated by anisotropic energetic particles (Tperp. > Tparallel). These are mostly represented by ring current particles with energies of few tens to hundreds of keV and, generated primarily in the equatorial inner magnetosphere (Kawamura et al. 1983;Bortnik et al. 2008;Nomura et al. 2011). These waves contribute to electron precipitations, leading to a loss of relativistic electrons from the radiation belt into the Earth’s atmosphere or to the precipitation of protons in the radiation belt (Lee et al. 2019). The wave energy propagates from the equatorial region to the ionosphere, these waves are observed as Pc1 pulsations on the ground (Miyoshi et al. 2008;Yahnin et al. 2009;Fraser et al. 2010;Yahnin et al. 2017). These waves, which have frequencies of 0.2–5 Hz, mode-convert to the right-hand mode in the high latitude ionosphere during their propagation along the magnetic field lines. Some of these waves are trapped in the F layer of the ionosphere and propagate horizontally to various latitudes along the wave-guide, which is centered on the F2 layer at an altitude ~350 km (where the electron density is maximized) (Kawamura et al. 1983;Bortnik et al. 2008;Fraser et al. 2010;Nomura et al. 2011;Nomura et al. 2012).
According to previous studies, the characteristics of EMIC waves can vary depending on latitude, altitude, solar activity, and the occurrence of geomagnetic storms. These waves occur mainly at mid-latitudes including the sub-auroral region. Observations by low earth orbit (LEO) satellites indicate, however, that the occurrence rate of Pc1 pulsations at high latitudes is reduced by strong auroral field-aligned currents (FACs), which masking the propagation of the waves (Park et al. 2013). In addition, the L value of the observing latitude is related to the magnetic local time (MLT). Events occurring at higher magnetic latitudes (MLAT) occur at later MLT sectors than lower MLAT events occurred. Moreover, Pc1 events are preferentially observed during the local winter at low to mid-latitudes and are slightly enhanced during the local summer. Whereas the difference between the June and December solstices in the northern hemisphere is quite large, that in the southern hemisphere is not significant (Park et al. 2013). Since the higher electron density of the F layer in the ionosphere hinders the propagation of EMIC waves, this layer leads to seasonal and diurnal variations in the EMIC waves (Kawamura et al. 1981). Pc1 pulsations are anti-correlated with solar activity and their occurrence rate significantly increases during the declining phase of the solar cycle; additionally, such relation may be phase-delayed by less than 1 year (Fraser-Smith 1970;Park et al. 2013). The Pc1 waves are also known to be related to geomagnetic storms. In fact, the enhanced ring current particles present in the inner magnetosphere during geomagnetic storms might provide favorable conditions for the generation of EMIC waves (Fraser et al. 2010;Min et al. 2012;Kim et al. 2018); according to recent studies, the generation of the EMIC waves would occur mainly during the storm recovery phase (Engebretson et al. 2008;Kim et al. 2018). Their peak occurrence is usually in 2–7 days after a storm at low-latitude regions (Kawamura et al. 1983;Bortnik et al. 2008;Engebretson et al. 2008).
Until now the propagation mechanism of the EMIC waves has not been clearly understood; however, it is important to know their characteristics in order to understand the processes. Several previous studies have focused on the spatial and temporal occurrence rate of Pc1 pulsations at mid latitudes. Here, we obtained somewhat similar results to but based on a different dataset covering ~one solar cycle and focusing on the characteristics of Pc1 pulsations observed from a mid-latitude ground station. In particular, we investigated the temporal (i.e., such as a diurnal, a seasonal and an annual) variations in these Pc1 pulsations between November 2009–August 2018 and compared them with the sunspot number (SSN) values for ~one solar cycle. These variations were observed using a Bohyunsan (BOH) magnetometer located at a mid-latitude ground station (L = 1.3). In addition, we examined the Pc1 pulsation properties (i.e., duration, a peak frequency, and a bandwidth) by statistical analysis. Finally, we investigated the correlation between Pc1 pulsations and geomagnetic storm phases.
2. DATA AND ANALYSIS
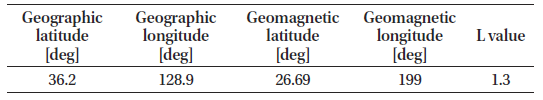
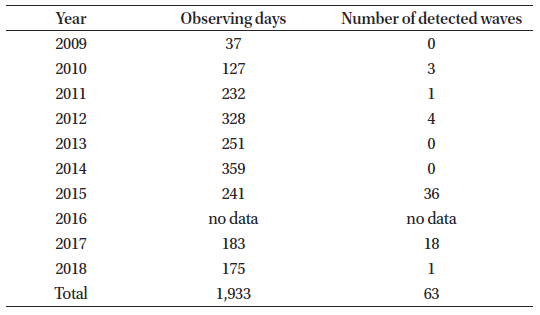
BOH magnetometer, which was installed by Korea Astronomy and Space science Institute in 2009 is still being operated (Hwang et al. 2011). This instrument is located inside the Bohyunsan Optical Astronomy Observatory at L = 1.3 (Table 1) and consists of a fluxgate magnetometer, an overhauser proton sensor, and a magneto-impedance (MI) sensor. For the present study, we used the data of the MI sensor; these consisted of three-axis magnetic field data recorded for 24 hours in universal time (UT) and at a sampling rate of 10 Hz (Hwang et al. 2012, 2013). The statistical characteristics of the Pc1 pulsations were investigated using the MI data obtained over ~one solar cycle (between November 2009–August 2018). More details about the dataset are provided in Table 2. Notably, no data were recorded in 2016 due to an unexpected breakdown of the instrument in 2016.
|
|
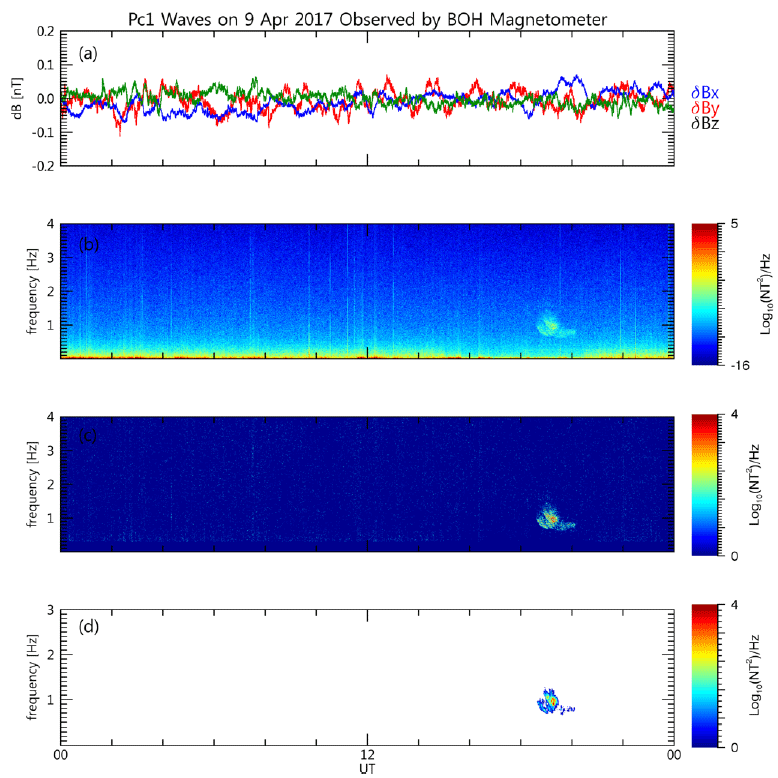
To detect the Pc1 waves, we performed a fast Fourier transform (FFT) with a window size of 1,024 data points and used the three-component magnetic field data (8,640 data blocks per a day at a 10 seconds time resolution in the frequency domain). The Pc1 waves were identified according to the method of Bortnik et al. (2007). To get rid of sharp noises, the artificial column-shaped signals were deleted by covering the whole intensity of the amplitude, and 7 × 7 median filter was applied to remove small speckle noises. Finally, the waves were detected by selecting bandwidths of and durations > 0.1 Hz and 1 minute, respectively. The method just described is the same preciously used by Kim et al. (2018). Fig. 1 shows one sample event on 9 April 2017. In particular, Fig. 1(a) depicts the deviation fluctuation of the three-axis magnetic field on that day, defined in terms of dBx, dBy, and dBz (dB is the deviation of <dB> – dB, where <dB> is the average value of the magnetic field on the specific day). Fig. 1(b), 1(c) and 1(d), show the different phases of the process through which it was possible to clarify the signal of the Pc1 wave. Three wave events were identified in this example once the signal was filtered by an automatic detection algorithm. Such algorithm has been applied in previous studies focusing on Sun–Earth connections (e.g., based on coronal mass ejection (CMEs) and solar wind propagation) (Choi et al. 2017). The first event started at 18:38 UT and lasted for ~53 minutes, the second started at 19:33 and lasted for ~11 minutes, and the third started at 19:48 UT and lasted for ~37 minutes.
3. RESULTS
Using our automatic detection method, we obtained a total of 63 events from 10 years data. Fig. 2(a) shows the number of Pc1 wave events with respect to the SSN variation during 2009–2018. This period corresponds to the solar cycle 24, which began in November 2008 and peaked around April 2014. Various geomagnetic effects might be caused by the solar cycle variation, including variations in the cosmic ray intensity on the ground (Park et al. 2018). As shown in the Fig. 2, the occurrence rate (i.e., the number of occurrences each year divided by the total number of occurrences over the 10 -year) peaked in 2015. The number of events noticeably increased in 2015 compared to 2014 (the year of solar maximum): the Pc1 waves occurred more frequently during the solar declining phase. Fig. 2(b) shows a seasonal variation in the number of observed Pc1 waves. Their occurrence primarily peaks in March and was slightly enhanced in August. Their results agree well with those obtained by the MSR station which is located at Moshiri, Japan (L = 1.5) (Nomura et al. 2011). However, we noticed a small temporal shift: in the MSR data, the peak occurrence was registered in February, followed by a secondary peak in July (Nomura et al. 2011); meanwhile, in our study, high waves occurrences were registered in both in late winter and spring. Notably, 56% of the events in March (22% of the total) occurred during the huge geomagnetic storm of March 17, 2015 (Saint Patrick’s Day storm). Fig. 2(c) shows the occurrence number of the events with respect to the MLT. The maximum value of wave occurrence was noted in the post-midnight sector ~3:00 MLT, while a secondary peak was verified in the dusk sector at ~18:00 MLT. In general, the daytime occurrence was lower than the nighttime occurrence.
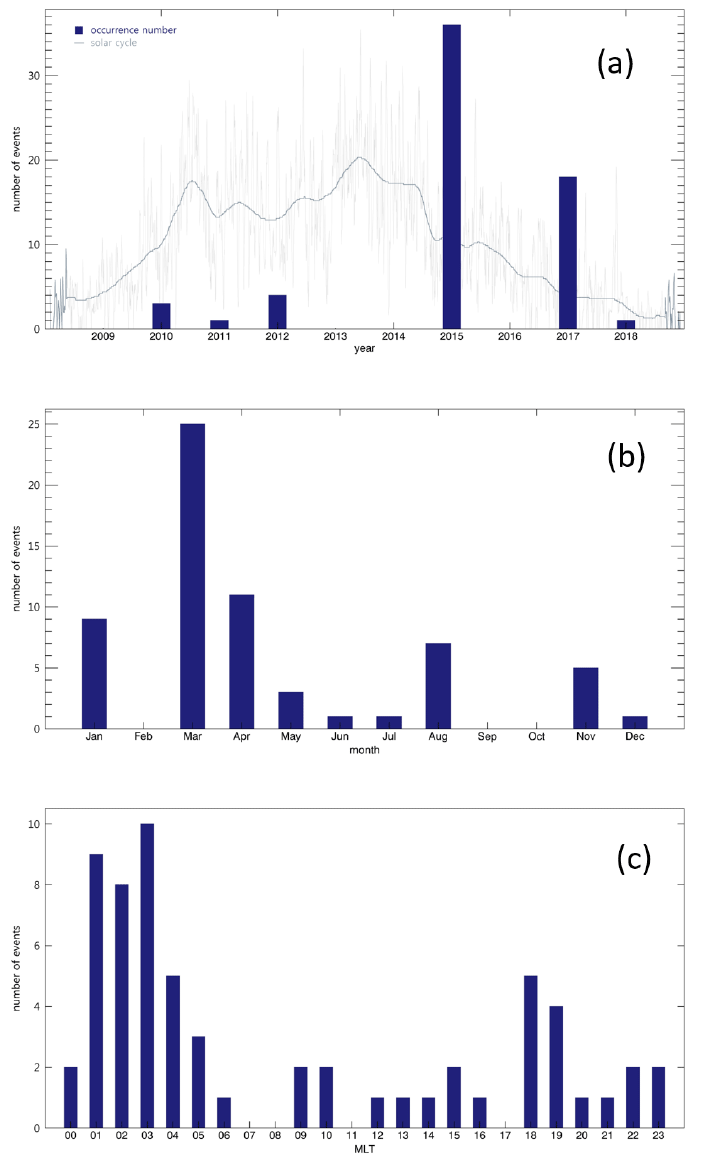
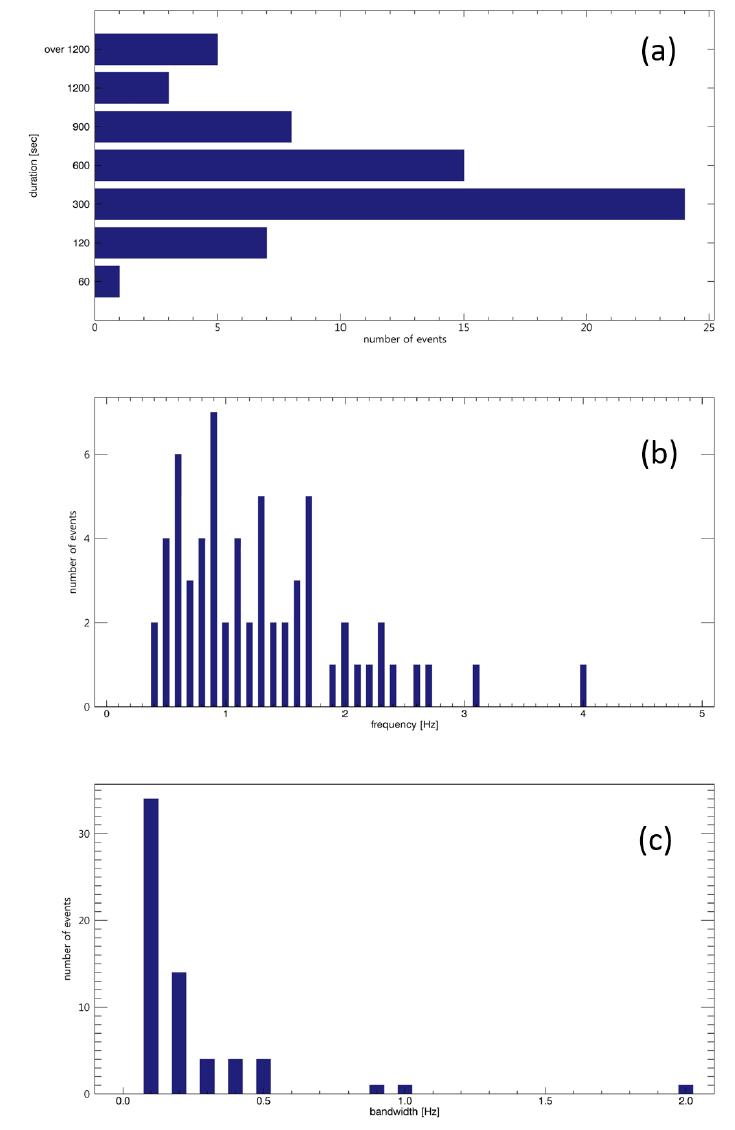
Fig. 3 shows the statistics of the Pc1 waves: their durations, peak frequencies and bandwidths. The wave events lasted mostly for 120–300 seconds (2–5 minutes) than for 300–600 seconds (5–10 minutes). On average, each event lasted ~547 seconds (~9 minutes). Most events had frequencies < 1.7 Hz, peak frequencies at ~0.9 Hz, moreover, they showed very narrow bandwidths (< 0.5 Hz). Some rare events, however, that had relatively wide bandwidths. Since our automatic detection algorithm cannot distinguish multi-events (characterized by multiple at the same time), such. Events were considered as a single one; thus, some bandwidth might appear to be wider than it really is.
4. DISCUSSION
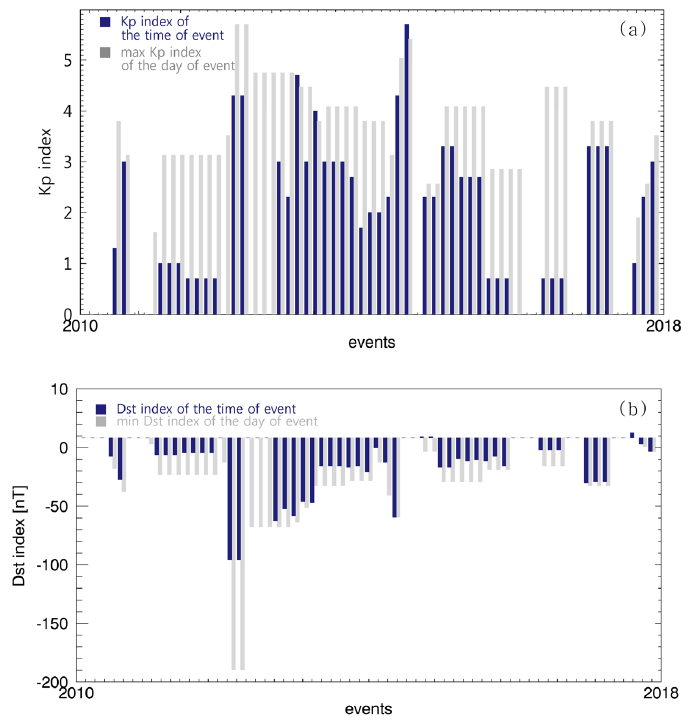
To investigate in detail the relationship between the Pc1 waves and the space environment, we compared the Pc1 waves with the geomagnetic indices Kp and Dst. Fig. 4 shows the values of these indices during the occurrence of each event (see the blue bars), as well as the maximum index value registered on the event date (see the gray bars). During most events, Kp < 3 and Dst > –30 nT. The maximum indices registered on the day of the event corresponded mostly to small values (i.e., Kp < 5 and Dst > –50 nT).
In addition, we investigated the possible relationship between the Pc1 waves and the geomagnetic activity by comparing the Pc1 waves with the geomagnetic storm. In this paper, we divided a geomagnetic storm into four phases: initial, main, early recovery, and late recovery. Our criteria for the classification of the storm phases were as following. First, we considered the minimum Dst index among those of < –50 nT and selected the point where the Dst value became > 0 nT. The interval comprised between that point and minimum index value was identified as the main phase. Then we traceback from the start point of the main phase, and selected the point where the Dst value became < 0 nT. The interval comprised between that point and the start of the main phase was identified as the initial phase. Additionally, the interval comprised between the end of the main phase and the point where the value became > 0 nT was identified as the recovery phase. In particular, the limit between the early and late recovery phases was identified at ~80% of the interval before the end of the recovery phase (see Fig. 5(a)).
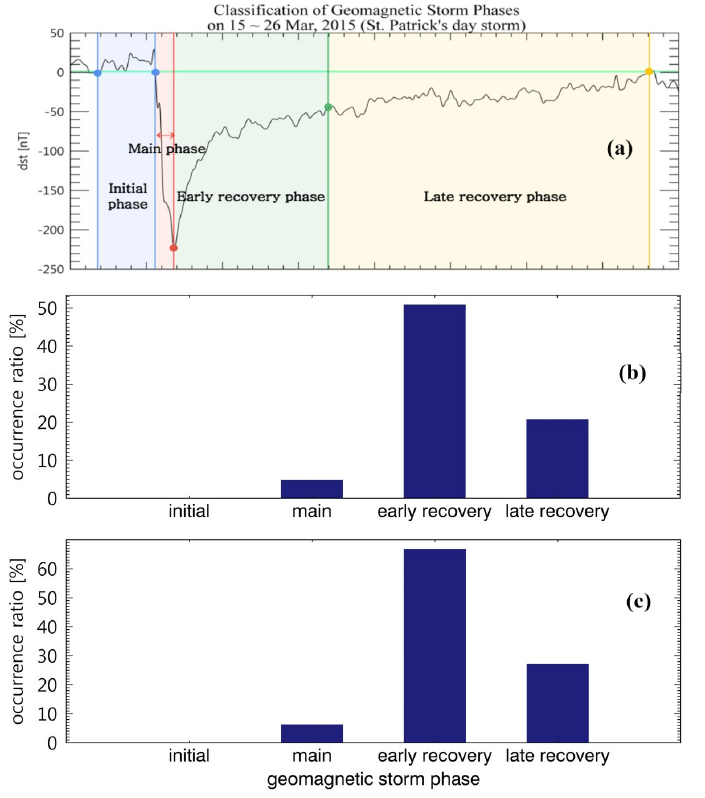
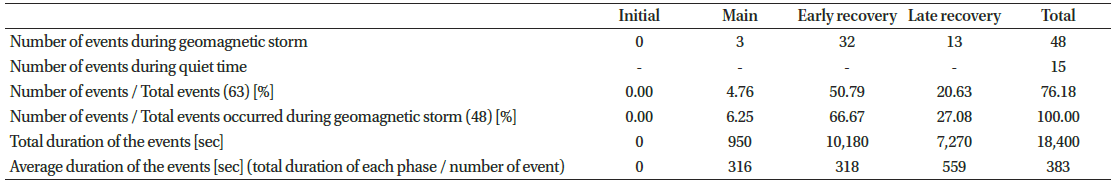
A total of 48 events (i.e., ~77% of all the events) were observed during geomagnetic storms (Fig. 5(b)). In particular, during the storm recovery phase, we detected 32 events (i.e., ~67% of the storm-related events). More than 50% of all the events occurred in the early recovery phase; in addition, ~5% of the events occurred in the main phase and no waves were detected in the initial phase. By normalizing the event occurrence data, we calculated the total and average durations of the events for each phase (Table 3). The initial phase corresponded to the shortest events, followed by the main, early recovery, and late recovery phases. Interestingly, the average duration of the events in early recovery phase was shorter than that in the late recovery phase. In other words, the Pc1 waves occurred most frequently in the early recovery phase, but the average duration of the events was the longest in the late recovery phase.
|
The results we obtained were similar but slightly different from those of Kim et al. (2018), who base their study on Swarm satellite data collected during ~3.5 years (from December 2013 to June 2017. In that study, the events were found to occur primarily when Kp < 4. This is consistent with our results showing a larger occurrence of events when Kp < 3. However, Kim et al. (2018) also showed that most events occurred during late recovery phase of the geomagnetic storms, which is inconsistent with our results (in a peak of events appeared during the early recovery phase).
5. CONCLUSION AND SUMMARY
In this paper, we analyzed statistically the Pc1 pulsations observed by the BOH magnetometer in Korea (L = 1.3) between November 2009–August 2018 for ~one solar cycle. Based on these data, we determined the global distribution characteristics of the Pc1 pulsations and their wave properties. In addition, we investigated their correlation with the geomagnetic activities. Our conclusions based on this study are as follows:
The occurrence of the Pc1 waves was higher in late winter– spring, particularly in August and in the post-midnight (1–3 MLT) sector. We noted that their occurrence significantly increased during the declining phase of the solar cycle. These results are consistent with those of Park et al. (2013), which reported significantly higher occurrence rates during solar minimum years than during maximum years.
In most cases, the events lasted for 2–5 minutes with a peak frequency of ~0.9 Hz and a very narrow bandwidth (within 0.1 Hz). These results are generally consistent with those of Park et al. (2013) and Kim et al. (2018).
Overall, the occurrence of the Pc1 waves appeared to strongly depend on that of geomagnetic storms. Of that total events, with 77% occurred during storms. Moreover, 90% of those events were observed during the early recovery phase of the storms. These results are somewhat different from those of Kim et al. (2018), which reported the highest occurrence of Pc1 waves in correspondence of the late recovery phase of geomagnetic storms at LEO.
The purpose of this paper was to clarify the characteristics of Pc1 pulsations observed from a mid-latitude ground station. We found that the Pc1 wave events started to increase in 2014, during the declining phase of the solar cycle. Unfortunately, no data could be collected during 2016 and few observations could be conducted in 2017 and 2018. To obtain more reliable results, we need a more comprehensive dataset. Therefore, we plan to expand the present dataset in future works by using data collected from multiple ground stations and satellites.