1. INTRODUCTION
One of the most distinguishing phenomena in the lowlatitude F region is the development of two enhanced plasma density peaks centered around ±15° magnetic latitudes. This phenomenon is called the equatorial ionization anomaly (EIA). The EIA is an anomalous feature because it deviates from the ionospheric morphology predicted by the photoionization production rate. The EIA’s existence was identified by the ionosonde observations in early studies (Namba & Maeda 1939;Appleton 1946), and various observations from space have enriched our knowledge of the EIA phenomenon from a global perspective (Benkova et al. 1990;Jee et al. 2004, 2005, 2010;Sagawa et al. 2005;Immel et al. 2006;Kil et al. 2007, 2008;Lin et al. 2007a, b;Liu & Watanabe 2008;Oh et al. 2008;Scherliess et al. 2008;England et al. 2009;Liu et al. 2009;Tulasi Ram et al. 2009;Lee et al. 2011). The upward drift of the equatorial plasma during daytime redistributes the equatorial plasma along the magnetic field lines by the phenomenon known as the fountain effect (Mitra 1946;Hanson & Moffett 1966;Moffett 1979). As a result, plasma density crests are created around ±15° magnetic latitudes and a trough is created at the magnetic equator. The EIAs created during daytime gradually diminish at night following the downward drift of the ionosphere. The EIA region has a practical importance because of the occurrence of the most severe radio scintillation (e.g., Basu & Larson 1995).
The diurnal variation of the vertical plasma motion in the equatorial region (e.g., Fejer et al. 1991, 1995, 2008;Kil et al. 2009) causes the diurnal variation of the EIA intensity. The vertical plasma drift at a given local time (LT) varies with longitude, season, solar cycle, and magnetic activity, and therefore, the EIA intensity varies with those factors. The hemispheric difference of the EIA intensity (hereafter hemispheric asymmetry) is primarily caused by the effect of interhemispheric wind (e.g., Vila 1971a, b;Aydogdu 1988;Balan et al. 1995;Su et al. 1997;Rishbeth 2000;Tsai et al. 2001;Kil et al. 2006;Lin et al. 2007a;Tulasi Ram et al. 2009). Interhemispheric wind induces the hemispheric asymmetry by the interhemispheric plasma transport and the modification of the equatorial plasma diffusion (e.g., Heelis & Hanson 1980;Balan et al. 1995;Lin et al. 2007a;Tulasi Ram et al. 2009). Another important wind effect is the modulation of the F-region height (e.g., Balan et al. 1995;Su et al. 1997). Equatorward winds lift the ionosphere to higher altitudes where the plasma loss by the dissociative recombination of the oxygen ion with molecular gases is small. This process causes the enhancement of plasma density. Poleward winds, however, lower the F-region height and cause the reduction of plasma density.
The early studies using the F-peak density (NmF2) measurements by ionosondes reported the temporal variation of the hemispheric asymmetry during periods of low solar activity; a stronger EIA occurs in the winter hemisphere in the morning and in the summer hemisphere in the afternoon (Vila 1971a, b;Walker et al. 1991). The radio occultation observations made by the Constellation Observing System for Meteorology, Ionosphere, and Climate (COSMIC) satellites further confirmed the reversal of the hemispheric asymmetry in the afternoon during low solar activity (Lin et al. 2007a;Tulasi Ram et al. 2009). However, the total electron content (TEC) observations from the Ocean Topography Experiment (TOPEX)/Poseidon mission showed the variation of the hemispheric asymmetry with the solar activity (Jee et al. 2004). During periods of low solar activity, the hemispheric asymmetry identified by the TOPEX/Poseidon observations is similar to that identified by the ionosonde and COSMIC observations; hemispheric asymmetries in the morning and afternoon are the opposite of each other. However, the TOPEX/Poseidon observations made during periods of high solar activity did not show the reversal of the hemispheric asymmetry in the afternoon.
Tulasi Ram et al. (2009) explained the occurrence of a stronger EIA in the winter hemisphere in the morning due to the transport of plasma from the summer hemisphere to the winter hemisphere by the summer-to-winter wind. The reversal of the hemispheric asymmetry in the afternoon was explained by the weakening of the interhemispheric plasma transport due to the intensified fountain process and ion drag. However, the mechanism proposed by Tulasi Ram et al. (2009) is not applicable to the hemispheric asymmetry observed during periods of high solar activity. The variation of the EIA intensity was extensively investigated by Jee et al. (2004). However, the main interest of Jee et al. (2004) was the longitudinal variation of the hemispheric asymmetry in association with the geomagnetic field configuration but the variation of the hemispheric asymmetry with the solar cycle was not dealt with.
The comparison of the hemispheric asymmetry during different periods of the solar cycle is desirable for a comprehensive understanding of the hemispheric asymmetry phenomenon. In this study, we investigate the variability of the hemispheric asymmetry with LT, altitude, season, and solar cycle and discuss mechanisms behind the variability. The investigation is carried out with using the measurements of the electron density made by, from by the Planar Langmuir Probe (PLP) onboard the CHAllenging Minisatellite Payload (CHAMP) satellite and the TEC data provided by the Center for Orbit Determination in Europe (CODE) during 2001–2008. The COSMIC electron density data during 2007–2008 are also analyzed and compared with the CHAMP and TEC data. Our investigation is limited to the observations in the dayside during solstices.
2. DATA DESCRIPTION
The CHAMP satellite was launched on 15 July 2000 into a near-circular orbit. From its initial altitude of 456 km, the satellite has slowly decayed, reaching an altitude of 320 km at the end of 2008. The high inclination (87.25°) of the satellite causes a slow precession of the orbital plane at a rate of 5.6 min/day. The 24-h LT is covered by combining the observations in the ascending and descending orbits every 131 days. The PLP data are available at a rate of 1 sample each 15 seconds. We use the PLP data acquired during 2001–2008.
Global TEC maps are available from the CODE website (ftp://ftp.unibe.ch/aiub/CODE). Observations at about 200 worldwide global positioning system (GPS) stations were used for the TEC maps. TEC maps were produced with the grid sizes of 2.5° in latitude and 5° in longitude on a 2-h interval. The CODE TEC data acquired during 2001–2008 are analyzed.
COSMIC consists of six satellites launched on 15 April 2006. The current satellite orbits are at an altitude of 800 km with an inclination angle of 72° and the longitudinal separation between the satellites is 30°. The radio occultation measurements from dual frequency GPS receivers onboard the satellites provide about 1500–2300 electron density profiles per day in the 50- to 800-km altitude range (e.g., Lei et al. 2007). The COSMIC data acquired during 2007–2008 are analyzed to investigate the hemispheric asymmetry during the solar minimum. We processed the CHAMP, TEC, and COSMIC data acquired under low and moderate levels of geomagnetic activity (Kp ≤ 3+).
3. RESULTS
The global maps of the electron density during the solar minimum were produced using the CHAMP data acquired during 2007–2008. Fig. 1 shows the temporal variation of the electron density between 0800 and 1600 LT during the (a) December solstice (November, December, and January in 2007 and 2008) and (b) June solstice (May, June, and July in 2007 and 2008). At the altitude of the CHAMP satellite (340– 320 km), the hemispheric asymmetry is not pronounced in the morning. The weak tendency identified at 1000–1200 LT is the development of a stronger EIA in the summer hemisphere. The hemispheric asymmetry is intensified in the afternoon, and the EIA in the summer hemisphere is much stronger than that in the winter hemisphere.
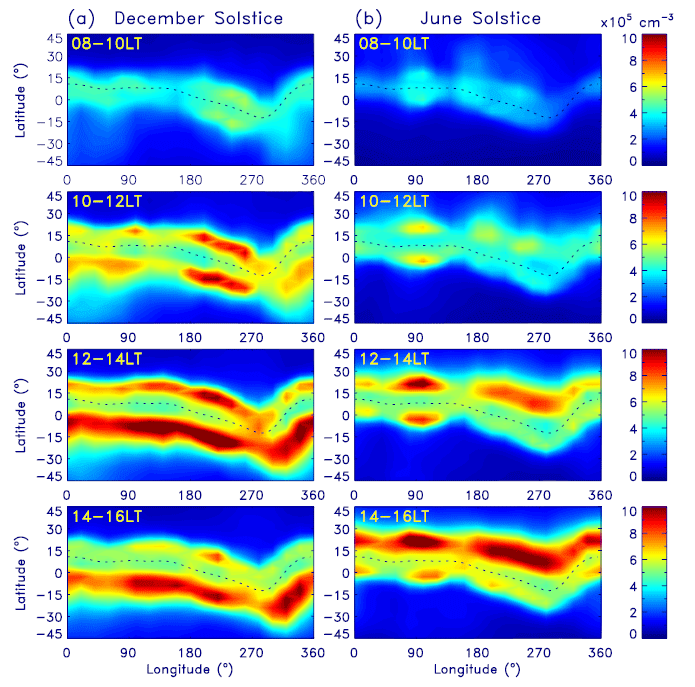
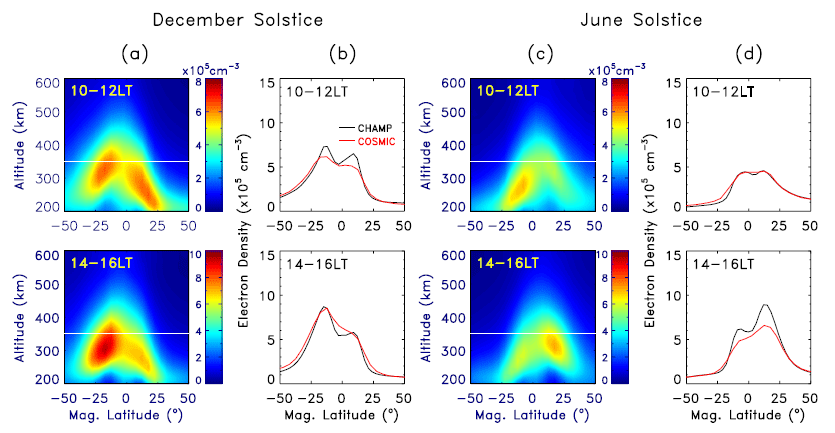
The occurrence of a stronger EIA in the summer hemisphere in the afternoon agrees with the COSMIC NmF2 observation (Tulasi Ram et al. 2009), but the observation of a minor hemispheric asymmetry in the morning disagrees with the occurrence of a stronger EIA in the winter hemisphere in the COSMIC NmF2. The difference of the hemispheric asymmetry between the CHAMP and COSMIC observations may indicate the altitudinal difference of the hemispheric asymmetry. Fig. 2(a) shows the longitude-average COSMIC electron density profiles at 1000–1200 LT and 1400–1600 LT during the December solstice in 2007–2008. The CHAMP altitude is indicated with white lines. In Fig. 2(b), the electron densities observed by CHAMP are shown with black curves and COSMIC electron densities sampled at the altitude of CHAMP are shown with red curves. Fig. 2(c) and 2(d) are the same format for the observations during the June solstice. In the COSMIC observations at 1000–1200 LT, the electron density in the winter hemisphere is greater than that in the summer hemisphere during the June solstice. The hemispheric asymmetry is not pronounced during the December solstice. The development of a stronger EIA in the summer hemisphere is clearly visible in the afternoon in both seasons. The F-peak height in the summer hemisphere is higher than that in the winter hemisphere in both the morning and afternoon. At 1000–1200 LT, CHAMP passes through near F-peak height in the summer hemisphere and in the topside in the winter hemisphere. Although the stronger NmF2 is developed in the winter hemisphere at 1000–1200 LT, the EIA intensity in the summer hemisphere is comparable to, or stronger than, that in the winter hemisphere at an altitude of CHAMP owing to the hemispheric difference of the F-peak height. At 1400–1600 LT, the electron density in the summer hemisphere is greater than that in the winter hemisphere at both the F-peak height and the CHAMP altitude. The hemispheric asymmetry is not sensitive to the F-peak height in the afternoon because the electron density in the summer hemisphere is greater than that in the winter hemisphere in a broad altitude range.
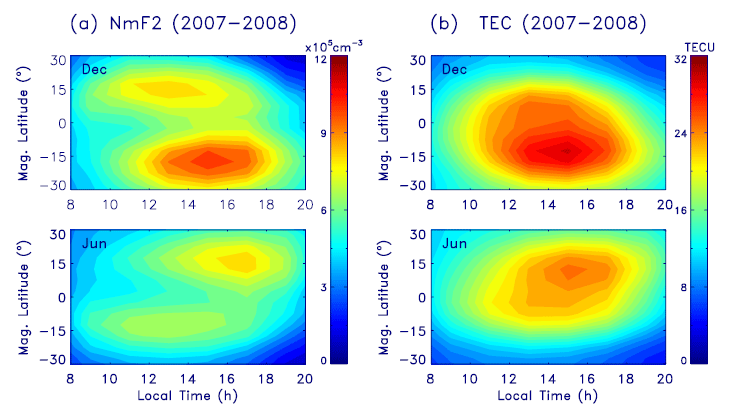
We further investigate the diurnal variation of the hemispheric asymmetry during the solar minimum (2007– 2008) using the COSMIC NmF2 and GPS TEC data. The longitude-average COSMIC NmF2 data are shown in Fig. 3(a). The GPS TEC data during the same period are shown in Fig. 3(b). In Fig. 3(a), the EIA emerges at an earlier morning about 0800 LT, in the winter hemisphere compared to the EIA in the summer hemisphere. As time progresses, the EIA in the summer hemisphere is strengthened with maximum NmF2 value of 10.4×105 cm–3 (8.4×105 cm–3) around 1500 LT (1700 LT) in December (June) solstice and persists until 2000 LT, whereas the EIA in the winter hemisphere is weakened slightly from 1300 LT and diminishes in the evening. Although the southern and northern EIAs are not clearly separable in Fig. 3(b), we can identify the earlier emergence of the TEC enhancement in the winter hemisphere than in the summer hemisphere during the June solstice. The hemispheric asymmetry in the morning is not clear during the December solstice in the GPS TEC data. The EIA in the summer hemisphere is intensified in the afternoon in both seasons and a stronger EIA develops in the summer hemisphere with maximum TEC value of 30.3 TECU (25.5 TECU) around 1500 LT in December (June) solstice.
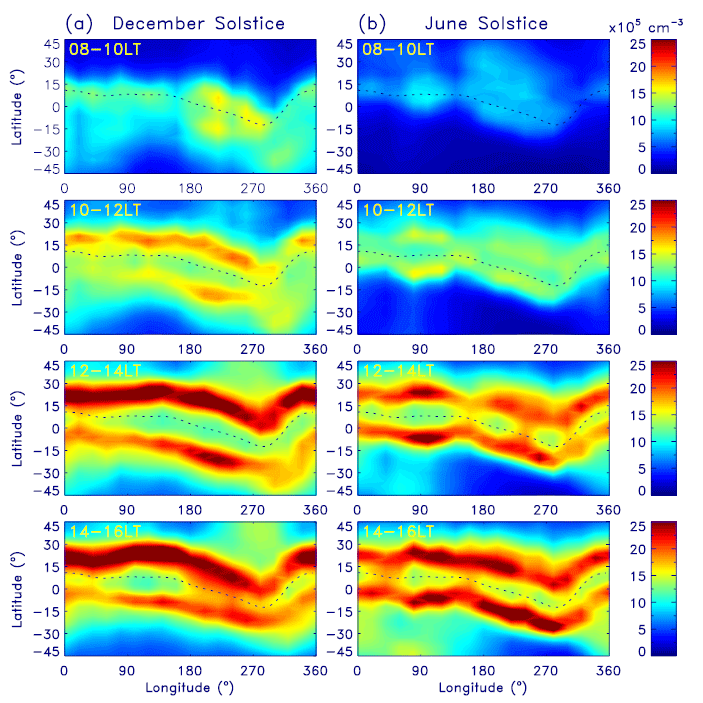
The hemispheric asymmetry during the solar maximum is investigated using the CHAMP electron density data acquired during 2001–2002. Fig. 4 has the same format as Fig. 1 for the CHAMP data during the (a) December solstice and (b) June solstice. During the December solstice, the EIA in the winter (northern) hemisphere is stronger than that in the summer (southern) hemisphere in both the morning and afternoon. However, the hemispheric asymmetry is not obvious during the June solstice. The hemispheric asymmetry in the afternoon during the solar maximum shows a clear difference from that observed during the solar minimum; the EIA in the summer hemisphere is more intense than that in the winter hemisphere during the solar minimum, but this phenomenon does not appear during the solar maximum.
The hemispheric asymmetry of electron density at a constant altitude (~330 km) may be different from that of NmF2 because, as shown in Fig. 2, the F-peak height is different in the opposite hemispheres. Using the longitude-average GPS TEC maps, we examine whether the hemispheric asymmetry observed by CHAMP is a general feature during the solar maximum. Fig. 5 has the same format as Fig. 3(b) for the observations during 2001–2002. During the December solstice, the EIA in the winter (northern) hemisphere emerges at earlier LTs and persists longer compared to the EIA in the summer (southern) hemisphere, which is consistent with the CHAMP observation. During the June solstice, the northern and southern EIAs are not clearly distinguishable. However, we can identify the occurrence of a greater TEC in the winter hemisphere throughout the daytime. The minor hemispheric difference of TEC during the June solstice is also consistent with the CHAMP observation.
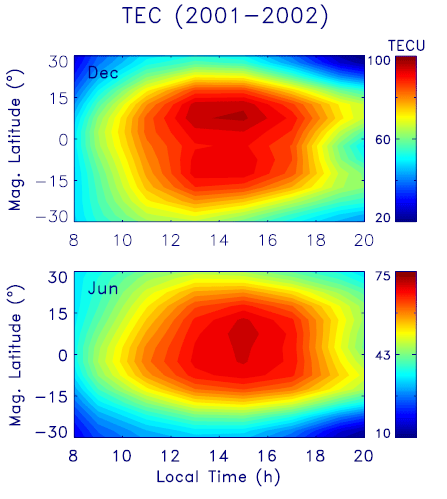
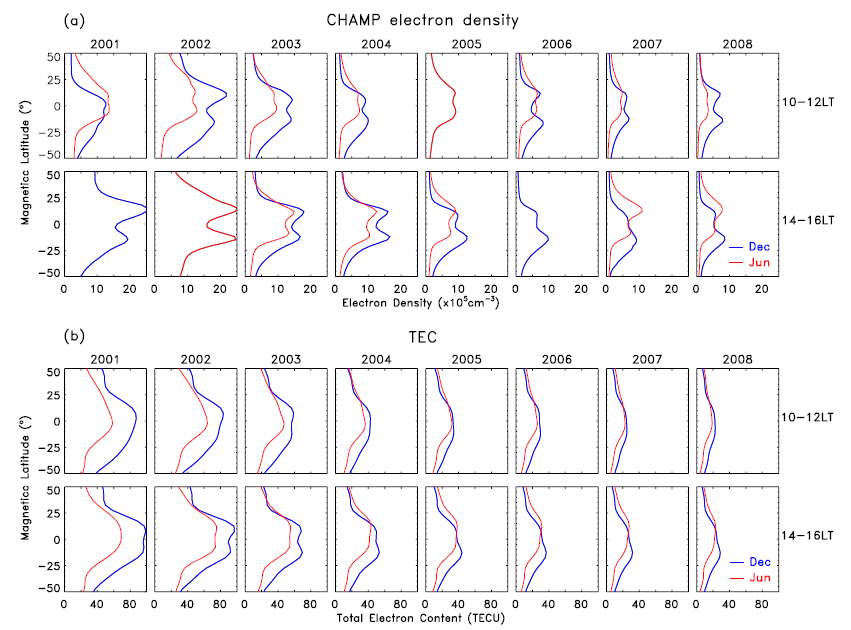
Fig. 6 shows the variation of the hemispheric asymmetry between 2001 and 2008 in (a) CHAMP electron density and (b) GPS TEC. The observations during the December and June solstices are shown with blue and red curves, respectively. Curves in some years in Fig. 6(a) are missing because the CHAMP observations do not provide sufficient data at the given LT intervals. At 1000–1200 LT, we can identify a tendency of the occurrence of a stronger EIA in the winter hemisphere during 2001–2003 and the weakening of the hemispheric asymmetry in the following years in both the CHAMP electron density and GPS TEC. The hemispheric asymmetry is not obvious in the morning in both seasons during 2006–2008. At 1400–1600 LT, we can identify a tendency of the occurrence of a stronger EIA in the winter hemisphere compared to the EIA in the summer hemisphere during high solar activity periods and the occurrence of a stronger EIA shifts from the winter hemisphere to the summer hemisphere in both the CHAMP electron density and GPS TEC plots following the decline of the solar cycle. This shift occurs near 2004 and is more clearly visible in the observations during the December solstice.
4. DISCUSSION
The hemispheric asymmetry during the December and June solstices shows a slightly different variation with LT and solar cycle, but a general tendency exists. Combining our observations and the results reported in previous studies (Jee et al. 2004;Tulasi Ram et al. 2009), the hemispheric asymmetry is summarized as follows. During the solar minimum, a stronger EIA develops in the winter hemisphere in the morning and in the summer hemisphere in the afternoon. The hemispheric asymmetry is more pronounced during the afternoon than during the morning. During the solar maximum, a stronger EIA develops in the winter hemisphere in both the morning and afternoon. Thus the hemispheric asymmetries during the solar minimum and maximum are significantly different in the afternoon. We discuss the formation of the hemispheric asymmetry and its variation by the combined effects of the fountain process and summer-to-winter wind.
The summer-to-winter wind affects the low-latitude ionosphere by plasma transport along the geomagnetic field lines. On the aspect of the modulation of the F-region height, the summer-to-winter wind effect is positive to the plasma density in the summer hemisphere and is negative in the winter hemisphere (e.g., Balan et al. 1995;Su et al. 1997); the uplifting of the ionosphere in the summer hemisphere causes the plasma density enhancement, and the lowering of the ionosphere in the winter hemisphere causes the plasma density reduction. In the meanwhile, the plasma diffusion caused by the fountain effect is affected by neutral wind (e.g., Heelis & Hanson 1980;Balan et al. 1995;Lin et al. 2007a;Tulasi Ram et al. 2009); the summerto- winter wind reduces the equatorial plasma diffusion into the EIA in the summer hemisphere, but it enhances the equatorial plasma diffusion into the EIA in the winter hemisphere. Thus, on the aspect of the equatorial plasma diffusion, the summer-to-winter wind effect is positive to the plasma density in the winter hemisphere and is negative in the summer hemisphere. The effects of the two processes (height modulation and equatorial plasma diffusion) would result in either a plasma density enhancement or a plasma density reduction depending on their relative significance.
The effect of the summer-to-winter wind on the equatorial plasma diffusion described above is different from the interpretation by Tulasi Ram et al. (2009). The mechanism processed by Tulasi Ram et al. (2009) is as follows. In the afternoon, the development of a strong EIA (or ion drag) in the summer hemisphere and the intensified fountain process reduce the plasma transport from the summer hemisphere into the winter hemisphere. The uplift of the F region in the summer hemisphere by the summer-to-winter wind also maintains the EIA in the summer hemisphere. As a result, the EIA in the winter hemisphere is weakened and the EIA in the summer hemisphere is intensified in the afternoon. The proposed mechanism by Tulasi Ram et al. (2009) may explain the creation of a stronger EIA in the summer hemisphere in the afternoon during the solar minimum, but it does not explain the creation of a stronger EIA in the winter hemisphere in the afternoon during the solar maximum. The upward plasma drift velocity in the afternoon during the solar maximum is greater than that during the solar minimum (e.g., Fejer et al. 1991, 1995;Kil et al. 2009). The equatorial plasma density during the solar maximum is also greater than that during the solar minimum. Therefore, the fountain effect would be more intense during the solar maximum than during the solar minimum. If the ion drag at the EIA and the fountain process play a significant role in the weakening of the EIA in the winter hemisphere, those effects would be more significant during the solar maximum than during the solar minimum. Thus the mechanism suggested by Tulasi Ram et al. (2009) predicts the creation of a much weaker EIA in the winter hemisphere than in the summer hemisphere during the solar maximum. However, the observations are opposite to this prediction.
Tulasi Ram et al. (2009) considered the fountain effect only in the afternoon. However, note the fact that the upward plasma drift velocity has a peak value near 1000 LT (Scherliess & Fejer 1999;Fejer et al. 2008;Kil et al. 2009). The upward plasma drift in the afternoon is significantly reduced compared to that at 1000 LT. Even if we consider the 1–2 h delay of the EIA response to the vertical plasma drift (e.g., Stolle et al. 2008), the fountain effect should be taken into account more in the morning than in the afternoon. When the fountain effect is intense, equatorial plasma diffusion is important for the formation of the EIA. In the presence of the summer-to-winter wind, the equatorial plasma diffusion into the winter hemisphere will be enhanced. In Fig. 2, the COSMIC electron density profiles show the significant hemispheric asymmetry in the F-region height. In the morning, the NmF2 in the summer hemisphere is smaller than that in the winter hemisphere in spite of the uplift of the ionosphere in the summer hemisphere. This observation indicates that the equatorial plasma diffusion plays a dominant role in the EIA intensity in the morning. The strengthening of the EIA in the winter hemisphere in the morning may be attributed to the plasma transport from the summer hemisphere to the winter hemisphere. However, the temporal evolution of the EIA identified by the COSMIC observations (Tulasi Ram et al. 2009) shows the strengthening of the EIA in both hemispheres in the morning. Therefore, the strengthening of the EIA in the winter hemisphere may not be produced by the transport of plasmas from the EIA in the summer hemisphere.
Following the decrease of the upward plasma drift in the afternoon, the fountain process becomes less significant. In that situation, the F-region height modulation by the summer-to-winter wind becomes important for the EIA intensity. In the summer hemisphere, the equatorward summer-to-winter wind maintains the EIA at higher altitudes and retards the plasma loss at the EIA. Although the fountain effect is weakened in the afternoon, the cumulative fountain effect combined with the uplift of the F region can intensify the EIA in the summer hemisphere. In the winter hemisphere, the EIA intensity would be weakened as time progresses, if the equatorial plasma diffusion into the EIA is less than the plasma loss at the EIA. During the solar minimum, the COSMIC observations in the afternoon show the weakening of the EIA in the winter hemisphere as time progresses (Tulasi Ram et al. 2009). This observation indicates that the equatorial plasma diffusion into the EIA is not capable to compensate the plasma loss at the EIA in the winter hemisphere. During the solar maximum, however, the observation of the intensification of the EIA in the winter hemisphere in the afternoon indicates that the equatorial plasma diffusion is still effective in the afternoon. The upward plasma drift is weakened following the decline of the solar cycle (e.g., Fejer et al. 1991, 1995;Kil et al. 2009), so does the role of the equatorial plasma diffusion in the EIA intensity.
The intensity of the hemispheric asymmetry is variable with season and longitude as well as with the solar cycle because the vertical plasma drift velocity (or fountain effect), wind velocity, and plasma density are variable with those factors. Our data sets show that the hemispheric asymmetry is more pronounced during the December solstice than during the June solstice, regardless of solar activity. The difference of the plasma density between the two seasons may affect the intensity of the hemispheric asymmetry. The plasma density during the December solstice is greater than that during the June solstice as our results show. The annual variation of the Sun-Earth distance (perihelion in January and aphelion in July) is an important source of the plasma density difference between the December and June solstices (e.g., Lee et al. 2011). The effect of the summer-to-winter wind on the equatorial plasma diffusion would be more significant when the equatorial plasma density is higher, and therefore, the more intense hemispheric asymmetry is expected to be created during the December solstice. The longitudinal variation of the hemispheric asymmetry is attributed to the global-scale modulation of the vertical plasma drift by tidal forcing (e.g., Kil & Paxton 2011) and the variation of the neutral wind effect in association with the geomagnetic field configuration (West & Heelis 1996;Su et al. 1997;Rishbeth 2000;Venkatraman & Heelis 2000;Jee et al. 2004;Kil et al. 2006;Tsai et al. 2001;Lin et al. 2007a).
5. CONCLUSIONS
We have investigated the hemispheric asymmetry in the low-latitude ionosphere using the CHAMP plasma density, GPS TEC data acquired during 2001–2008, and the COSMIC plasma density data acquired during 2007–2008. Our results show the transition of the occurrence of a stronger EIA from the winter hemisphere to the summer hemisphere around 1200–1400 LT during the solar minimum. This phenomenon is more clearly visible in the F-peak density than in TEC or in topside plasma density. During the solar maximum, a stronger EIA appears in the winter hemisphere in both the morning and afternoon. Therefore, the occurrence of a stronger EIA in the afternoon shifts from the winter hemisphere to the summer hemisphere following the decline of the solar cycle. The shift occurs near 2004 (yearly average F10.7 index = 106) and this phenomenon is more clearly visible during the December solstice than during the June solstice. The creation of the hemispheric asymmetry is attributed to interhemispheric winds. In the presence of interhemispheric winds, we suggest that the intensity of the fountain effect determines the variation of the hemispheric asymmetry with LT and solar cycle.


