


1. INTRODUCTION
Satellite laser ranging (SLR) is the most accurate system available to measure the distance between a ground station and an Earth satellite, and is considered a powerful potential technique for space geodesy, such as geodynamics, Earth gravity field, and Earth orientation parameter. In addition, it has been expanded to interplanetary spacecraft beyond Earth satellites and the moon (Abshire et al. 2006;Smith et al. 2006;Zuber et al. 2010). Under the International Laser Ranging Service (ILRS) network (Pearlman et al. 2002), more than 40 SLR stations are tracking their special targets (satellites, The Moon and space debris) and increasing their mission envelope to improve their system performance and enhance robustness in any environmental conditions.
The Korea Astronomy and Space Science Institute (KASI) has been developing two SLR systems: the Sejong system (“SEJL” station in ILRS) and the Geochang system (“GEOL” station in ILRS). The Sejong system is the first Korean mobile SLR system, which began operations in the KASI facility in 2012. It then moved to the Sejong station in 2015. It is designed to enable 2 kHz laser ranging up to the MEO altitude with millimeter-level precision for geodetic, remote-sensing, navigational and experimental satellites equipped with laser retro-reflector (Choi et al. 2014;Choi et al. 2015). In 2018, the Geochang system was launched to broaden the mission of laser ranging system from basic geodetic missions to space situational awareness and space mission support. Specifically, the Geochang system includes an SLR system that can support to GEO satellites mission, a debris laser tracking (DLT) and an adaptive optics (AO) system. The SLR and AO system have already been established, whereas the DLT system is under developing for a test (Lim et al. 2018).
When designing the Sejong and the Geochang stations, technologies like kHz laser ranging for millimeter-level precision, and high power laser for tracking higher-altitude satellites to expand its mission envelope were regarded as an essential function. However, current trends and technologies show the possibility of system automation either fully or partially (Horvath et al. 2014). Someday, every SLR station, including Korean SLR systems, would adopt this system-automation concept and benefit from reduced processing time, reduced operational budget, increased tracking time, etc. This system automation would be achieved by implementing several automated processes: scheduling, tracking and data-processing operations (Horvath et al. 2014;McGarry et al. 2014). The automated signal-acquisition method, which is the main function of the automated tracking operations process, seems like the most important process. Collecting data from this method affects the remaining data operations process to determine the success of operations. The perfect method for signal-acquisition would be efficient, simple and robust for any system specifications and environmental conditions to realize the benefits of system automation.
Following the successful performance verification of NASA’s next-generation SLR (NGSLR) prototype system, NASA plans to build and deploy space geodesy satellite laser ranging (SGSLR) systems within the next few years. These new systems will use much of the technology already developed and tested on the NGSLR. Although many aspects of system automation were built into the NGSLR, more development is necessary to fully complete SLR system automation (Horvath et al. 2014). In the case of an automated signal-acquisition technique, NGSLR delivered to SGSLR as this analytic method to select the correlation parameter and frame time that simultaneously provide a high probability of detection (>90%) and a low probability of false acquisition (<1%), to determine a reliable threshold probability value (90% and 1%) considering the system’s hardware uncertainty (Titterton 2000;McGarry et al. 2014).
More specifically, the above method consists of three steps: i) the first approximate relationship is generated as a third-order equation of the correlation parameter through curve fitting using the output data, which satisfies an approximately 1% false-acquisition probability; ii) the second approximate relationship is also built in the first order through curve fitting using output data generated for the condition in which signal-detection probability is in near 90%; and iii) the minimum value of the two parameters is selected in the graph-domain so that the signal-detection probability is greater than 90% and the false-acquisition probability is less than 1% simultaneously. These parameter values are selected for minimization within two specified probabilities because the signal-acquisition decision should be completed as quickly as possible with the minimum number of returned signals (Titterton 2000).
This method has the advantage of observing the characteristics of two probabilities based on changes in two parameters in the cross-hatched graph. However, it is possible that it cannot provide the best solution if the performance values (the detected signal and noise count rate) change rapidly and abruptly, because its process needs to repeat the entire step when performance values change. Furthermore, it is complicated and less accurate due to graph-domain approximation.
In this paper, a new method is proposed to select these parameters using the conditional equation derived from the characteristics of the signal-detection and false-acquisition probabilities. This method shows that greater efficiency and robustness than the previous method for easier parameter selection and emphasizing easier application to other SLR systems. In addition, this study analyzed how performance values under varying system specifications and environmental conditions affect the parameter selection. This result can show, once again, that this new method has better efficiency and robustness for application to other SLR systems than the previous method.
2. Signal-Acquisition Technique
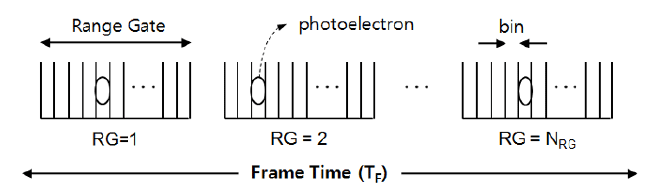
When an SLR system fires laser pulses for the tracking satellite, it calculates the TOF (Time-of-Flight) using the predicted satellite ephemeris and opens the range gate with the specified width in a photodetector to receive the returned signals. The range gate width is several hundreds of nanoseconds, 200 ns for the SGSLR system, which depends on the SLR timing system and predicted TOF uncertainty. The range gate width is also divided into several hundred time bins for declaring the successful signal-acquisition from the data collected for the frame time TF, as shown in Fig. 1. The actual returned signals from the satellite tend to fall in a single or a few bins, whereas the background noise is uniformly distributed with Poisson statistics. However, if the bin width selected is large enough to compensate for the system timing and uncertainty of the predicted satellite ephemeris, the returned signals will gather within one bin for the frame time. At the end of the period, the signal-acquisition is determined to be successful when the pulse number that arrived in any corresponding bin is greater than the correlation parameter k, defined as the minimum pulse number for the declaration of the signal-acquisition. If the SLR system uses a laser system with pulse-repetition frequency ωPRF, the number of range gates within the frame time is
The photoelectron arriving at the photodetector may be the returned signal or the background noise whose count rates have influence on the signal-acquisition, which falls into any bin of the range gate’s width. The number of returned signals and the background noise detected can be described by the probability function based on Poisson statistics. Therefore, the correlation parameter and the frame time should be selected as minimum so that the specified probabilities of both signal-detection and false-acquisition are satisfied (SGSLR :90% and 1%, Titterton 2000). Practically, the count rate of the returned signal depends on the system performance, satellite information such as altitude, laser retro-reflector, and atmospheric transparency, whereas the background noise only depends on atmospheric brightness. (Degnan 1993).
The probabilities of signal-detection by returned photoelectrons and the false acquisition caused by the background noise per single frame are given by Poisson statistics (Titterton 2000).
where nbin represents the number of time bins within a single range gate, m describes the mean noise count per bin over the frame time, and Nt denotes the total mean number of the correlated photoelectrons (signal plus noise) detected in the same bin. Nt and m in Eqs. (2) and (3) can be written as
with
where and are the mean noise count per second and the mean signal count per pulse, respectively. tbin means the bin width as a design parameter determined such that all returned signals can fall into a single bin in the presence of the system timing and TOF uncertainties. is the total number of returned signals from satellites for the frame time. When returned signals fall into a single bin, the number is larger than the noise detected in that bin so Nt is approximated by .
The characteristics of the signal-detection and false-acquisition probabilities are analyzed to derive the conditional equation, which is useful and efficient to find the optimal correlation parameter and the frame time. Taking a partial differential for the signal-detection and false-acquisition probabilities with respect to TF, the differential equations are
Comparing the magnitude of the signal-detection and false-acquisition probabilities for sequential correlation parameter at any constant TF = TA, given a defined iteration number n, and then their difference equations can be expressed as
From Eqs. (6) - (9), we can conclude two results: i) both the signal-detection and false-acquisition probabilities are monotonic, thus increasing functions for any constant correlation parameter; and ii) two probabilities decrease as the correlation parameter increases under any constant frame time.
3. New method for parameter selection
Two system parameters will be minimized so that both the signal-detection and false-acquisition probabilities meet two given conditions simultaneously, such as the determined value of the NGSLR (PSD ≤ 90% and PFA ≤ 1%), whose mathematical expression can be written as
Even though there are many combination pairs of the correlation parameter and frame time to meet the two probability conditions, one optimal set with the minimum value among their pairs is selected to achieve fast signal-acquisition.
In this study, the new method to find the optimal set is introduced using the characteristics of the signal-detection and false-acquisition probabilities. For the selection of frame time TF to meet the two probability conditions, it is obvious from these characteristics that the minimum TF with PSD ≥ 90% should be smaller than the maximum TF with PFA ≤ 1% for any k, which can be expressed as
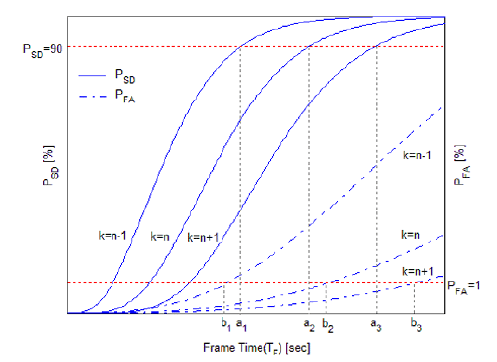
Then, the optimal set (k, TF) is selected as the minimum value of k to satisfy Eq. (11) and for that minimum of k. Fig. 2 shows the condition of Eq. (11) and the selection of the optimal set schematically from the signal-detection and false-acquisition probabilities, whose graphs exactly correspond to the characteristics of these probabilities of Eqs. (6) - (9). The time intervals to meet the conditions of PSD ≥ 90% and PFA ≤ 1% are (a1, b1) for k = n - 1, (a2, b2) for k = n and, (a3, b3) for . Even though two pairs, (a2, b2) and (a3, b3) satisfy the condition of Eq. (11), the optimum set is selected as (k = n, TF = a2) because k = n is the minimum value to satisfy Eq. (11).
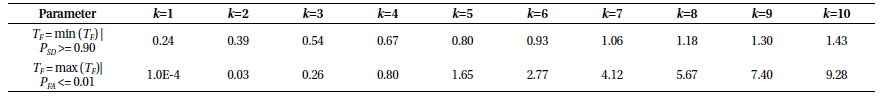
Let us select the optimal set of the system parameter using the condition of Eq. (11). The minimum and maximum solutions of pTF and qTF for PSD ≥ 90% and PFA ≤ 1% and can be obtained using a numerical technique via Eqs. (2) and (3). These solutions are shown in Table 1, which is independent of the performance value. Therefore, repeated calculation is not necessary when changing the performance value. For ease of calculation, let us set the equation as (pTF)k = xk and (qTF)k = yk and only consider the case of nbin = 400 in the rest of this paper.

For the comparison with Titterton (2000), the same values are applied for the selection of the optimal set
Then, the frame time to meet two probability conditions in Eq. (10) can be computed at each correlation parameter value (k = 1~10) from Table 1 and Eqs. (4) and (5) as shown in Table 2. The frame time in Table 2 satisfies the condition of Eq. (11) for the case of k ≥ 4. Thus, the optimal set is selected as (k = 4, TF = 0.67) compared with the solutions (k = 4, TF = 0.7) from Titterton (2000). And the signal-detection and false-acquisition probabilities are PSD = 90.12% and PFA = 0.48% for (k = 4, TF = 0.67), and PSD = 91.82% and PFA = 0.57% for (k = 4, TF = 0.7), respectively. Both of these sets satisfy two probability conditions but this new method gives a more accurate value of TF. This method is easy to make and also simpler than the method proposed by Titterton (2000) because it only needs one table just like reference Table 2 without repeated computing process.
|
4. Analysis of parameter selection
Two variables, and , in Eqs. (2) and (3) vary with the environmental atmosphere around the SLR stations, satellite retro-reflector and transmit/receive efficiency, which greatly affects the parameter selection. Below, we investigate how these two variables influence the parameter selection. After substituting Eqs. (4) and (5) into the characteristics of Eq. (11), other condition forms can be written as,
where (pTF)k = xk and (qTF)k = yk.
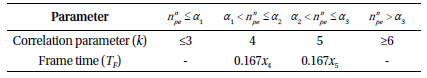
It is shown that the frame time selection depends on the pulse repetition frequency ωPRF from Eq. (4), but the correlation parameter selection does not depend on it explicitly from Eq. (12). Because xk/yk in Eq. (12) is an exponentially decreasing function, we can conclude that the correlation parameter k should decrease if increases under constant tbin or if tbin decreases under constant . In other words, the optimal correlation parameter can be chosen to be small when the background noise is low and the returned signal is high relative to , or the SLR timing system and the predicted TOF have high quality relative to tbin.
Fig. 3 shows the relation between the selection of correlation parameters k and w, newly defined in the left axis of Fig. 3, which supports the above conclusion and whose axes are reversed for convenience of understanding Eq. (12). The optimal k is selected to be minimum such that log10(w) is greater than log10(xk/yk). For example, the optimal k is chosen to be 4 for because log10(w) = 1.699, log10(x4/y4) = 1.621, and log10(x3/y3) = 1.995.
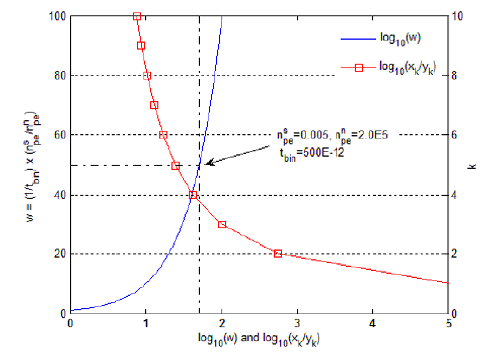
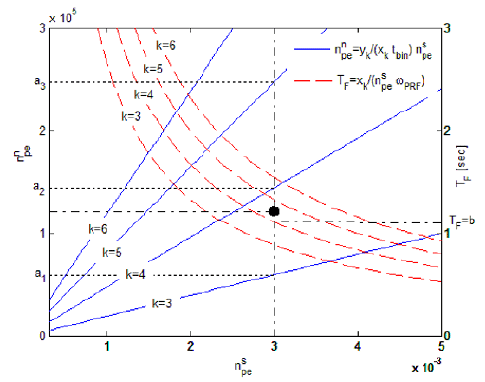
Fig. 4 shows how to select the parameter according to the change of signal and noise count rate for the specific case of ωPRF = 2KHz and tbin = 500ps. In the case of and variable , an analysis of the parameter selection can be obtained using Eq. (12), as shown in Table 3, which indicates that the more decreases the optimal k and TF values decrease. If , the optimal k is selected to be 4 by Eq. (13), and the optimal frame time TF is b = 1.12s from Table 3, as shown in Fig. 4. Thus, it is concluded that lower background noise or higher returned signal results in faster signal-acquisition.
5. Conclusions
In this paper, we addressed a new method to select two system parameters, such as the correlation parameter and the frame time, using the conditional equation derived from the characteristics of the signal-detection and false-acquisition probabilities. First, this new method is efficient and has strong robustness because it is an independent process of changes in performance values changing, signal count rate, and noise count rate. Second, it is simpler and more accurate than the previous analytical method that used the graph-approximation values generated from computing an equation and curve fitting. Additionally, this paper includes analysis of how the performance values, under system specifications and environmental conditions, affect the parameter selection. This analysis shows that signal-acquisition becomes faster under lower background noise, higher returned signal values and a better timing system for accurate TOF prediction. Consequently, this result shows, once again, that the new selection method has better efficiency and robustness than the previous method, owing to its independence of performance values. Moreover, the result provides some references for designing system specifications and environmental conditions of the SLR system.