1 INTRODUCTION
Cosmic rays are not actual rays but rather are particles and ions that move at speeds close to the speed of light (∼1021 eV). They are composed mostly of protons and are generated by various sources, including extra-celestial bodies such as supernovas and their remnants, neutron stars, and black holes, as well as the Sun, other stars, and active nuclei. Excessive exposure to cosmic rays can be prevented by the Earth’s atmosphere and geomagnetic field. When cosmic rays enter the Earth’s atmosphere, they generate secondary particles successively by collision with atmospheric particles, such as nitrogen and oxygen molecules. Neutrons as secondary particles are detected by ground neutron monitors (Oh & Yi 2006;Bieber et al. 2013). Currently, “Spaceship Earth” is operated by the Bartol Research Institute at the University of Delaware as the global neutron monitor (Bieber et al. 2003, 2004). The real time data of neutron monitors are archived at Neutron Monitor Database (NMDB) (Mavromichalaki et al. 2011). Two domestic neutron monitors were installed at Daejeon (Oh & Kang 2013) and Jang Bogo station in Antarctica (Jung et al. 2016), and their observational data have been recently registered at NMDB.
The cosmic ray distribution is assumed to be spatially isotropic, but the cosmic ray intensity shows temporal variations at various timescales (Oh et al. 2008, 2010). This intensity, affected by extra-terrestrial factors from outside the Earth’s magnetosphere, exhibits periodic and sporadic variations. Periodic variations include diurnal, solar rotational (27-day), and solar cyclic variations. Oh & Kang (2013) demonstrated diurnal variations in data from the Daejeon neutron monitor, and Oh & Kim (2013) reported solar cyclic variations of cosmic ray intensity, including various solar interplanetary-geomagnetic parameters. Moon et al. (2017) examined the solar cyclic variation in the limb darkening coefficient using photospheric intensity data taken by SOHO and SDO. The estimated limb darkening coefficient also reflects the solar activity in its variations. Sporadic variations include Forbush decreases by interplanetary magnetic structures (Forbush 1937;Oh 2008;Oh & Kang 2013;Lee et al. 2015) and ground level enhancements from the abrupt increases in solar flares and solar proton events (Forbush 1946).
Diurnal variations are nearly sinusoidal-like variations of galactic cosmic ray intensity, with amplitudes of 1–2 %. The largest contributions to diurnal variation come from extraterrestrial sources. Diurnal variation is mainly caused by a local anisotropy in cosmic ray intensity. The galactic cosmic ray intensity is affected by anti-sunward convection and spiral-directed diffusion, with a minimum post-midnight and a maximum in the early afternoon in the local time sector. The phase and amplitude of a diurnal variation may differ from the idealized case because of drifts, local latitudinal gradients of cosmic ray intensity, varying levels of diffusion, or changing solar wind conditions.
The times of maximum and minimum cosmic ray intensity in the diurnal variation at solar maximum appear about 2–3 hours later than the solar minimum. In this paper, we define the term “maximum phase” as the local time of maximum cosmic ray intensity in the diurnal variation. The maximum phase is determined by the variation in the interplanetary magnetic field due to solar activity and by the cutoff rigidity due to the geomagnetic latitude (Oh & Yi 2006). Oh et al. (2010) analyzed diurnal variation using the “pile-up method” for high-latitude (Oulu, 1964–2006), middle-latitude (Rome, 1967–2006), and equator-located (Haleakala, 1953–2006) neutron monitors. To reduce the error in diurnal variation by the “pick-up method”, comprising of counting the days of each hour in which the maximum cosmic ray intensity appears, the “pile-up method” was used, which maps the profile of diurnal variation using the mean cosmic ray intensity. It was determined that the maximum phase is modulated by a 22- year cycle at high latitudes and by 11-year and 22-year cycles at the equator.
In this study, we used the cosmic ray data of neutron monitors near the Oulu and Rome neutron monitors, and expanded those to the data for solar cycle 24 (up to 2017). Then, we analyzed the solar cyclic variation in the maximum phase. In addition, we compared the diurnal variations between those obtained from the pile-up method and those obtained from harmonic analysis.
2 DATA AND METHOD
Table 1 shows the configurations for six neutron monitors (Hermanus in South Africa, Jungfraujoch in Switzerland, Kiel in Germany, Lomnicky Stit in Slovakia, Oulu in Finland, and Rome in Italy). As shown in Table 1, we selected four neutron monitors located at similar longitudes, close to the Oulu and Rome neutron monitors, which were used in a previous study (Oh et al. 2010). The range of the cutoff rigidity (0.81–6.27 GV) can consider the diurnal variation in the high and middle latitudes. Since the neutron monitors are located at similar longitudes, the local time at each neutron monitor is similar. We use the hourly cosmic ray data of six neutron monitors from NMDB (http://www. nmdb.eu/nest/) and the IZMIRAN network of cosmic ray stations (http://cr0.izmiran.ru/common/links.htm) during the period 1964–2017. Data for the period 1967–2017 are used for the Rome neutron monitor. We excluded the data of ground-level enhancements for each year and computed the profile of the diurnal variation for each year.
The pile-up method (Oh et al. 2010) determines the maximum phase using the mean cosmic ray intensity for each hour in one year. It is easier and faster than the conventional technique of harmonic analysis. Harmonic analysis computes the Fourier series by converting from the time function to the frequency function. Fourier series are used to determine the representative period that explains the natural phenomenon by converting from the time function to the period function. That is, a random periodic function unfolds to a series composed of trigonometric functions. The phase and amplitude of the main period are computed from the appearance, which is combined by several simple harmonic oscillations.
The maximum phase is determined in units of hours because of the use of hourly cosmic ray data. To determine the maximum phase in units of minutes, we applied the minimum variance analysis (Oh et al. 2010). First, we determined the maximum phase in units of hours and then scanned the region around the maximum phase at 0.1-hour intervals. At each point, we computed the difference (variance) between cosmic ray intensities during the preceding and following three hours. The time at the minimum absolute difference is the maximum phase in the units of minutes.
3 RESULTS
Fig. 1 shows the profiles of diurnal variation at six neutron monitors during the entire analyzed period: from top, Hermanus (HRMS), Jungfraujoch (JUNG), Kiel (KIEL), Lomnicky Stit (LMKS), Oulu (OULU), and Rome (ROME). The dashed line indicates the diurnal variation by pile-up method (PM), and the solid line represents that determined by harmonic analysis (HA). Diurnal variation by pile-up method is almost the same as that by harmonic analysis, but the profile from the pile-up method is not smooth at the maximum phase. The profile from harmonic analysis is smooth like a sine function.
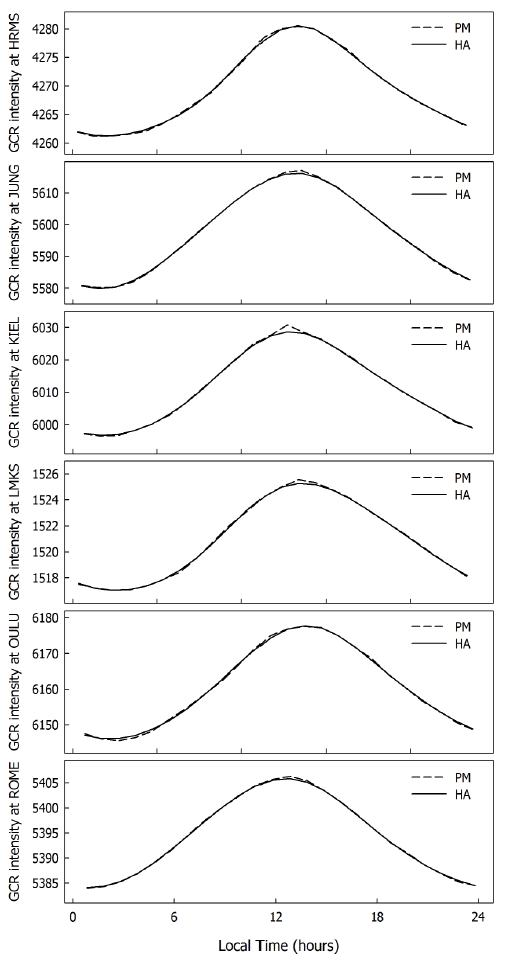
Table 2 shows the maximum phase and amplitude for the six neutron monitors by pile-up method and by harmonic analysis. The maximum phase is computed by minimum variance analysis. Since the six neutron monitors are located at a similar longitude, the maximum phases are similar values with a fine difference due to longitudinal difference.
Fig. 2 represents the maximum phase given by harmonic analysis in the relation to longitude of each neutron monitor from the diurnal variation in the six neutron monitors for the entire analyzed period shown in Fig. 1. The names in the figure indicate the neutron monitor station code shown in Table 1. Except for the Jungfraujoch neutron monitor, the maximum phase tends to become late as the longitude of the neutron monitor increases. This results from the local time effect from the Earth’s rotation.
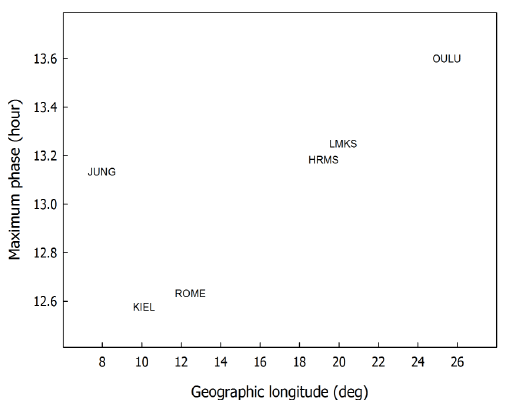
Fig. 3 shows the maximum phase by harmonic analysis in relation to the cutoff rigidity of each neutron monitor, from the diurnal variation in six neutron monitors for the entire analyzed period shown in Fig. 1. The display is the same as in Fig. 2. Except for in the Kiel neutron monitor, the maximum phase tends to occur earlier as the cutoff rigidity increases. That is, the maximum phase tends to appear later after noon as the cutoff rigidity decreases (as the geomagnetic latitude increases). As the cutoff rigidity decreases, the diurnal variation is determined by the cosmic ray intensity in low-energy particles. The diurnal variation is determined by the cosmic ray intensity in high-energy particles as the cutoff rigidity increases. The cosmic ray particles at low energies arrive later at the ground surface because of the refraction in the direction of progress, which is dependent on the magnetic field. The high-energy particles can reach the ground directly without refraction in the direction of progress due to the small effect of the magnetic field. Therefore, the maximum phase at the neutron monitor located at high latitudes (low cutoff rigidity) appears later because of the delay effect related to the energy of the cosmic ray particle.
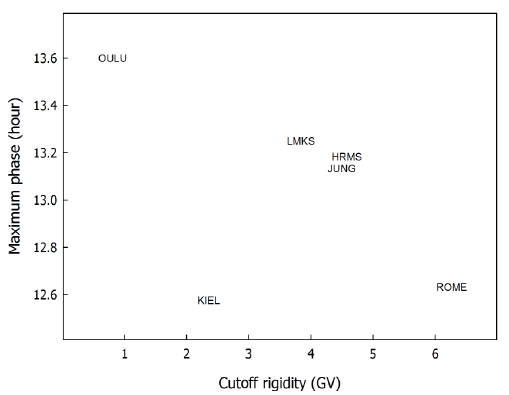
Fig. 4 shows the 3-year smoothed maximum phase by the pile-up method (the line with circle) and by harmonic analysis (solid line) at the six neutron monitors. Names indicate the neutron monitor station code. The maximum phases are modulated by the 22-year period at all neutron monitors. The maximum phase appears late in the solar minimum years of 1964, 1986, and 2008 and appears earlier in the solar minimum years of 1976 and 1996. These results agree with those from Oh et al. (2010). They suggested that the 22-year modulation of the maximum phase is determined by the drift effect due to reversal of solar magnetic polarity. The maximum phase in 1996 is earlier than that in 1976. Both diurnal variations analyzed by the pile-up method and via harmonic analysis show the similar trends, but the maximum phases in 1996 show large differences between the two methods at the Hermanus and Jungfraujoch neutron monitors.
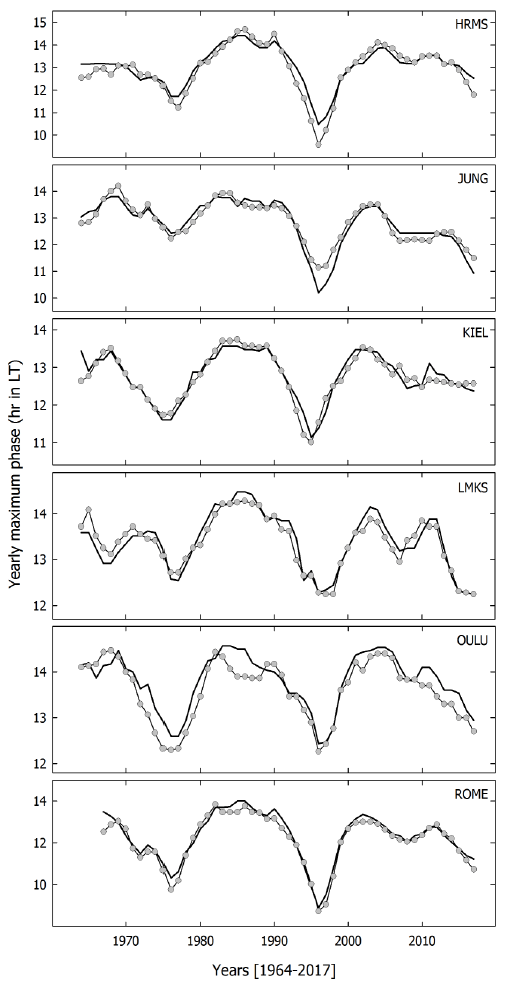
Fig. 5 shows the variation width of diurnal variation related to the solar cyclic modulation by harmonic analysis at six neutron monitors. Since a neutron monitor with high cutoff rigidity can be more affected by the solar cyclic variation in the interplanetary magnetic field, the width of the diurnal variation increases with cutoff rigidity. That is, the high-energy particles enter in the neutron monitor with high cutoff rigidity, and then, the magnetic field strength controls the high-energy cosmic ray intensity.
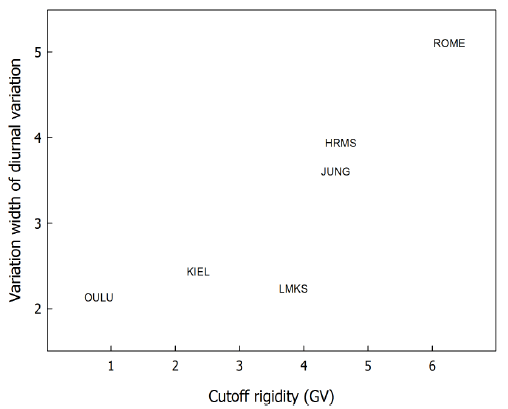
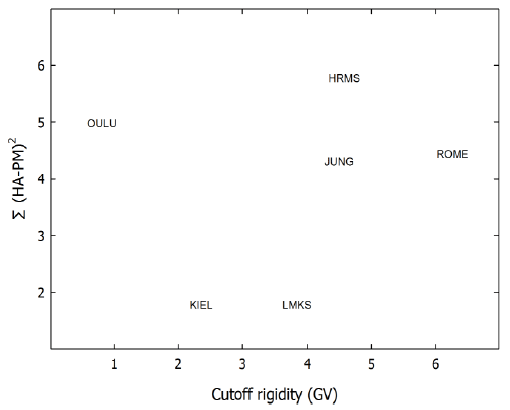
Fig. 6 represents the variance (summation of difference) in the maximum phase of each year between that determined by harmonic analysis and by pile-up method at six neutron monitors. The difference is computed considering the maximum phase since 1967. The Kiel and Lomincky Stit neutron monitors show the minimum difference, and the Hermanus neutron monitor has the maximum variance. We suspect that the difference in variance between the neutron monitors may result from different data management, number of counter tubes, and altitude of neutron monitor.
4 SUMMARY
The diurnal variation in the cosmic ray intensity shows a sinusoidal-like profile and has a maximum in the afternoon at local time by the combination of the gradient of the cosmic ray intensity near the Earth and the magnetic diffusion. To determine the maximum phase of diurnal variation, we used the pile-up method by Oh et al. (2010). In this study, we validated the pile-up method by comparison of the diurnal variations obtained by the pile-up method and by harmonic analysis. We analyzed the hourly cosmic ray intensity at six neutron monitors (Hermanus, Jungfraujoch, Kiel, Lomnicky Stit, Oulu, and Rome) during solar cycles 20–24 (1964–2017). They are located at a similar longitude and have a cutoff rigidity below about 6 GV.
The maximum phases at the six neutron monitors are distributed in the range between 12 and 1 pm for the entire analyzed period. This results from the similar longitudes of the neutron monitors. As shown in Figs. 1 and 4, the maximum phase by the pile-up method has an insignificant difference with that from harmonic analysis. The maximum phase obtained by the pile-up method is within ±1 hour of the maximum phase obtained by harmonic analysis. The difference in the maximum phases of each year obtained by the two methods tends to increase at the solar minimum. This study suggests that the pile-up method, which analyzes the diurnal variation by a simple process, can replace the complicated computation of harmonic analysis.
The solar cyclic modulation of the maximum phase shows a 22-year variation at all neutron monitors. Oh et al. (2010) could not analyze the diurnal variation in the recent solar cycle 24 because of analysis of data up to 2006. As revealed by the expanded study, the solar cyclic modulation of the maximum phase maintains a 22-year variation, which shows a delayed maximum phase in the solar minimum years of 1964, 1986, and 2008, and an earlier maximum phase in the solar minimum years of 1976 and 1996.
The amplitude (variation width) of solar cyclic modulation in the maximum phase increase as the cutoff rigidity increases. Additionally, the maximum phase appears earlier with the increase in cutoff rigidity. This trend is remarkable in the solar minimum year of 1996. As the cutoff rigidity increases, the high-energy cosmic ray intensity determines the trend of the diurnal variation. The high-energy cosmic ray particles can arrive at the ground surface directly by no refraction in the direction of progress, due to the smaller effect of the magnetic field. Then, the maximum phase appears close to noon.
The diurnal variation in the cosmic ray intensity can affect the profiles of sporadic variations due to solar activity, such as Forbush decreases and ground level enhancements. For instance, the main phase of the Forbush decrease combines with the decreasing phase of the diurnal variation, strengthening the Forbush decrease. Combining with the increasing phase of the diurnal variation can diminish or banish the Forbush decreases (Oh et al. 2008). With further study, we can analyze the effect of the geomagnetic field on the diurnal variation by examining the difference in the profile of diurnal variation and the seasonal change in the diurnal variation. At equinoxes and solstices, the geometric locations of the Sun and the Earth can affect the cosmic ray intensity by the change in the direction of the interplanetary magnetic field.


