1 INTRODUCTION
Solar activity driven by the solar magnetic field takes many forms such as solar flares, coronal mass ejections (CMEs), high-speed solar wind, and solar energetic particles. This solar activity associated with space weather has lasting effects on ground-based systems, satellites, and the Earth’s magnetosphere. It also causes solar limb darkening, solar wind density depletions in the solar cycle, changes in the solar wind density on the Martian bow shock, and alterations in the local distribution of lunar hydroxyl influenced by the solar insolation effect on the space environment in the solar system (Kim et al. 2011; Moon et al. 2017; Park et al. 2017; Kim et al. 2018). We can use data from neutron monitors recently installed in Jang Bogo station (Jung et al. 2016) on the ground to study the space environment. We have access to data from the High Energy Particle Detector (HEPD) (Sohn et al. 2012; Jo et al. 2014; Sohn et al. 2018) of Instruments for the study of Stable/Storm-time Space (ISSS) (Choi et al. 2014) onboard the Next Generation Small Satellite-1 (NEXTSat-1) (Shin et al. 2014a, b), which will be launched this year, to understand the plasma structures in the near-Earth space environment.
The Korea Astronomy and Space Science Institute satellite-1 (KASISat-1), consisting of four [TBD] nanosatellites, is scheduled for launch in the second half of 2020 for Small scale magNetospheric Ionospheric Plasma Experiments (SNIPE) to elucidate the properties of microscale (100 m–10 km) structures in the topside ionosphere (below the altitude of 1,000 km), particularly the fine-scale morphology of high-energy electron precipitation, cold plasma density/temperature, field-aligned currents, and electromagnetic waves. In order to work out the spatial and temporal variations of microscale plasma structures, the SNIPE mission consisting of four (TBD) nanosatellites (approximately 12 kg) will have a polar orbit at an altitude of 500–600 km (TBD). Two pairs of satellites will be deployed in orbit and the distances between each satellite will be in the range of 10 to 100 km, controlled by a formation flying algorithm. The SNIPE mission is equipped with scientific payloads which can measure the following geophysical parameters: the density/temperature of cold ionospheric electrons, energetic (100 keV ~ 1 MeV) electron flux, and magnetic field vectors. Among them, the Solid State Telescope (SST) will observe hundreds of keV of electron precipitations such as electron microbursts.
Electron microbursts are short duration (less than 1 sec) energetic electron precipitations into the Earth’s atmosphere, mainly observed in the recovery phase of geomagnetic storms at L=4–8 and 06–18 local times (Parks 1978). They were first discovered by X-ray balloon-borne experiments in the early sixties (Anderson and Milton, 1964). Electron microbursts with an energy > 40 keV were observed by the INJUN-3 satellite launched in 1963, after which Imhof et al. (1992) and Nakamura et al. (2000) reported observations of impulsive electron precipitation with energies > 1 MeV using a spacecraft experiment and called them relativistic microbursts. Electron microbursts were observed by STSAT-1, launched in 2003, which decomposed the parallel and perpendicular components of the particle flux. The observation, performed in the recovery phase of the geomagnetic storm that occurred on November 10, 2004, shows a microburst train composed of fine structures with a time duration less than 1 sec for 30 sec (Lee et al. 2005). Through this experiment, it was confirmed that the perpendicular (quasi-trapped) microbursts have harder energy spectra than the parallel (precipitating) microbursts, and that the loss cone is not filled.
Considering that the time duration of a microburst is less than 1 sec, a microburst electron should be generated by fast pitch angle diffusion somewhere in the middle of the bounce motion, because the captured 100 keV electron requires approximately 1 sec to undergo a bounce motion in the north–south direction. Therefore, the time taken to reach a low-Earth orbit (approximately 600 km) is determined by the location of the wave-particle interaction and the velocity of the electrons. Therefore, an energy dispersion should be observed if the microburst is observed with a sufficient time resolution. However, there is no report of observations of such an energy dispersion.
In our experiment, we observed the energy dispersion of the electron microburst and investigated the interactions of the energetic electrons with the chorus wave. The observations by multiple low-orbit satellites are expected to answer the following scientific questions.
-
1 How does the small electron precipitation structure exist and what is the mechanism of this precipitation phenomenon?
-
2 How do electron microbursts interact with waves?
-
3 How large is the contribution of the radiation belt loss owing to the microburst precipitation?
This paper discusses the instrument design of the SST on board KASISat-1. The Conceptual Design of the SST is delineated in Sec. II. The Expected Results are described in Sec. III. Finally, The Discussion and Conclusion are presented in Sec. IV.
2 CONCEPTUAL DESIGN OF THE SST
The electron flux measured by Science and Technology SATellite-1 (STSAT-1)-1 was below 104 (cm2 sec sr keV)−1 at 100 keV and below 103 (cm2 sec sr keV)−1 at 300 keV for the electron microbursts observed at solar maximum (Lee et al. 2005, 2006). Electron microbursts are observed at 50–70° during the storm recovery phase, mainly at dawn. This mission shall be launched in 2020. At that time, small storms may occur approximately two or three times a month. We will observe several microbursts with durations of less than 1 sec. The microbursts should partially fill the loss cone. Further, the flux will be observed differently depending on the pitch angle. In order to obtain approximate pitch angle information, two SSTs will be mounted: one in parallel to the Earth's magnetic field, and the other perpendicular. The SST observing the energetic electrons should be designed to have a fast sampling rate to enable observation of the microburst. The microburst will be observed in the fast mode in order to observe the energy dispersion of the microburst. The SST will measure energetic electrons with energies from ~ 100 keV to 400 keV at a low-Earth polar orbit to study the mechanisms related to the spatial resolution of electron precipitations, such as electron microbursts, and those related to the measurement of energy dispersion with a high temporal resolution in the sub-auroral regions.
Energy spectra are obtained from the linear energy transfer (LET) delivered to the silicon detectors when the incident particles pass through the them. LET values are given by the Bethe Formula (Bethe & Ashkin 1953) and can be easily estimated by GEometry ANd Tracking 4 (GEANT4) simulations. Linear energy transfer (LET) is described as the amount of energy that an ionizing particle transfers to the material traversed per unit distance. If we ignore the energy loss due to the trajectory of the particles incident on the material, the Bethe Formula can be approximated to the LET shown in Eq. (1). According to the International Commission on Radiation Units and Measurements (ICRU) (1970), the LET of a particle incident on the material, as shown in Eq. (1), can be expressed as dE/dx, and dE is defined as the average energy transmitted to the material as the particle travels a distance of dx. Thus,
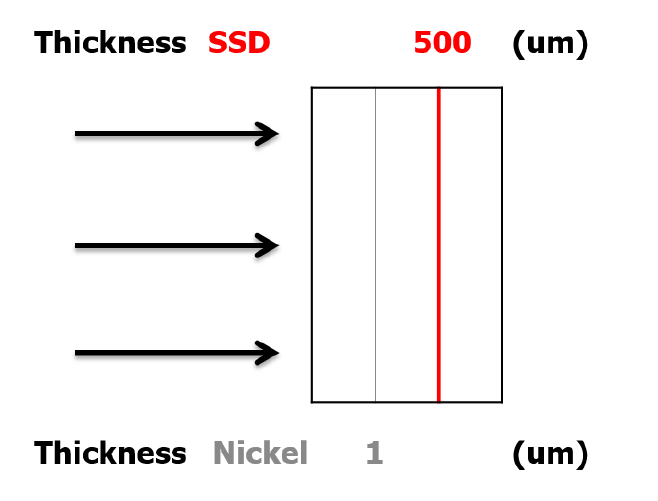
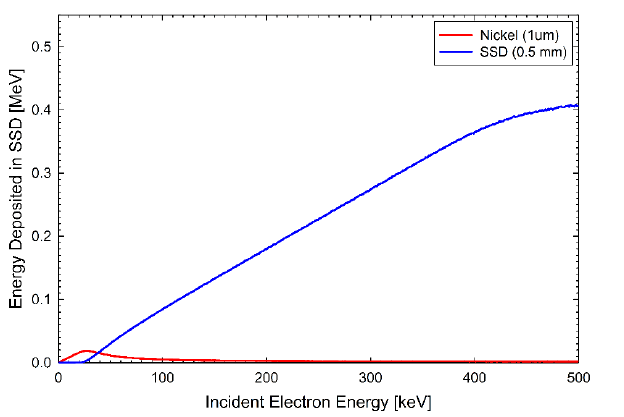
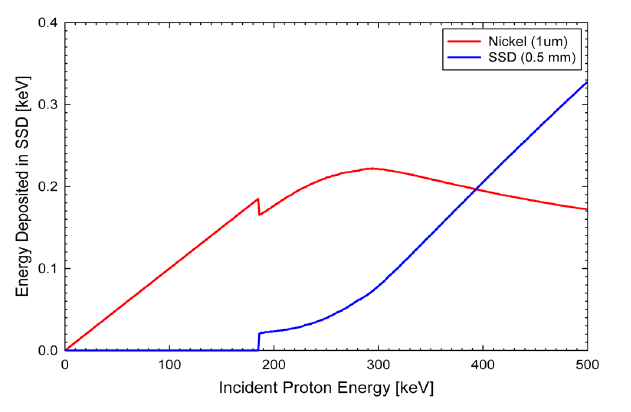
where t is the thickness of the material (thickness of the silicon sensor) and (-dE/dx) is LET to the material (siilicon sensor). This LET creates the electron-hole pairs in the material, which are then converted to an electrical signal by the bias voltage accross the sensor. Since LET shows different patterns depending on the energy, material, and the incident particles, the energy loss was calculated by the Bethe Formula and estimated by using GEANT4 simulations. We performed the simulations to determine the sensor design of the SST using GEANT4 and the Bethe formula. Figs 2 and 3 present the LET simulation results of the electron and the proton for the 0 - 500 keV range, after using GEANT4, for the SST structure described in Fig. 1 and Table 1. The simulation was performed in the range of 0 ~ 500 keV considering that the electron and the proton, which is to be detected in the space environment. A Nickel foil of 1 μm thickness was placed in front of the detector assembly to block low energy protons: the foil blocked protons with energies below ~ 200 keV. The LET values corresponding to the Solid State Detector (SSD) and Nickel are plotted in Figs. 2 and 3 for the electrons and protons that are incident on the detector. By using Nickel as a blocking material and adjusting the energy detection range based on these plots, we determined a total of 16 energy channels for the energy range of the SST. The detectors were the Fully Depleted Passivated Implanted Planar Silicon (PIPS) Detectors, FD series, with active areas of 50 mm2, whcih are commercially manufactured by CANBERRA> The SSD had a depletion depth of 500 μm. The SST was based on a silicon barrier detector and consisted of two telescopes that would be mounted on the satellite to observe the electrons moving along the geomagnetic field (pitch angle 0°) and the quasitrapped electrons (pitch angle 90°) during observations.
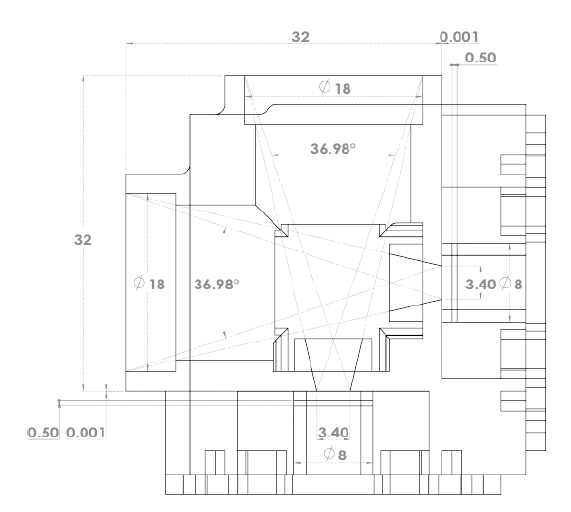
We determined the telescope design of the SST in view of previous measurements and the geometrical factor in the cylindrical geometry of Sullivan (1971). Assuming that the flux incident on the SSt is a uniform flux, the counting rate (C) is given by following equation.
Where I is the uniform flux G is the geometrical factor.
The geometrical factor for the SST telescope was determined in view of previous measurements by STSAT-1. With this in mind, the telescope was designed with the geometrical factor G = 0.02 (cm2·sr). If the geometric structure of the SST is assumed to be the symmmetrical cylindrical geometry as shown in Fig. 2 of Sullivan (1971), the geometrical factor of the telescope is given by the following equation:
where R1 is the radius of the front aperture, R2 is the radius of the rear aperture, and H is the distance between them. The geometrical structures as shown in Table 2 were calculated by a digital computer approximation simulation utilizing the Monte-Carlo method.
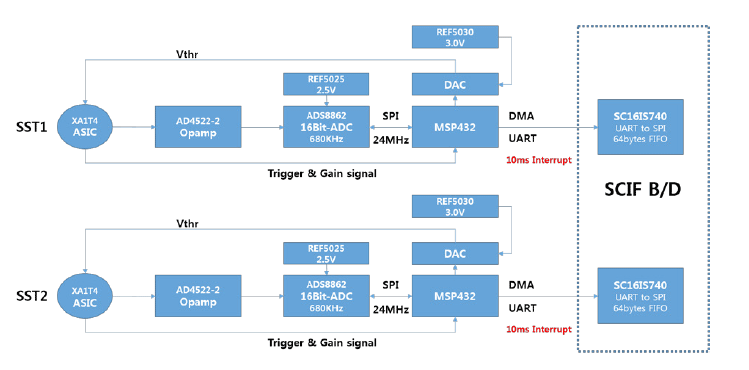
As shown in Fig. 4, the analog signals generated by the electrons are converted into digital signals through signal processing systems. Then, they are finally delivered to the On- Board Computer (OBC) of the spacecraft via the Spacecraft Interface Board (SCIF B/D) for transmission to the ground station. We shall use an application-specific integrated circuit (ASIC) in our nano-satellite mission due to constraints for the size and power reduction of the payloads. Both the National Aeronautics and Space Administration (NASA) and the European Space Agency (ESA) are currently developing various chipsets for particle detection front-end and back-end electronics. Such low power, low noise, mixed analog-digital particle detector front-end (PDFE) custom chipsets shall be tested for our mission. The SST will have high temporal resolution and sampling rates of about 10~100 Hz (TBD).
3 EXPECTED RESULTS
The spatial scale of the electron microbursts was described by Crew et al. (2016); further, it is expected that each microburst has a different spatial size. Therefore, we will observe the spatial distribution of the microbursts via the experiment.
The results of the observation will be compared to the spatial scale of the chorus waves observed by large satellites operating in the equatorial high-altitude region. This could also explain the occurrence of the electron temperature anisotropy of the magnetic field. The spatial scales of the chorus waves obtained using the simulation code and the observations can be compared with each other. Moreover, the time-dependent scale of the electron microbursts can be calculated to obtain the number of electrons that penetrate the Earth's atmosphere via microburst phenomena.
The energy dispersion of the electron microbursts observed by the SST will help determine the locations of microburst occurrences. If the waves interact with electrons at a different latitude, the shape of the energy dispersion will be different.
As shown in Fig. 5, through the expected design structure of the SST for SNIPE, we will obtain the spatial scales and energy dispersion of the electron microbursts.
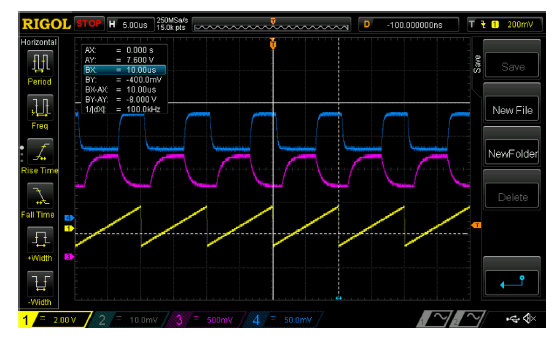
As shown in Fig. 6. The SST can have a sampling rate as high as 100 kHz by the SST analog board using the expected design structure.
4 DISCUSSION AND CONCLUSION
The SST for the SNIPE mission is focused on the spatial resolution of electron microbursts and the measurement of energy dispersion with a high temporal resolution. In order to observe electron microbursts, two SSTs capable of measuring electrons with energies in the range of 100 keV – 400 keV will be mounted on a satellite. One SST is intended for observing the electrons moving along the geomagnetic field (pitch angle 0°), the other SST is intended for measuring the quasi-trapped electrons (pitch angle 90°) during measurement. The direction of the Earth's magnetic field will be detected using a magnetometer mounted on the KASISat-1. To observe the spatial scale of the electron microbursts, the KASISat-1 consisting of four [TBD] nanosatellites will slowly separate the two satellites up to 100 km during the mission lifetime. It is expected that the statistical spatial scale of a microburst can be obtained. The spatial scale of the electron microbursts will indicate the spatial extent of chorus waves in the equatorial region and, eventually, the plasma irregularities. It is also known that, in the polar region, there are plasma structures with small spatial scales, although they have longer durations than electron microbursts. These structures are not easily distinguishable from the microbursts in a single satellite observation. However, multiple satellite observations, such as those of the SNIPE mission, will examine the existence of the small spatial scales of electron precipitation in the polar region. The measurement of the energy dispersions of microbursts will determine the location of the initiation of electron microbursts by wave-particle interactions. Thus, the SST for SNIPE will answer all questions regarding the occurrence of microbursts and the interactions with energetic particles


