


1 INTRODUCTION
There is growing evidence that solar activity is related to terrestrial weather and climate (Svensmark & Friis- Christensen 1997; Tinsley 2000; Roldugin & Tinsley 2004; Scafetta & West 2006; Burns et al. 2007; Haigh 2007; Burns et al. 2008; Cho & Chang 2008; Kniveton et al. 2008; Meehl et al. 2009; Gray et al. 2010; Cho et al. 2012; Gray et al. 2017; Lee & Yi 2018; Muraki 2018). Solar signals are statistically associated with synoptic scale variations; some examples include the El Niño-Southern Oscillation (ENSO) (e.g., van Loon et al. 2007; Meehl et al. 2008; van Loon & Meehl 2008; Meehl et al. 2009; Roy & Haigh 2010; Zhou & Tung 2010; Haam & Tung 2012; Roy & Haigh 2012), the quasi biennial oscillation (QBO) (Labitzke 1987; Labitzke & van Loon 1988; Sagir et al. 2015), and the North Atlantic oscillation (NAO) (Gray et al. 2013). Research has shown that the Earth’s climate system shows rhythms of the 11 yr solar cycle (Mazzarella & Palumbo 1992; Kavlakov 2005; Park & Chang 2013), Hale’s 22 yr cycle or the 18.6 yr lunar nodal cycle (Hodell et al. 2001; Hwang et al. 2005), and variations of even longer periods (Landscheidt 2000; Bettolli et al. 2010). Solar activity cycles seem to be linked with the climate variability on the Earth via changes in extreme ultraviolet (EUV) irradiance (Gray et al. 2017), the Earth’s magnetic/electric fields (Burns et al. 2007, 2008), galactic cosmic rays (GCRs) (Tinsley & Deen 1991; Pudovkin et al. 1997; Marsh & Svensmark 2000; Pudovkin 2004; Roldugin & Tinsley 2004; Haigh 2007; Bazilevskaya et al. 2008), solar energetic particle (SEP) events (Veretenenko & Thejll 2004; Mironova et al. 2012; Mironova & Usoskin 2013, 2014), interplanetary magnetic fields (Tinsley & Heelis 1993; Lam et al. 2013), or high speed solar winds (Zhou et al. 2016).
The impact of solar activity on extreme weather events, such as storms, droughts, and heatwaves, is considered crucial since extreme weather could cause serious natural disasters that threaten the human population. Solar influences on drought in the Korean peninsula during the period from 1913 to 2012 have been investigated by Park & Chang (2013) and Park et al. (2014). The statistical behavior of tropical storms in the western North Pacific was investigated to determine if there was a correlation with sunspot numbers (Kim et al. 2017). In their study, Kim et al. (2017) reported that, in the solar maximum periods (as compared with the solar minimum periods), tropical cyclones tend to form in the lower latitudes, reach their maximum strength in the lower latitudes, and finish their lives as tropical storms in the lower latitudes. Tropical cyclones occurring in the solar maximum periods also tend to form more eastward in longitude, reach their maximum strength more eastward in longitude, but end their lives as tropical storms more westward in longitude. Furthermore, tropical cyclones have somewhat higher maximum sustained surface wind speed during the solar maximum periods. Based on what they found, Kim et al. (2017) suggested that tropical cyclones occurring in the solar maximum periods and in the solar descending periods resemble those in the El Niño periods in their statistical properties.
Concerns about tropical cyclone activity have led to several theoretical and observational studies (Shen et al. 2000; Emanuel 2005; Trenberth 2005; Webster et al. 2005; Yoshimura & Matsumura, 2005; Gualdi et al. 2008; Zhao et al. 2009; Bender et al. 2010; Yamada et al. 2010; Gleixner et al. 2014; Scoccimarro et al. 2014). The detection of longterm trends in tropical cyclone activity has been a subject of interest (e.g., Camargo & Sobel 2005; Sobel et al. 2016). Regarding storm tracking in the Northern Hemisphere, midlatitude tropical cyclone activity tends to be decreasing, and high-latitude cyclone activity tends to be increasing (Kossin et al. 2014, 2016). More recently, Kossin (2018) further explored comprehensive data sets and reported that the tropicalcyclone translation speed decreased globally by 10 % over the period from 1949 to 2016. He has suggested that such a decrease is due to global warming with a weakening of summertime tropical circulation.
Motivated by this latest claim and to see if there are trends similar to those Kossin (2018) reported, we examined locations where tropical cyclones form in the western North Pacific Ocean, reach their lowest central pressure, and downgrade back to a tropical depression. Unlike most of the previous studies, where the focus was primarily on the number and/or intensity of tropical cyclones, we examined the locations of tropical cyclone occurrence/ development; these locations reflect a decrease or increase in recent tropical cyclone exposure in different regions and the likelihood that these storms threaten the human population. We also compared long-term trends in locations of tropical cyclone occurrence with variations of observed sunspot locations, the solar North-South asymmetry, and the southern oscillation index (SOI). The SOI is defined by an anomaly in the surface air pressure between Tahiti in the Pacific Ocean and Darwin in the Indian Ocean. For comparison, we calculated the linear correlation coefficient r between locations of tropical cyclones and the following data: total sunspot area, the solar North-South asymmetry, and the SOI. Secondly, we computed the power spectrum using the wavelet transform. By doing so, we hoped to find an imprinted signature that solar activity has an impact on the formation of a tropical cyclone as Kim et al. (2017) did. This paper is organized as follows. We begin with descriptions of the analyzed data and methods in Section 2. We discuss annual variations in tropical cyclone occurrence/ development in Section 3 and spectral properties of tropical cyclones in Section 4. Finally, we briefly conclude in Section 5.
2 DATA
For the current analysis we used the best track data for category three, four, and five tropical storms that occurred in the western North Pacific Ocean from 1977 to 2016; data was extracted from the Regional Specialized Meteorological Center1 (RSMC) in Tokyo where detailed data of tropical storms can be downloaded as text files. The data set contains center positions (latitude and longitude in tenths of degrees) at 00:00, 06:00, 12:00, and 18:00 universal time coordinated (UTC), the category of the storm, the maximum sustained surface wind speed (10 min averaged in knots), radii of winds of 30 knots (50 knots) or greater in nautical miles, and central pressures in hPa. As a result, we had data for 1,021 tropical storms. We decided to concentrate on tropical cyclones in the western North Pacific partly be-cause this region has a higher frequency of storms than any other tropical cyclone genesis basin and partly because these storms are likely to directly affect the Korean peninsula. We also utilized updated sunspot area data from the NASA website2, which is managed by the Marshall Space Flight Center. We extracted the sunspot area data (in units of millionths of a hemisphere) from the same period in which we analyzed tropical storms (from solar cycle 21 to solar cycle 24). The entire sunspot dataset is available as ASCII files; the files are separated into the northern hemisphere and the southern hemisphere. For the SOI, we downloaded data from the NOAA website3; this date provides various indices to study large-scale anomalies in space and time that control the variability of the atmospheric circulation.
The wavelet transform can yield the power as a function of both time (distance) and frequency (wave number). The wavelet transform is related to the Fourier transform and the Gabor transform as explained below. The Gabor transform, GT, is a function of two parameters: the time, t0, and frequency, ν. The Gabor transform is defined as(1)
Where S(t) is the signal and G(t) is the running temporal window. In effect, the Gabor transform is a harmonic analysis with a running window centered at a the time t0. This is simply the Fourier transform with a window, therefore the Gabor transform is a good mathematical mic roscope that can be used to increase the spatial resolution as one wishes for increasingly smnall scale variations. The wavelet transform, WT, then can be considered as the transform of a signal from an original wavelet by a dilation in time. That is, it is defined.(2)
where d is a dilation coefficient. Like the Gabor transform, the wavelet transform depends on two parameters: the time, t0, and the dilation coefficient, d. Hence, in the power spectrum of the wavelet transform, the information on the power of a signal is displayed in two-dimensional plots, showing variations of the power both with time (t) and frequency (ν=1⁄d).
3 ANNUAL VARIATIONS OF TROPICAL CYCLONES
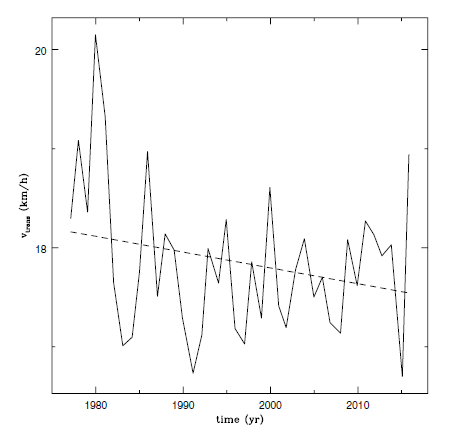
In Fig. 1, we show the translation speed of category three, four, and five tropical cyclones that occurred in the western North Pacific Ocean from 1977 to 2016. Solid and dashed lines represent the mean annual translation speed of the tropical cyclones as a function of time and the best fit of a linear function, respectively. During the period of the analysis (1977–2016), a decreasing trend of a few percent is clearly seen. Using just the category five tropical cyclone data gave similar results. This finding agrees with what Kossin (2018) has consistently observed in his analysis of datasets during the period from 1949 to 2016, in which tropical cyclones were investigated for the individual ocean basins, over land and water, for the northern and southern hemisphere, and in total. His results also suggest that the rate of the slowdown also varies by longitude and latitude.
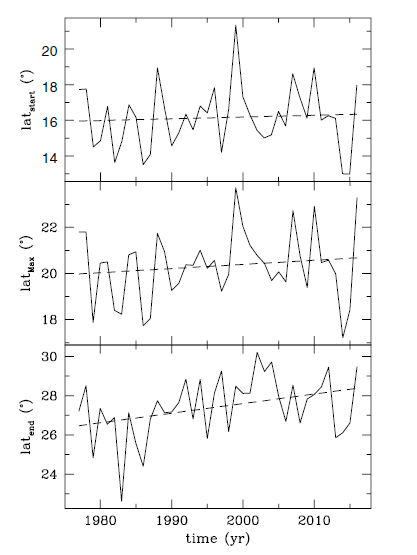
In Fig. 2, from top to bottom, we see the variation of latitudes for the following characteristics: where the tropical cyclones formed, where their central pressure became the lowest, and where they were terminated, respectively. A tropical depression is finally designated as a tropical cyclone when its maximum sustained wind speed exceeds 17 m/s for the first time. Similarly, a tropical cyclone is considered as finished when its maximum sustained wind speed goes below 17 m/s from a higher speed than 17 m/s. Solid and dashed lines represent the mean annual latitude as a function of time and the best fit of a linear function, respectively. Plots use data from category three, four, and five tropical cyclones that occurred in the western North Pacific Ocean. During the period of the analysis (1977– 2016), the latitudes are slightly increasing. Notably, the rate increase of the latitude where tropical cyclones are terminated is the largest. Using just the category five tropical cyclone data gave similar results. This finding agrees with previous studies that reported a poleward shift in the average latitude where tropical cyclones reach their peak intensity over the past decades (e.g., Trenberth et al. 2005; Kossin et al. 2014). The poleward shifting tendency can be a consequence of the weakening of the steering flow in the tropics (Oey & Chou 2016).
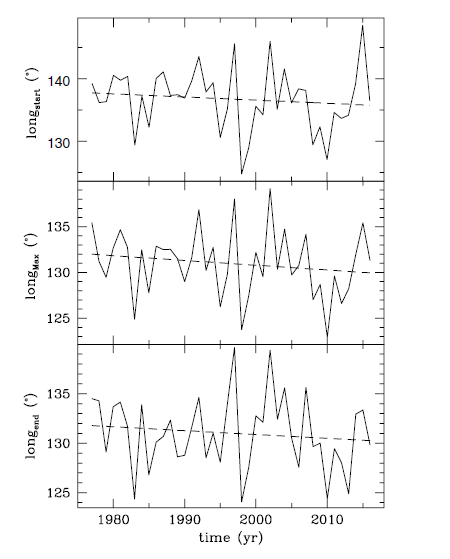
In Fig. 3, from top to bottom, we see the variation of longitudes for the following characteristics: where the tropical cyclones formed, where their central pressure became the lowest, and where they were terminated, respectively. Solid and dashed lines represent the mean annual longitude as a function of time and the best fit of a linear function, respectively. Plots use data from category three, four, and five tropical cyclones that occurred in the western North Pacific Ocean. During the period of analysis (1977–2016), the longitudes are slightly decreasing. This means that the location where tropical cyclones formed gradually shifted west with time. Subsequently, the location where they reached their maximum intensity and end of life gradually shifted west with time as well. Again, using just the category five tropical cyclone data gave similar results. This may have implications for the east-west shift of the tropical upper tropospheric trough that controls the longitude of tropical cyclogenesis (e.g., Wu et al. 2015).
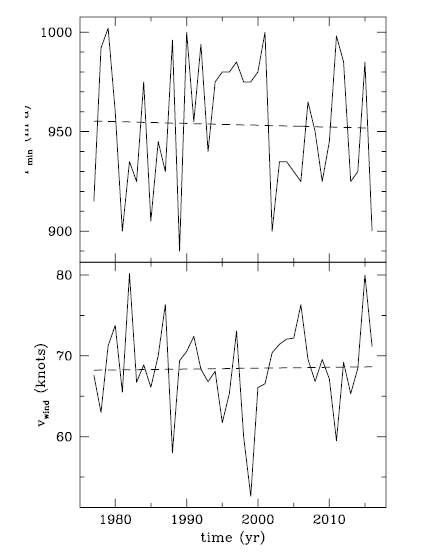
In Fig. 4, we show the variation of the lowest central pressure and the maximum sustained wind speed of tropical cyclones in the upper and lower panels, respectively. Solid and dashed lines represent the mean annual pressure and speed as a function of time and the best fit of a linear function, respectively. Plots use data from category three, four, and five tropical cyclones that occurred in the western North Pacific Ocean. A slight decreasing trend in the upper panel and a corresponding increasing trend in the lower panel are seen. While the average translation speed of tropical cyclones decreased, their average lowest central pressure also decreased and thus their intensity became stronger. Hence, a slower and stronger tropical cyclone has been able to pose a more serious hazard to the human population in recent years. If the atmospheric water vapor capacity of a tropical cyclone is increased as the sea surface temperature is increased, then precipitation rates near the tropical cyclone may also be expected to increase, making the damage from a tropical cyclone worse. More seriously, for category five tropical cyclones, we found the maximum sustained wind speed increasing at a rate of six percent during the period of analysis (1977–2016).
In Fig. 5, from top to bottom, we see the variation of the yearly average of the sunspot area appearing in both the solar northern (AN) and southern (AS) hemispheres, the solar North-South asymmetry (which is defined as the difference of the sunspot area appearing in the solar northern and southern hemispheres normalized by their sum, (AN−AS)/(AN+AS)), and the SOI for the period from 1977 to 2016, respectively. When values of the solar North- South asymmetry are positive, the northern solar hemisphere is more active, and vice versa. Solid and dashed lines represent the annual-means as a function of time and the best fit of a linear function, respectively. Interestingly, the annual average of the sunspot area (which indicates the level of the solar magnetic activity cycle) decreased, which may mean that we are living in a descending phase of the modern maximum in a long-term timescale. On the contrary, the average SOI is increasing and even becoming positive. Note that when the El Niño episodes prevail, the SOI is negative, and vice versa.
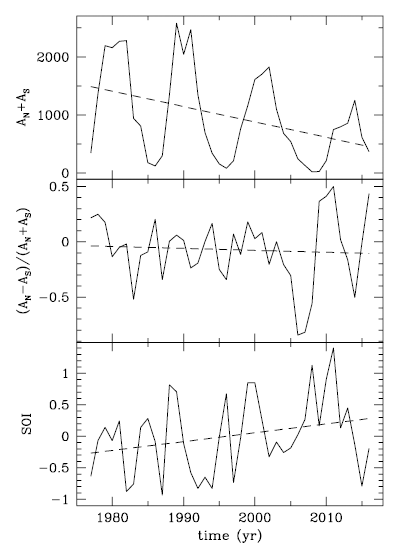
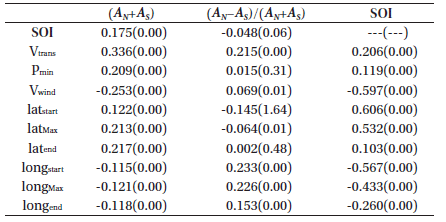
We calculated a linear correlation coefficient, r, between the specific latitudes, longitudes and other properties of category three, four, and five tropical cyclones occurring in the western North Pacific Ocean, and the solar parameters shown in Fig. 5. The solar parameters include the total sunspot area, the solar North-South asymmetry, and the SOI. In Table 1, the correlation coefficient is provided with the single-sided chance probability that |r| has an equal or larger value than its observed value in the null hypothesis. As shown in Table 1, the translation speed of tropical cyclones, their lowest central pressure, the latitude where the lowest central pressure occurs, and the latitude where the cyclones are terminated are weakly correlated with the total sunspot area, while their maximum sustained wind speed is weakly anti-correlated with the total sunspot area. The translation speed, longitude where the tropical cyclones form, and longitude where the central pressure becomes the lowest are only weakly correlated with the solar North- South asymmetry. The translation speed, latitude where the tropical cyclones form, and latitude where the central pressure becomes the lowest are marginally correlated with the SOI. On the other hand, the maximum sustained wind speed and the longitudes where tropical cyclones form, central pressure becomes the lowest, and the cyclones are terminated are marginally anti-correlated with the SOI. Therefore, we conclude that category three, four, and five tropical cyclones occurring in the western North Pacific Ocean from 1977 to 2016 cannot be correlated or anticorrelated with the solar cycle. However, some parameters of same tropical cyclones are marginally correlated or anticorrelated with the SOI. We repeated the same calculations using only the category five tropical cyclone data and found similar results.
|
4 SPECTRAL PROPERTIES OF TROPICAL CYCLONE
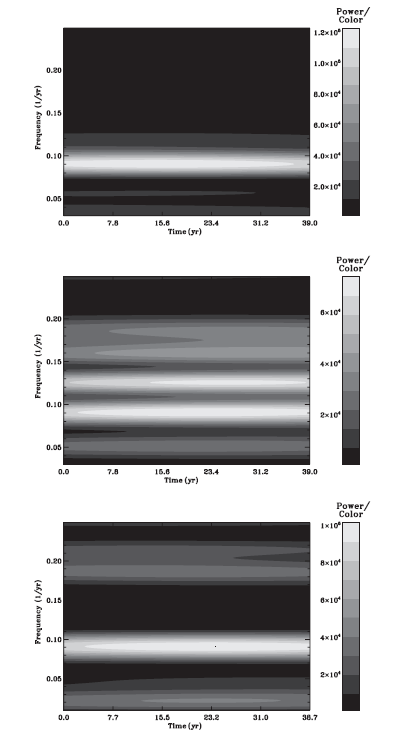
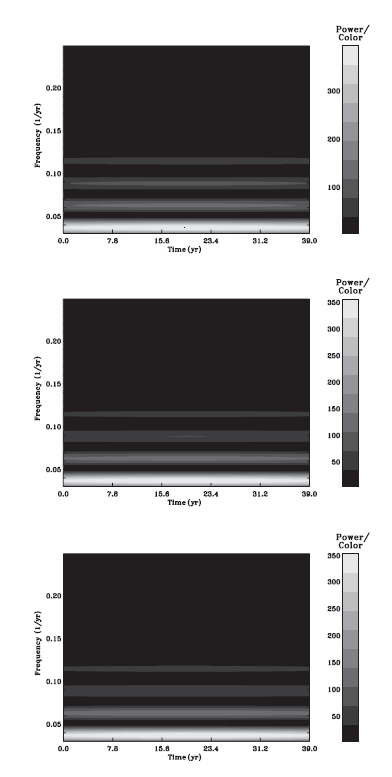
In Fig. 6, from top to bottom, we show the results of the wavelet transform analysis using the yearly average of the total sunspot area, the solar North-South asymmetry, and the SOI, respectively. The horizontal axis represents time in years starting from 1977, and the vertical axis is the cyclic frequency in . The power is shown in gray scale, which is scaled by the mean value of the noise so that the signal-to-noise ratio can be assessed. in the top panel, the dominant peak at approximately 0.09 in the power spectrum of the sunspot area, corresponding to approximately 11 yr, can be onviously noticed. Note that shorter periodicities, such as, ~5 yr, cannot be seen in this power spectrum simply because the signal-to-noise ratio of the main peak is dominantly large. Bearing in mind that one of the main advantages of the wavelet transform is to yield the variation of the power at a frequency as a function of time, the power at approximately 0.09 is likely present for the period from 1977 to 2016. On the other hand, looking at the results from the solar North-South asymmetry (shown in the middle panel), besides the main peak at approximately 0.09 , another peak at approximately 0.125 , corresponding to approximately 8 yr, is also seen. Looking at the results from the SOI (shown in the bottom panel), we see not only the dominant peak appearing at approximately 0.09 , but also another peak can be found at approximately 1.185 , corresponding to approximately 5.4 yr, with magnitudes similar to the signal-to-noise ratiio. According to our wavelet transform analysis, the SOI seems to share spectral features with the 11 yr solar cycle. Even though they may share spectral features, this does not mean that the 11 yr solar cycle drives the ENSO. To understand the causal connection between these two, further theoretical examinations are demanded.
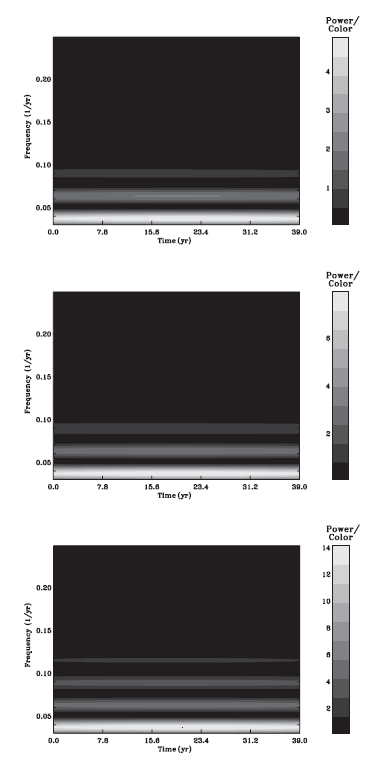
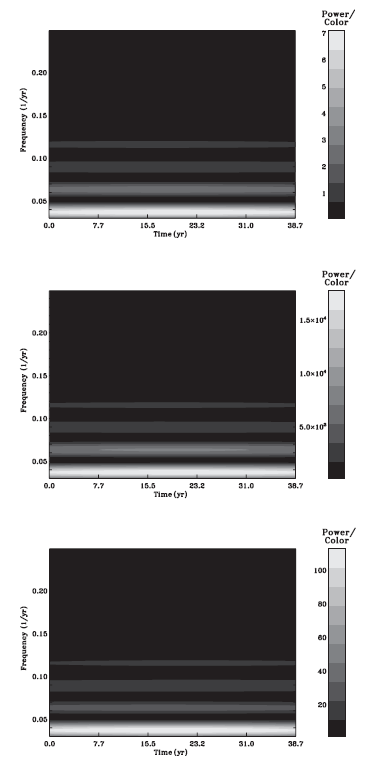
In Fig. 7, from top to bottom, we show the results of the wavelet transform analysis from data employed for the plots shown in Fig. 2. The horizontal axis represents time in years starting from 1977, and the vertical axis represents the cyclic frequency in . The top panel uses the data from the latitudes where topical cyclones formed. Here, even though the 11 yr periodicity is seen, it is inconspicuous. The main peak appears at approximately 0.04 , corresponding to approximately 25yr. This might be due to the Pacific Decadal Oscillation (described as a long-lived El Niño-like pattern of Pacific climate variability) or the multi-decadal modulations o fthe multivariate ENSO Index. In the middle and bottom panels, which show results from latitudes where the central pressure becomes the lowest and where the cyclones are terminated, similar features are observed in the power spectra seen in the top panel. Based on your results, we consider that variations in latitudes of tropical cyclones are not noticeably modulated by solar activity. We suspect that even a peak with a periodicity of 11 yr may have nothing to do with the 11 yr solar cycle. In Fig. 8, from top to bottom, we show the results of the wavelet transform analysis from data employed for plots shown in Fig. 3. The horizontal axis represents time in years starting from 1977, and the vertical axis represents the cyclic frequency in . The power is shown in gray scale. Features in all power spectra shown here appear the same as in Fig.7. As discussed in Fig.7, we consider that variation sin longitude of tropical cyclones are not noticeably modulated by solar activity. In Fig.9, from top to bottom, we show the results of the wavelet transform analysis from the translation speed of tropical cyclones, the lowest central pressure, and the maximum sustained wind speed of the tropical cyclones, respectively. The power spectra all appear the same as in Fig. 7 or Fig. 8. No evidence showing that properties of tropical cyclones are modulated by solar activity was found, at least not in terms of a spectral analysis using the wavelet transform method.
5 SUMMARY AND CONCLUSIONS
The sunspot cycle is known to be related to the terrestrial weather and climate. Solar influences on extreme weather are particularly crucial because the Sun may play a role in recently accelerated global-warming. A better understanding of the causes of extreme weather events including the solar solarterrestrial connection is highly desired to prepare for and minimize the damage of disasters threatening the human population. In addition to discussing several studies on tropical cyclones, we have attempted to explore positions of tropical cyclone occurrence/development and other cyclone characteristics. In this paper, we have examined category three, four, and five tropical cyclones occurring in the western North Pacific Ocean from 1977 to 2016 to determine if there is a general trend over this period and to compare long-term trends in positions of tropical cyclone occurrence with those in variations of the observed sunspot area, the solar North-South asymmetry, and SOI.
Our main findings are as follows:
(1) Latitudes where tropical cyclones formed, where their central pressure became the lowest, and where they terminated increased. The latitude where the tropical cyclones terminated increased the most. Longitudes where tropical cyclones form, where the central pressure became the lowest, and where they terminated decreased such that they appeared more westward in longitude. The lowest central pressure of tropical cyclones has become lower and thus their intensity has become stronger. If the atmospheric water vapor capacity of a tropical cyclone is increased, then precipitation rates near the tropical cyclone may be also expected to increase making the damage from a tropical cyclone worse. The annual average of the total sunspot area is in general decreasing, and the SOI is increasing.
(2) Tropical cyclones cannot be correlated or anti-correlated with the solar cycle. However, some parameters of same tropical cyclones are marginally correlated or anticorrelated with the SOI.
(3) The power spectrum of the SOI using wavelet analysis shows not only the dominant peak appearing at approximately 0.09 , corresponding to approximately 11 yr, but also another peak at approdimately 1.185 , corresponding to approximately 5.4yr. To study the causal connection between these two results, further theoretical examinations are needed. No evidence showing that properties of tropical cyclones are modulated by solar activity was found, at least not in terms of a spectral analysis using the wavelet transform method. They show rather a periodicity of approximately 25 yr, which could be due to the Pacific Decadal Oscillation or the multi-decadal mod-ulations of the Multivariate ENSO Index.