


1 INTRODUCTION
Since the existence of the Earth ionosphere was revealed by radio communication across the continent, a variety of methods were devised for ionospheric observations and research. Ground based radio observations by ionosonde and radar provide useful tools for studying local features of the ionospheric variations, while in situ measurements onboard balloons, rockets, and satellites have been a basic and unique tool for establishing a number of ionospheric models such as international reference ionosphere (IRI) (Bilitza et al. 2011) and thermosphere ionosphere electrodynamic general circulation model (TIEGCM) (Qian et al. 2014). Recently, the GPS-driven ionospheric observations (Mannucci et al. 1998) became an irreplaceable tool for monitoring the global distribution of the ionospheric plasma distribution although it is just limited to the total electron content which is the integrated columnar electron density.
The spatial limit of the in situ measurement of the ionosphere can now be overcome through the constellation of small satellites. The innovative space access by CubeSats will provide even more frequent and dense measurements of the ionospheric plasma. Since various countries and institutes are developing their own plasma instruments, it is essential to calibrate the plasma sensors before flight in a plasma chamber within which a plasma environment similar to the destined orbits is generated. A space plasma chamber was built first in Korea within Satellite Technology Research Center (SaTReC), Korea Advanced Institute of Science and Technology (KAIST) for the purpose of calibration of plasma instruments and laboratory experiments on various phenomena of the space plasma. The space plasma chamber was actually utilized in the calibration of the Langmuir probe for LINK CubeSat, which was successfully launched in 2017 (Na et al. 2016).
To generate a stable plasma in a large vacuum chamber filled with nitrogen gas, a back-diffusion-type plasma source was devised and installed in the door side of the vacuum chamber. A disk-type Langmuir probe was utilized to check the generation and characteristics of the plasma inside the chamber. In this paper, the physical conditions of the generated plasma measured by the Langmuir probe are introduced and possible applications of the plasma chamber are discussed.
2 BACK-DIFFUSION-TYPE PLASMA SOURCE
Gas discharge refers to the phenomenon of separation of electrons from gaseous atoms or molecules. Natural gas discharge takes place when lightning occurs or when the ionospheric layer is formed in the upper atmosphere. The artificial gas discharge has various applications such as fluorescent light, neon signs, plasma display panels (PDPs), and dry process equipment used for manufacturing semiconductors or thin film solar cells. Artificial gas discharge generally utilizes an electric field so that the electrons are accelerated rapidly enough to ionize the atoms or molecules through collisions. According to the frequency of the used electric field, the gas discharges are classified as DC, mid frequency (1 Hz ~ 102 Hz), or microwave (108 Hz ~ 109 Hz) discharges. The DC discharge plasma generation is suitable for calibration of the space plasma instruments because of the stability and low noise during the experiment. The plasma parameters of the ionosphere were summarized by Boyd & Raitt (1965), as shown in Table 1. Since the main objective of the plasma chamber is to simulate the ionospheric conditions, the values were guidelines in designing and operating the plasma source and chamber.
Various types of plasma sources have been used in generating plasma similar to the ionospheric conditions (Stone & Rehmann 1970; Gekelman et al. 1991). In building the space plasma chamber at SaTReC, the back-diffusion-type plasma source (Takayama et al. 1967; Kawai & Ikegami 1970) is used. This type of plasma source was used in the space plasma chamber at ISAS/JAXA in Japan and space plasma operation chamber (SPOC) at National Cheng-Kung University (NCKU) in Taiwan and its usefulness was demonstrated, especially in the calibration of Langmuir probe (LP), retarding potential analyzer (RPA), and ion drift meter (IDM). A back-diffusion-type plasma source utilizing tungsten wires as cathode material was built at SaTReC in the last decade (Park 2000; Lee 2002), firstly in Korea and used for calibration of subsequent satellite missions. In this study, the cathode filaments were substituted by nickel wires to enhance the emission efficiency at lower temperature.
A schematic diagram of the plasma chamber and the plasma source is shown in Fig. 1(a). A vacuum chamber with a diameter of ~1.5 m equipped with a turbo pump was utilized in the experiments. Pure nitrogen gas is supplied into the chamber through the digital flow controller. The chamber is pumped out to reach 10-6 Torr and then filled with nitrogen gas to maintain 10-4 Torr. The back-diffusiontype plasma source consists of cathode filaments at the front, a grid anode near the filaments, and a plate anode at the rear side. The source itself is encompassed by a glass cylinder to diminish the electric field distortion, which otherwise can be intensified by the plasma source electrodes and by the conductive chamber structure. The electric field inside the plasma source is controlled by the voltages imposed to the grid and plate anodes, as shown in Fig. 1(b). The grid anode does not absorb the electrons emitted by the cathode filaments. Instead, the grid anode enhances the thermal electron emission from the cathode filaments. The electrons that passed the grid anode are further accelerated toward the plate anode. The electrons gain enough energy to ionize the nitrogen molecules, which exist in the background and generate N2+ ions. The N2+ ions are then accelerated into the chamber. Some of the electrons flow into the chamber with N2+ ions and the others are further accelerated to the plate anode to form the plate anode current.
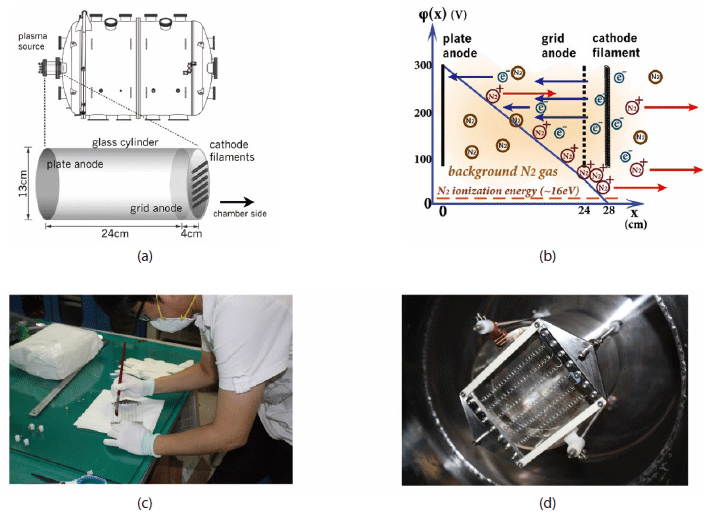
The cathode filaments are made of nickel wire and coated with carbonate solution, as shown in Fig. 1(c). These carbonates are compounds of Ba, Sr, and Ca, occurring as homogenous crystallites with an isomorphous crystal structure (Transene Company Inc., http://transene.com/cathode/), carefully dispersed in a lacquer vehicle, nitrocellulose in our case. Upon heating, the carbonate coatings are converted to semiconductor oxides of Ba, Sr, and Ca. These oxides are characteristically n-type and exhibit high electron conductivity. The wire is helically wound to prevent unwanted bending, which can result in electrical short with the grid by thermal expansion. The cathode filament is heated over 1,000°C to emit thermal electrons by imposed current of ~25 A. The current is increased slowly to protect the wire from fast sublimation of the carbonate coating. Fig. 1(d) shows the cathode filament installed inside the vacuum chamber. The four stainless rods act as electrodes to the filaments, grid anode, and plate anode, while supporting the overall structure.
3 LANGMUIR PROBE FOR DIAGNOSING PLASMA CONDITION
The Langmuir probe was invented by Langmuir & Mott- Smith (1924a, b, c, d, e) and has been an essential tool for plasma diagnostics. Since the Langmuir probe was first flown onboard a V-2 sounding rocket (Reifman & Dow 1949), various types of Langmuir probes have been flown in many sounding rockets and satellite missions. Recent missions such as CHAMP (Rother et al. 2010), DEMETER (Cussac et al. 2006), SWARM (Buchert et al. 2015), and DMSP (Green 2001) employ Langmuir probes because the two basic parameters of Te and Ne are essential in understanding the variation of the ionosphere and plasma-sphere (Oyama 2015) in which low earth orbit satellites are passing through. Langmuir Probes have been used in several Korean low earth orbit (LEO) satellites (Lee et al. 2013) since 1999.
A disk-type Langmuir probe, which is a simplified version of the Langmuir probe of NEXTSAT-1 (Choi et al. 2014) was utilized in checking and diagnosing the plasma generated in the chamber in the present study. Fig. 2(a) shows the appearance of the chamber with various power suppliers and measuring instruments connected via feedthroughs, while Fig. 2(b) shows the disk-type Langmuir probe installed in the chamber. The Langmuir probe has a disk in the center and a circular disk surrounding the disk referred to as a ‘guard ring’. The role of the guard ring is to prevent distortion of the electric field around the probe by imposing the same potential as the probe.
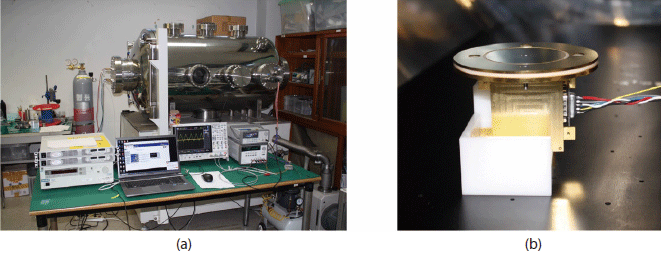
Fig. 3(a) schematically illustrates the Langmuir probe electronics. The circuit consists of several operational amplifiers to supply designated voltage to the probe and the guard ring, and then to pick up the current flowing through the probe. A triangular wave with 10 Hz was supplied to the probe and guard ring. The differential amplifier marked as ‘DIFF’ in the schematic diagram selects the current by comparing the voltage of the probe side from the imposed voltage. A data acquisition device (National Instrument) was connected after a ‘×1’ buffer OP amplifier to obtain the digitized voltage, which can be converted to the probe current.
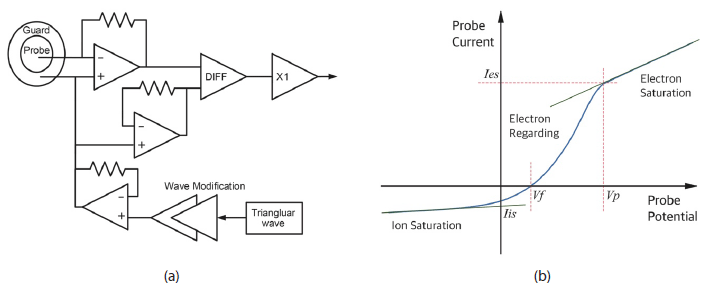
When the potential, VB, is imposed, the current I(VB) flows through the probe by the reaction of the plasma. A typical characteristic I-VB curve is shown in Fig. 3(b). Vp and Vf represent the plasma potential and floating potential respectively. Vf is defined as the probe potential when the probe current is zero. When the imposed probe potential (VB) is equal to the plasma potential (VB = Vp), the probe electrode is electrically at the same potential as the plasma. Since the mobility is much higher for the electrons than for ions, more electrons can flow into the probe. In this case, the current is flowing out of the probe, and this is defined as the positive direction.
If the probe potential is increased above the plasma potential (Vp), the electric field is induced on the probe surface so that the electrons are attracted while the ions are repelled. Near the probe surface, more electrons are gathered to cancel out the electric field and this region is called the electron sheath. Since the thickness of the sheath does not change quickly, the current increases slowly as the probe potential increases. This region, as marked in Fig. 3(b), is called the electron saturation region. Meanwhile, when the probe potential is lowered below Vp, the ions are accelerated toward the probe and the electrons start to be repelled so that the electron current is reduced quickly. This region is called the electron retarding region. If the electrons have a Maxwellian distribution, then the current will have exponential dependence, as shown in Fig. 3(b). When the probe voltage is further lowered below Vf, the ion sheath is formed and the current is saturated analogously. This region is called the ion saturation region. The I-V curves in the regions are given as the following equations (Lebreton et al. 2006).
where, Ni represents the ion density, Ne the electron density, Te the electron temperature, k the Boltzmann constant, Ac the surface area of the probe, e the electron charge, V the voltage with respect to Vp, Mi the ion mass, and me the electron mass, respectively. By applying the above equation to the I-V curve, the electron temperature can be derived in the electron retarding region, while the electron density can be determined in the electron saturation region.
The Debye length, λD, of plasma can be derived using the equation in (Chen & von Goeler 1985) as,
where ε0 is the permittivity of free space, kB is Boltzmann’s constant, Te is the electron temperature, ne is the electron density, and qe is the electron charge. For plasma chamber, we take ne ≈ 1011 m-3, and Te ≈ 2,000 K. Then, the Debye length is given as,
Because the sheath length of plasma chamber is a few times of the Debye length (Wang & Wendt 1999), we can assume that the sheath length is less than 0.1 m. The plasma chamber in SaTReC has a diameter of ~1.5 m and we put the Langmuir probe at center of the chamber in experiment. Therefore, we conclude that the sheath of plasma chamber doesn’t influence the measurement of Langmuir Probe.
After installing and checking the Langmuir probe inside the chamber, the cathode filament is integrated with the plasma source structure. The filament itself cannot be used again because of thermal and chemical degradation. It takes ~12 hours to reach 1.0×10⁻⁶ Torr after turning on the turbo pump. The filament is heated slowly with a rate of ~1 ampere per 10 minutes. By experience, heating with ~30 A is suitable for stable generation of plasma. The filament itself has an electrical resistance of ~5 Ω. Once the cathode filament is heated enough, the nitrogen gas is filled into the chamber up to 1.0×10⁻⁴ Torr, which corresponds to ~3.5×10¹² neutral particles per cm3. Finally, the grid anode and the plate anode are turned on to the designated voltage, as shown in Fig. 1(b).
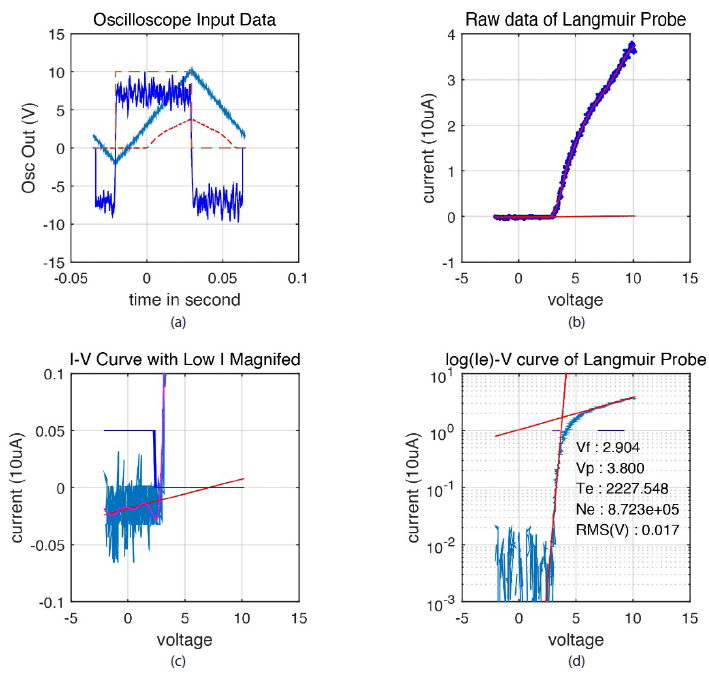
Plasma is generated once the grid and plate anode voltages are raised over ~40 V and ~200 V respectively. Fig. 4 shows an example of the I-V curve when the grid and plate electrodes are supplied with 90 V and 350 V. Fig. 4(a) shows the reaction of the Langmuir probe to the 10 Hz saw tooth shape input signal. The triangular wave with sweeping voltage from -2 V to 10 V is indicated by a blue line and the probe current is shown as a red dashed line. The I-V curve in linear scale is plotted as Fig. 4(b). The data are smoothed by the spline fitting method for further data analysis. The floating potential is identified by finding the zero current. The ion saturation current and the noise in root mean square (RMS) are provided in Fig. 4(c). Finally, the I-V curve with I in logarithmic scale and the other parameters are then identified. Since the current has an exponential relation with the voltage in the electron retarding region, the electron temperature can be found from Eq. (2) by identifying the slope of the linear region as shown in Fig. 4(d). Vp can be derived by identifying the intersect of the linear extensions of the retarding region and the electron saturation region and by applying Eq. (3) since V=0 at the plasma potential. In this case, Te is about 2,300 K, while Ne is about 8.7×105 cm3, which are compatible with the typical parameters of the ionosphere shown in Table 1.
4 RESULTS AND DISCUSSIONS
There are many parameters that can affect the performance and characteristics of the plasma source. Three major parameters are the grid voltage, the plate voltage, and the filament condition. Among them, the filament itself has a few factors that can affect the performance. For example, the concentration of the carbonate coating is proportional to the lifetime of the plasma source. Typically, the plasma source lasts several hours and thus the experiments should be completed in a few hours. Given that the filament condition is properly controlled, the grid and plate voltages are the residual parameters for controlling the plasma source.
The characteristics of the plasma source were investigated varying Vplate and Vgrid, and the results are shown in Fig. 5. The plasma parameter variations, when Vplate varies with Vgrid fixed at 50 V, are shown in Figs. 5(a) and 5(b). Each graph shows two parameters in a plot. In the case of Fig. 5(a), the Ne variation is marked as black squares, while the Te variation is marked as red circles. In Fig. 5(b), the plate current is shown with Ne to investigate the possible correlation between the generated plasma density and the plate current. The most interesting feature is that Ne is not proportional to Vplate. Instead, Ne increases abruptly at Vplate ~ 200 V and then slowly decreases as Vplate is raised to ~400 V, as shown in Fig. 5(a). Meanwhile, Te increases as Vplate is raised. The plate current is an important parameter of the plasma source since it measures the number of electrons that reach the plate anode. As Vplate is increased, the plate current gradually increases as shown in Fig. 5(b). This implies that fewer electrons participated in ionizing the neutral nitrogen by collisions and only passed to the plate anode. The reason will be discussed briefly later in this section.
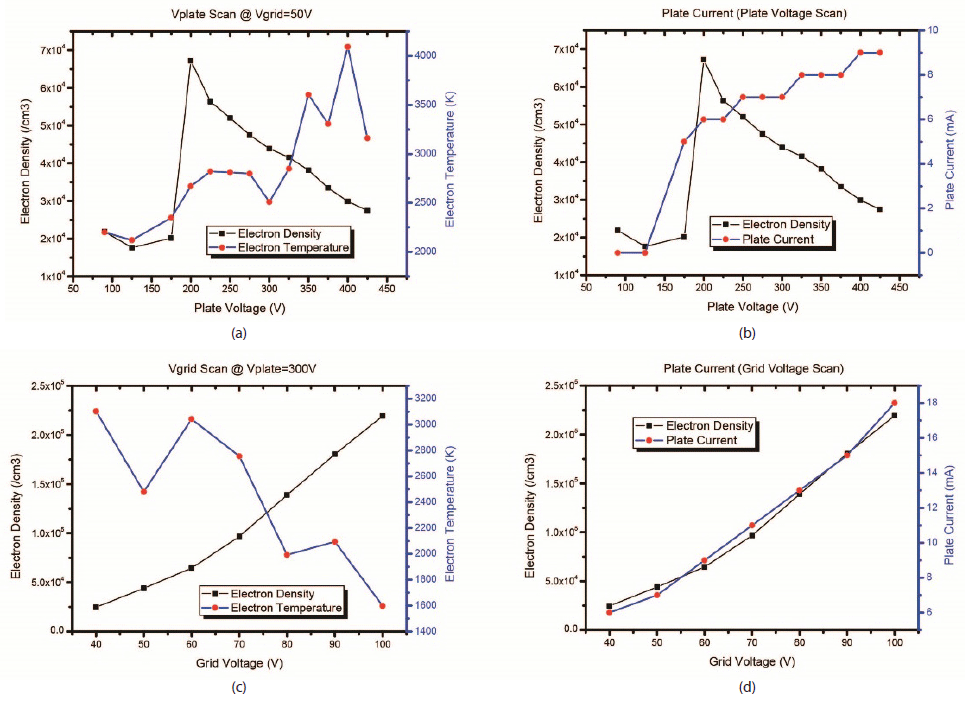
Figs. 5(c) and 5(d) show the same parameters when Vgrid is scanned from 40 V to 100 V with Vplate fixed at 300 V. In contrast with the Vplate scanning case, the electron density is almost proportional to Vgrid. Meanwhile, Te appears to be inversely proportional to Vgrid. As shown in Fig. 5(d), the plate current is also proportional to Vgrid. This implies that Vgrid can be used to control the electron density inside the plasma chamber. In the case of the electron temperature, Vplate shows clearer sensitivity than Vgrid. Since Vgrid determines the efficiency of the thermal electron emission from the filament, Vgrid should be proportional to the number of electrons, emitted from the filament, which are further accelerated to the plate anode. The electron density of the plasma generated between the grid and the plate anodes by collisions of electrons and N2 molecules hence should be proportional to Vgrid.
It was pointed out that Ne increases abruptly at Vplate ~ 200 V and decreases as Vplate is raised above this point. Vplate determines how much energy the electrons can acquire via acceleration by the electron field. Although the phenomenon is not fully understood, the cross-section for electron-impact ionization of N2 (Straub et al. 1996) can provide the overall reason. Fig. 6 shows the cross-section curve as a function of incident electron energy drawn based on the values introduced in the form of a table in their work. Since the electrons emitted from the filaments are accelerated from the electrical ground, Vplate implies the energy that the electrons obtain near the plate electrode. If Vplate is 100 V, then the electrons can reach ~100 eV near the plate anode in principle. According to Straub et al. (1996), the ionization cross-section of electron impact has a maximum value of ~1.95×10⁻¹⁶ cm2 at ~95 V and the threshold energy is ~15 eV.
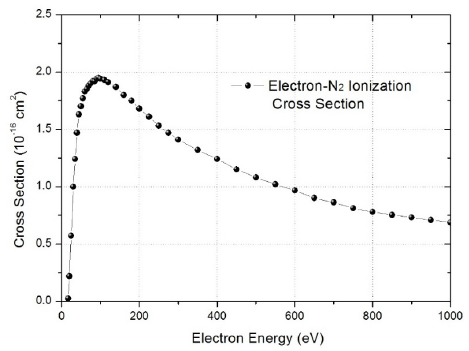
The Vplate-Ne characteristics of Fig. 5(a) do not exactly follow the ionization curve. The onset plate voltage, from which the plasma is efficiently generated, is ~200 V, which is about twice larger than the maximum cross section energy. This implies that the plasma generation takes place efficiently when the secondary electrons, which are generated during the collision process, participate again in the ionization process. Since the electron impact on a N2 molecule produces N2+ and an electron detaches from the molecule, the reaction can be expressed as follows,
where e* represents the secondary electron. Meanwhile, if Vplate is increased beyond ~200 V, more electrons are absorbed to the plate electrode without collisions. Since the kinetic energy of the produced ion (N2+) and electron is higher for the higher electron impact energy, Te should be higher for a higher Vplate, which is consistent with the experimental results.
So far, the characteristics of the plasma chamber were introduced. As described in the introduction section, the possible applications and necessity of the in-situ ionospheric experiments are briefly discussed. The ionospheric phenomena have various effects in many ways. Since radio signals from the ground and satellites are reflected by or transmitted through the ionosphere, it is important to monitor and forecast the ionospheric variations. For example, plasma bubbles that occur in the equatorial region during night time, can cause communication blackouts in military operations (Kelly et al. 2014), or significant error in the GPS position information (DasGupta 2004). As the dependence of the modern technology on the GPS and satellite communication is growing, the necessity of the ionospheric monitoring by using both in-situ and remote sensing methods is realized more. In that respect, the plasma chamber experiment can find its role as a standard tool for inter-calibration between various plasma instruments for sounding rockets and satellites.
5 SUMMARY
In this study, the plasma source design, construction, and experimental apparatus for checking its characteristics were described with experimental results. With the use of a disk-type Langmuir probe, the stable plasma generation inside the chamber was verified and standard processes of filament coating and heating were stablished. A simplified version of the Langmuir probe for a small satellite mission was utilized for diagnosing the plasma source and the behavior of the plasma inside the chamber. The derivation of the plasma parameters from the I-V curve was established based on the basic theories on the Langmuir probe.
It was demonstrated that typical ionospheric conditions suggested in the literature can be reproduced in the plasma chamber by adjusting the electrode voltages of the backdiffusion- type plasma source. It is important to investigate how space instruments behave under various plasma conditions. Vgrid of the plasma source, which controls the thermal electron emission, is realized as a suitable parameter for manipulating the electron density while Vplate is suitable for adjusting the electron temperature. The physical reasons for the behaviors of the plasma source were investigated. The cross-section of electron impacts on gaseous molecules is thought to be responsible for the observed plasma parameter variation according to the voltage change of the plasma source electrodes.
It is expected that the space plasma chamber can be used in various sounding rocket and satellite missions in the future. In terms of space technology, the plasma chamber can be utilized in experiments on spacecraft charging and discharge, which are critical especially in the outer radiation belt where a geosynchronous orbit is passing through.