


1 INTRODUCTION
Galaxy morphology plays an important role in understanding galaxy formation and evolution, correlating with the fundamental parameters of galaxies such as color, luminosity, size, surface brightness, and star formation rate (Abraham et al. 1996; Conselice 1997; Takamiya 1999; Bershady et al. 2000; Conselice et al. 2000; Corbin et al. 2001; Conselice et al. 2003; Conselice 2003). The morphology of galaxies observed from the deep Hubble Space Telescope (HST) survey differs from that of the traditional Hubble scheme classified by local massive galaxies. High-redshift galaxies are dominated by irregular, peculiar, and merging galaxies, whereas the majority of nearby galaxies are largely in the form of elliptical and spiral galaxies (e.g., Abraham et al. 1996; Driver et al. 1998; van den Bergh et al. 2000; Lotz et al. 2004; Cassata et al. 2005; Conselice et al. 2005; Conselice et al. 2008; Cassata et al. 2010; Overzier et al. 2010; Cameron et al. 2011; Conselice et al. 2011). However, owing to the small size and low-resolution of high-redshift galaxy images, objective and quantitative methods for the morphological classification of galaxies are highly needed.
Several structural parameters for a quantitative morphological classification have now been introduced. The most straightforward nonparametric methods are the concentration (C) and asymmetry (A) indices. The C index reveals how the light distribution is centrally concentrated within a galaxy. This index is a tracer of the relative fraction of light in the bulge and disk components, which correlates with the Hubble type (Kent 1985; Abraham et al. 1994, 1996; Bershady et al. 2000; Conselice 2003). The A index quantifies the degree of asymmetric light distribution of a galaxy (Abraham et al. 1996; Conselice 2003). The A–C plane in the optical band makes it possible to divide galaxies into three broad morphological bins such as elliptical/ lenticular, spiral, and irregular or peculiar systems (Abraham et al. 1996; Conselice et al. 2000; Conselice 2003; Lotz et al. 2004). Additionally, another two nonparametric methods for quantifying galaxy morphology, the Gini (G) coefficient and M20, are also defined. The G coefficient measures the relative distribution of flux values within a galaxy's image (Abraham et al. 2003; Lotz et al. 2004, 2008), while the M20 parameter describes the second-order moment of the brightest 20 % of a galaxy's flux (Abraham et al. 2003; Lotz et al. 2004, 2008). The combination of these two quantities also allows us to divide local galaxies into early- and late-type galaxies (Lotz et al. 2004). Consequently, these C, A, G, and M20 parameters are powerful tools for studying the quantitative morphology of galaxies.
One of the major approaches to understanding the formation and evolution of galaxies is the comparison of the quantitative morphological parameters between local and high-redshift galaxies. Moreover, it has been well known that the morphology of a galaxy changes as a function of wavelength (e.g., Bohlin et al. 1991; Kuchinski et al. 2000, 2001; Marcum et al. 2001; Windhorst et al. 2002; Papovich et al. 2003; Lauger et al. 2005; Taylor-Mager et al. 2007; Conselice et al. 2008, 2011). In this respect, the ultraviolet (UV) morphology of local galaxies, which mainly traces high-surface-brightness regions populated by hot stellar components, plays a significant role in assessing the optical band morphology of high-redshift galaxies. Observations of high-redshift galaxies in the optical band are preferentially made in the rest-frame UV. For example, the near-ultraviolet (NUV) images of nearby galaxies at 2,267 Å are redshifted into the B- or V-bands at z ~ 0.9 and 1.6, respectively. Therefore, understanding the optical band morphology of galaxies at high redshifts requires UV images of local galaxies with various morphologies.
Several previous studies have carried out simulations of the optical images of high-redshift galaxies using UV images of nearby galaxies (e.g., Bohlin et al. 1991; Giavalisco et al. 1996; Gardner et al. 1997; Hibbard & Vacca 1997; Burgarella et al. 2001; Kuchinski et al. 2001; Marcum et al. 2001; Windhorst et al. 2002; Papovich et al. 2003; Lauger et al. 2005). Bohlin et al. (1991) simulated the optical contour maps observed by the Wide Field and Planetary Camera (WFPC) on HST for 0.5 < z < 2.67 using the UV sounding rocket images of local galaxies. Giavalisco et al. (1996) redshifted the Ultraviolet Imaging Telescope (UIT) far-UV (FUV) images of nearby galaxies to simulate optical images of the galaxies observed with the HST/WFPC2 at high redshift. They suggested that the simulated distant galaxies have a later-type and more irregular appearance. A detailed simulation of artificially redshifted UIT/FUV images of nearby galaxies in the HST/WFPC2 data for the Hubble Deep Field (HDF; Williams et al. 1996) was also performed by Kuchinski et al. (2001). Conselice et al. (2008) examined the quantitative morphological parameters as a function of redshift (0.4 < z < 3) using galaxies found in the Hubble Ultra Deep Field (HUDF) (see also Conselice et al. 2011 for study using WFC3 data of the UDF). They found that the change in quantitative morphological parameters between the rest-frame UV and optical images depends on both galaxy type and redshift.
Although several studies on artificially redshifted galaxies have been conducted using UV images with a range of normal Hubble types, a quantitative study of the change in apparent morphology between local and high-redshift galaxies is still necessary. The main reason behind this is that the nearby UV samples of previous studies do not statistically represent the full range of Hubble types and are furthermore weighted toward a specific morphology (e.g., Kuchinski et al. 2001). However, a space UV imaging sky survey was recently performed by the Galaxy Evolution Explorer (GALEX; Martin et al. 2005). Because of the unprecedented UV sample of nearby galaxies obtained through GALEX observations, we can further understand the morphology of nearby galaxies in the UV band in comparison with the optical counterparts at high redshift.
In this paper, we present simulated optical images of highredshift galaxies using UV images of a statistically extensive sample of galaxies at z ~ 0 in order to analyze the quantitative morphology of nearby and high-redshift galaxies. We utilize the GALEX UV sample of nearby galaxies with various morphological types, which are representative of the overall population of galaxies in the local universe. We perform very detailed simulations of artificially redshifted NUV images of local galaxies. This paper is organized as follows. In the next section, we present the nearby galaxy samples selected from GALEX UV and the Sloan Digital Sky Survey (SDSS) data. Section 3 describes the simulation procedures for artificially redshifted galaxies using the local GALEX UV sample. In Section 4, we describe the quantitative morphological parameters. In Section 5, we present the effects of spatial resolution and signal-tonoise (S/N) ratio on the morphological parameters. The morphological properties of nearby galaxies in the UV-band and morphological K-correction are also discussed in this section. The summary and conclusions are presented in Section 6.
2 GALAXY SAMPLES AND ANALYSIS
UV observations of nearby galaxies were conducted by the GALEX satellite (Martin et al. 2005). GALEX obtained deep images in the FUV (λeff = 1,516 Å) and NUV (λeff = 2,267 Å) bands with a very wide 1.2° circular field of view on the sky. The image resolution (FWHM) is typically 4.5 arcsec in the FUV and 6.0 arcsec in the NUV with a pixel scale of 1.5 arcsec pixel–1. The characteristics of the GALEX NUV filters are summarized in Table 1. A more detailed description of the GALEX instrument and calibration can be found in Martin et al. (2005) and Morrissey et al. (2005, 2007).
We selected nearby galaxies from the GALEX UV Atlas of Nearby Galaxies (Gil de Paz et al. 2007, hereafter GALEX UV Atlas). The GALEX UV Atlas includes a total sample of 845 galaxies in the GALEX Nearby Galaxies Survey mode (Gil de Paz et al. 2007) as well as in other GALEX imaging survey modes such as the All-sky Imaging Survey, Medium Imaging Survey, Deep Imaging Survey, and Ultra-Deep Imaging Survey. The galaxies in the GALEX UV Atlas have optical diameters larger than 1 arcmin at the μB = 25 mag arcsec–2 isophote according to the Third Reference Catalog of Bright Galaxies (de Vaucouleurs et al. 1991, hereafter RC3). A more detailed description of our UV nearby galaxies can be found in Gil de Paz et al. (2007).
The morphological type of about 10 % of our sample galaxies is not available in RC3. The relative fractions of the morphological type of our sample galaxies are 23, 59, and 8 % for elliptical/ lenticular, spiral, and irregular galaxies, respectively. These galaxies cover the full range of physical properties and morphologies of the galaxies in the local universe (see Figs. 1 and 2, and Table 1 of Gil de Paz et al. 2007 for the global parameters of the sample galaxies).
Point sources, which are returned from the GALEX pipeline, with FUV–NUV > 1 were defined as foreground stars and masked in the NUV image of each galaxy (Gil de Paz et al. 2007). Then, the masked image was visually inspected and additional foreground stars were manually added in order to construct the final masked image. We subtracted the sky background from the NUV image, adopting the sky background of each galaxy from Table 2 of Gil de Paz et al. (2007).
In order to investigate the bandshift effect of galaxies with various morphological types (see Section 5.3.2), we also utilized the r-band optical images from SDSS Data Release 7 (York et al. 2000) cross-matched with our UV sample. The median value of the point spread function (PSF) of the SDSS r-band image is 1.4 arcsec and the pixel scale is 0.4 arcsec pixel–1. We first created an SDSS r-band postage-stamp image of each galaxy. Photometry of the SDSS image was performed using the Source Extractor (SExtractor, Bertin & Arnouts 1996). We removed the sky background in the image using the background map created by SExtractor. By using the stellarity index (CLASS_STAR) returned from SExtractor, we defined objects with CLASS_STAR > 0.8 as foreground stars and then masked these in the image. The remaining foreground sources embedded within the light of the target galaxy were selected by visual inspection and removed in the image using the IMEDIT task of IRAF.
Only foreground Galactic extinction correction for the GALEX NUV and SDSS r-band images was applied. The conversion factors of the Galactic extinction were derived based on the Galactic reddening values, E(B–V), of the galaxies from Schlegel et al. (1998) and the reddening law of Cardelli et al. (1989); ANUV = 8.0 × E(B–V) and Ar = 2.8 × E(B–V).
3 SIMULATED IMAGES OF HIGH-REDSHIFT GALAXIES
Using the approach of Giavalisco et al. (1996), we artificially redshifted the GALEX UV images to higher values of z, which allows us to simulate the appearance of galaxies at a more distant reference frame. The rest-frame NUV wavelength (~2,267 Å) is redshifted into four optical/near-infrared (IR) wavelengths of the HST ACS filters (see Table 2); i.e., F435W filter (~4,317 Å) at z ~ 0.9, F606W filter (~5,918 Å) at z ~ 1.6, F775W filter (~7,693 Å) at z ~ 2.4, and F850LP filter (~9,055 Å) at z ~ 3.0. We adopted a cosmology with ΩM = 0.3, ΩΛ = 0.7, ΩK = 0.0, and H0 = 70 km s−1 Mpc−1. No evolutionary effects of stellar population were considered.
To transform the GALEX NUV image at z = 0 into a HUDF HST ACS image at high-z, we considered the rebinning factor and surface brightness scaling (Giavalisco et al. 1996; Burgarella et al. 2001; Kuchinski et al. 2001; Conselice 2003; Papovich et al. 2003). The rebinning factor is the reduction of the apparent size of a galaxy’s image at high redshift in a given detector. The angular size (θ0) of a galaxy placed at a real distance (D) with a physical size d at z = 0 is given by θ0 = d/D. At a given high redshift z, the angular size of this galaxy, θz, can be defined as follows:(1)
where DA is the angular diameter distance. Finally, the z can be calculated from the following equation (Hogg 1999):(2)
If we observe the galazy at z = 0, the total number of pixels in the galaxy by n0 = 0/S0, where s0 is the pixel size at z = 0 taken from the GALEX NUV image (1.5 acres pixel-1). The same galaxy observed at redshift z is determined by nz = θz/ sz pixels, where sz is the pixel size of the detector for a galaxy image at z adopted from the HST ACS/WFC (0.05 arcsec pixel–1). Therefore, the rebinning factor, b, can be computed from the ratio of the size of the galaxy in pixel units with the following formula (Giavalisco et al. 1996; Conselice 2003; Papovich et al. 2003):(3)
We performed the rebinning of the GALEX NUV images of galaxies using the IDL frebin function.
The surface brightness scaling is the effect of the surface brightness reduced in the observed galaxy due to cosmological expansion. Based on the assumption that the galaxy luminosity integrated over the surface area is preserved, the specific flux of the galaxy at z can be expressed as(4)
where Fλ(0) is the specific luminosity of the galaxy at z = 0 and rz is the luminosity distance at z defined as follows (weinberg 1972; Weedman 1986; Hogg 1999):(5)
Finally, we corrected the specific flux of the galaxy due to the cosmological effect using rthe following equation:(6)
We generated simulated images at high-z using the Monte Carlo method considering the sky background, dark noise, and readout noise in the HST ACS Instrument Handbook v6.0. We adpoted the exposure times used for the HUDF observations (beckwith et al. 2006; see also table 2). We added the appropriate extinction for each filter of the HST ACS to the simulated image. The conversion factors of the Galactic extinction were derived based on the Galactic reddening values, E(B–V), of the galaxies from Schlegel et al. (1998) and the reddening law of Cardelli et al. (1989): AF435W = 4.2 × E(B− V), AF606W = 2.9 × E(B−V), AF775W = 2.0 × E(B−V), and AF850LP = 1.5 × E(B−V). Finally, we convolved the simulated image with the HST PSF generated by Tiny Tim (Krist & Hook 2004).
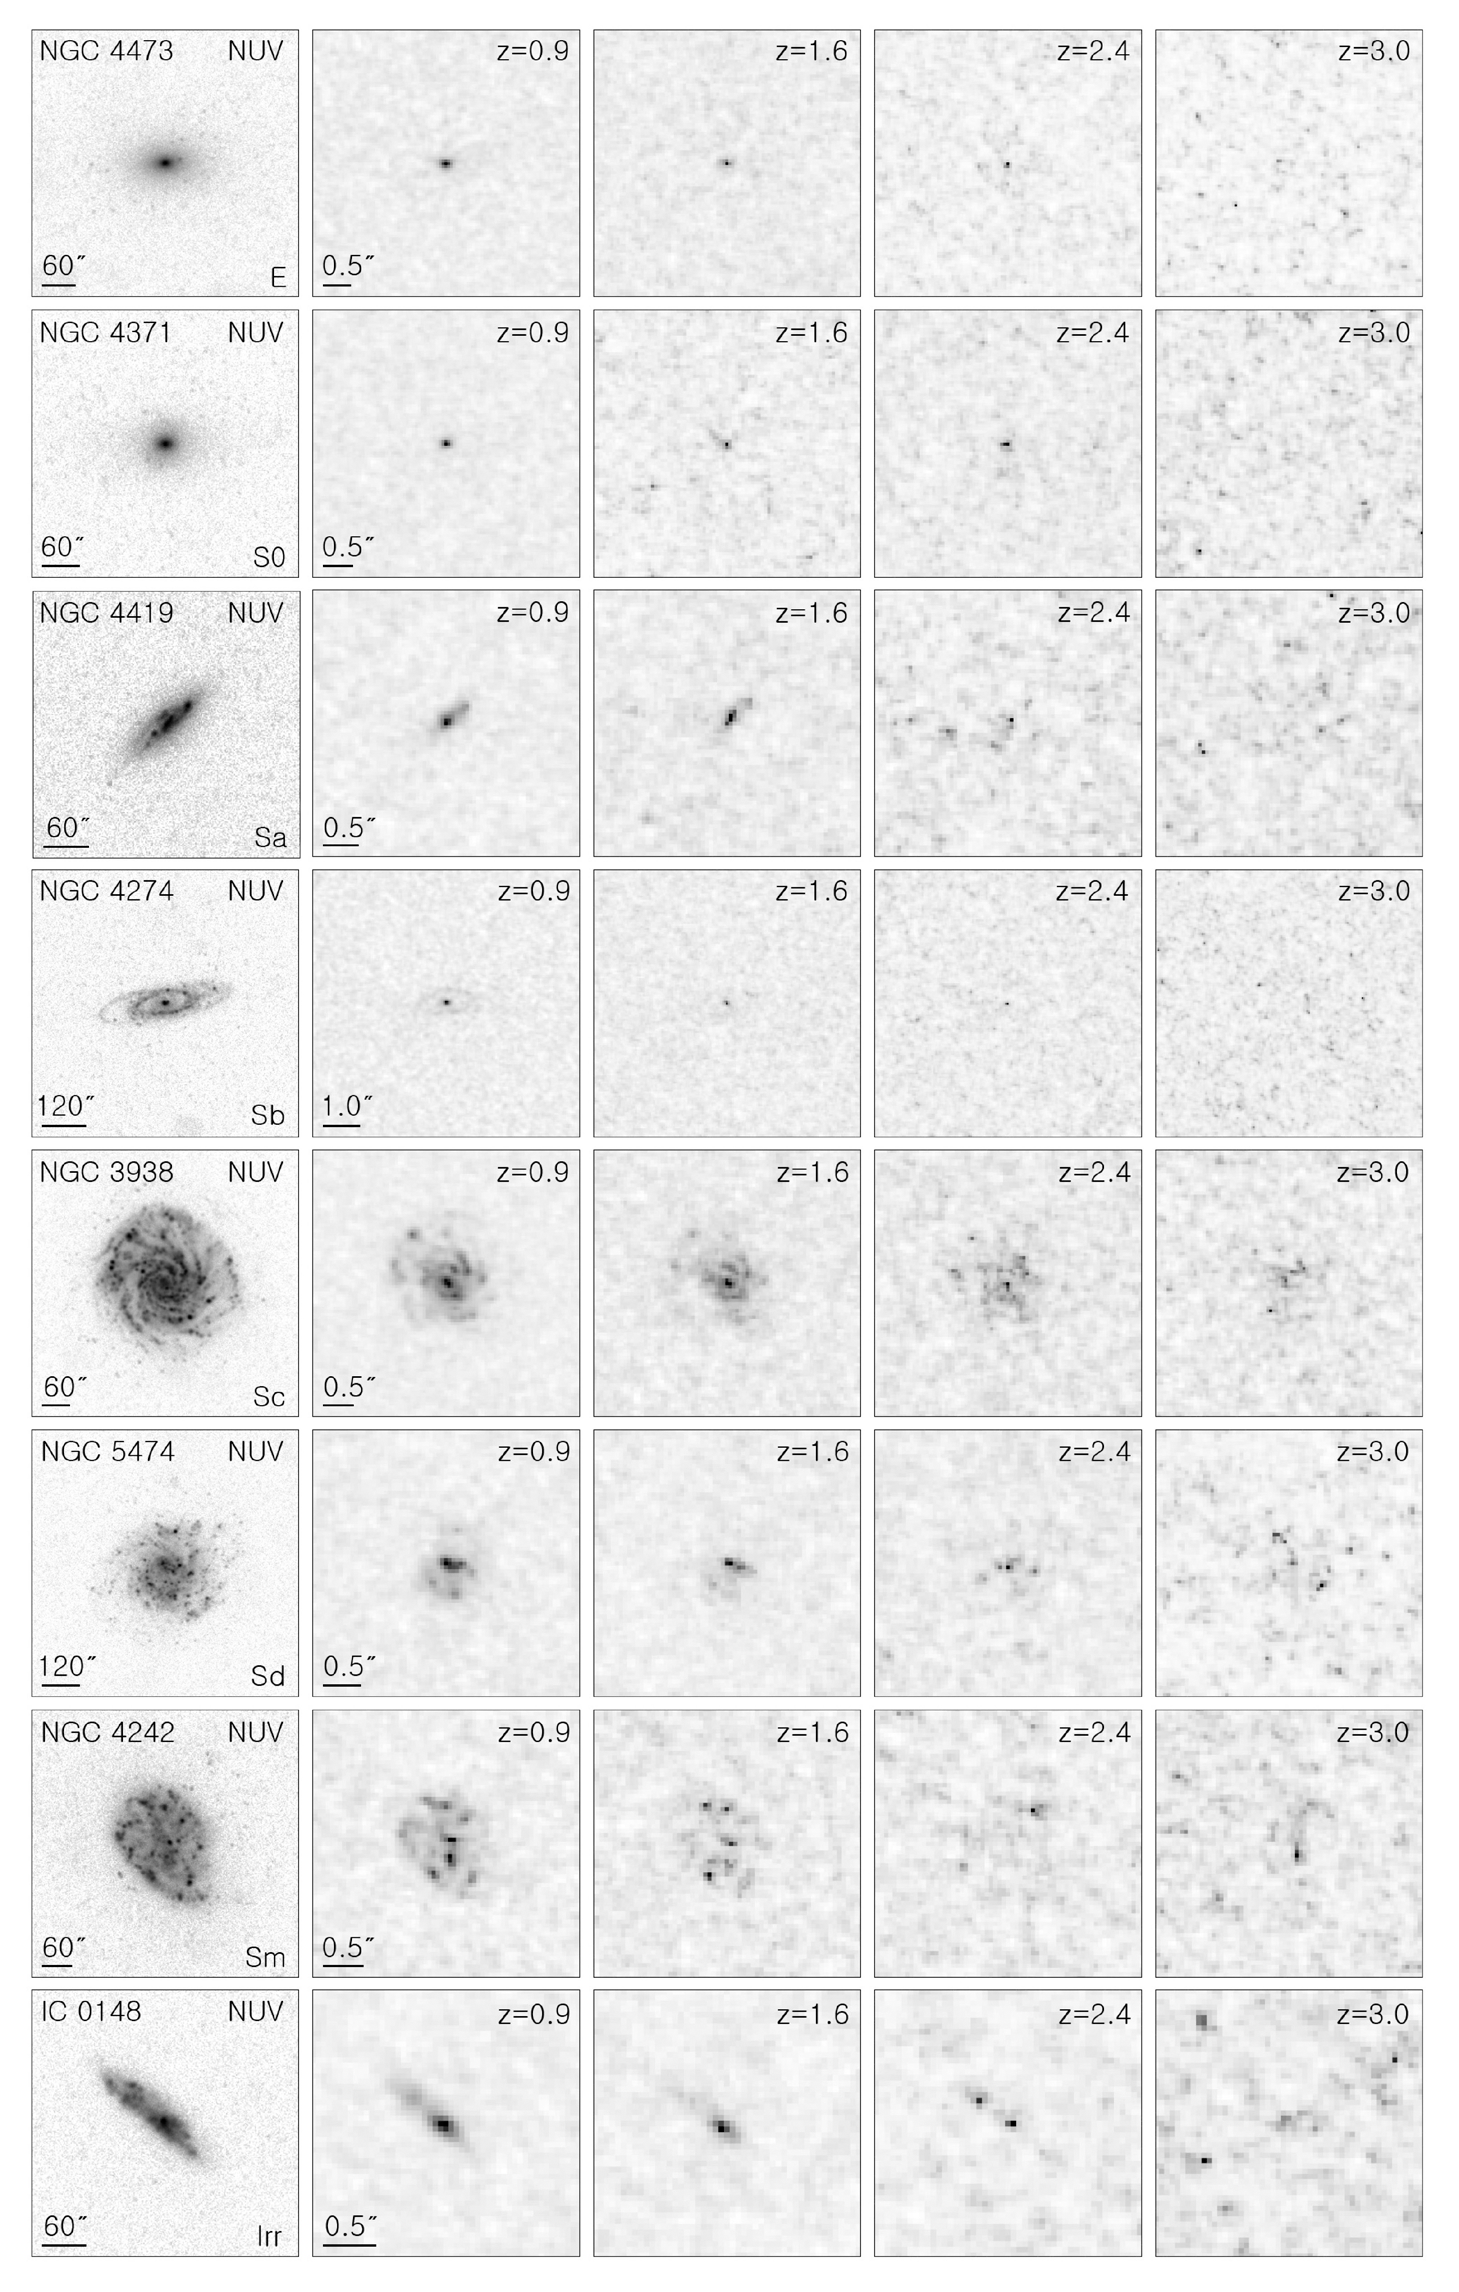
Fig. 1 shows examples of the GALEX NUV and artificially redshifted images of galaxies with various morphologies, in which the changes in galaxy appearances as a function of redshift can be seen. Many of the morphological features are still clearly observed in the simulated images at low redshifts (e.g., z = 0.9) as the cosmological effects are practically negligible at this redshift. At high redshifts (e.g., z > 2.4), the simulated spiral galaxies can be mistakenly classified as early-type galaxies (E or S0 galaxies) or irregular galaxies because only the bulge or bright star-forming regions in the spiral arms are visible. Most early-type galaxies at z > 2.4 are either undetectable or shrunk to the appearance of point sources.
4 MORPHOLOGICAL PARAMETERS
We use the C, A, G, and M20 parameters to quantify the morphology of galaxies at local and high redshifts. These nonparametric methods for measuring the morphology of galaxies do not assume a particular analytic function for a galaxy’s brightness distribution. Therefore, it is possible to apply these parameters to the irregular appearances seen in the most distant galaxies as well as normal Hubble-type galaxies.
We computed the ellipse of each galaxy whose semi-major axis is equal to the Petrosian radius. The Petrosian index (Petrosian 1976), η(r), is defined as the ratio between the local surface brightness at a given galaxy’s projected radius (r) and the mean surface brightness within r. We define the Petrosian radius (rP) as the semi-major axis where η(rP) is equal to 0.2; i.e., the radius where the surface brightness is 20 % of the mean surface brightness within that radius. The total flux of a galaxy for the calculation of the C, A, and M20 parameters is defined as the flux contained within 1.5 times the Petrosian radius, whereas the flux within the Petrosian radius is used for the calculation of the G coefficient (see Section 4.3 for details). The center of a galaxy is determined by minimizing the asymmetry index (see Section 4.2). Starting from the central position quoted in the SExtractor photometry, we computed the asymmetry over a grid of (x, y) positions and iterated the process by re-centering the galaxy until a minimum value of asymmetry was found.
The concentration index, C, is a measure of the light distribution within the central region of a galaxy in comparison to that in its outer region. We computed the C index defined as the ratio of the circular radii containing 80 % and 20 % of the total galaxy flux (Kent 1985; Bershady et al. 2000):(7)
where r80 and r20 are the circular apertures containing 80 % and 20 % of the total galaxy flux, respectively. A higher C value indicates that a large amount of light is distributed within the central region of a galaxy.
The asymmetry index, A, of a galaxy is computed by subtracting the galaxy image rotated by 180° from the original image (Abraham et al. 1996; Conselice 1997; Conselice et al. 2000; Conselice 2003; Conselice et al. 2008). The A index can be given by
where I0 is the intensity distribution in the original image and I180 is that in the image rotated by 180° about the central pixel of the galaxy (Conselice et al. 2008). B0 and B180 are the intensity of a given pixel and that of its rotationally symmetric counterpart in the blank sky area around the galaxy, respectively. The second term of the Eq. (8) is for the correction of noise from an empty sky background. A lower value of A indicates that the light distribution of a galaxy exhibits a higher degree of rotational symmetry (Conselice et al. 2008).
The Gini coefficient, G, is a statistical parameter that is defined by the Lorenz curve of the light distribution in a galaxy (Abraham et al. 2003). We adopt the prescriptions given by Lotz et al. (2004) for the calculation of G:(9)
where n is the total number of pixels, |F| is the mean absolute pixel intensity, and Fi is the rank-ordered pixel intensity. A higher G value indicates an unequal distribution, while a lower value corresponds to a more even distribution. If one pixel contains all the light, G is unity, whereas if the light of all the pixels is equal, G is 0.
G is not related to the spatial distribution of light within a galaxy, as this index represents the relative contribution of pixels with different intensities to the total flux (Abraham et al. 2003; Muñoz-Mateos et al. 2009). Therefore, G is not affected by the position of the precise center of the galaxy. However, G depends strongly on the aperture containing the light of a galaxy (e.g., Lisker 2008). G will tend to increase if a large aperture includes many sky pixels, whereas a small aperture only containing bright pixels will decrease the value (Lotz et 2004). As G is strongly by the S/N when using the aperture of 1.5 times the Petrosian radius, we used the Petrosian radius for the calculation of G (see Lisker 2008 for details).
We define M20 as the normalized second-order moment of the brightest 20 % of a galaxy’s flux given by Lotz et al. (2004):(10)
where ftot is the total flux of pixels within a galaxy and fi is the flux for each pixel i. The total second order moment, Mtot, is defined as follows (Lotz et al. 2004):(11)
where (xi, yi) is the coordinate of the pixel and (xc, yc) is the center of the galaxy. The second-order moment (Mi) is the flux in each pixel multiplied by the squared distance to the center of the galaxy. The M20 parameter is similar to the behavior of C in the sense that a lower value of M20 indicates that a large fraction of light is concentrated within the central region of a galaxy.
5 RESULTS
The measurement of the morphological parameters generally depends on the spatial resolution and S/N of the image (e.g., Conselice et al. 2000, 2003). In the case of a galaxy image with poor resolution and low S/N, the core and star-forming regions of the observed galaxy become unresolved. These effects are important when comparing nearby galaxies to distant galaxies because the observations of high-redshift galaxies are mainly of a lower resolution and S/N than those of nearby galaxies.
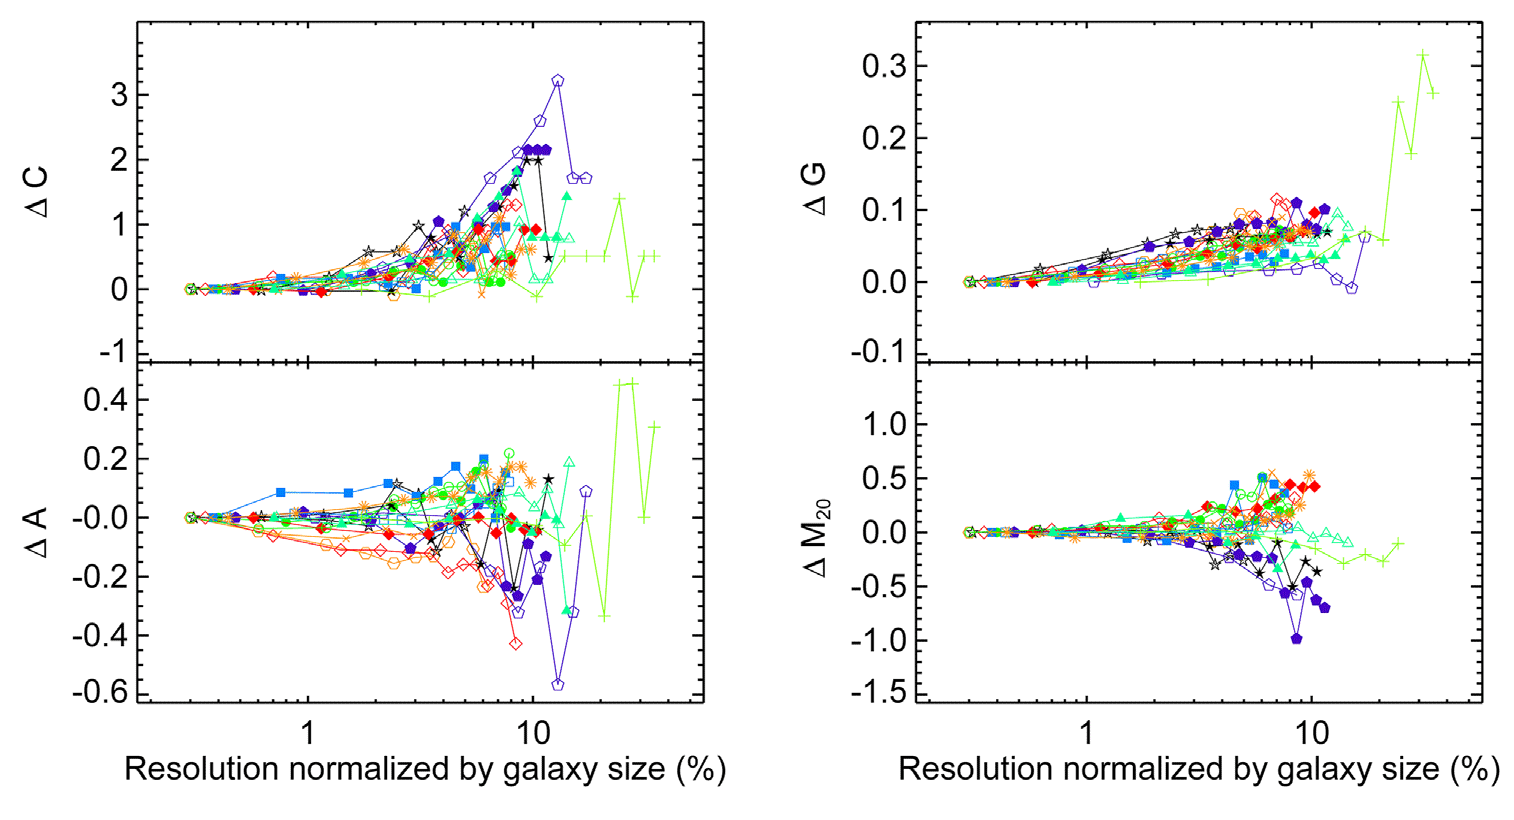
Previous studies using optical images have demonstrated that a spatial resolution of about 1 kpc pixel–1 is at the limit beyond which poorer resolutions will affect the measurement of the C, A, G, and M20 parameters (Conselice et al. 2000; Conselice 2003; Lotz et al. 2004). We investigate the effect of the spatial resolution on our UV data and determine the limit that is appropriate for our analysis. We selected 16 galaxies with varying morphological types to test the effect of decreasing physical resolution on the measurement of morphological parameters adopting the approach of Lotz et al. (2004). We rebinned the galaxy images to degrade the physical resolution. The S/N per pixel of the original image was adopted for the rebinned image in order to consider only the resolution effect. Finally, we defined the Petrosian radius and estimated the change in morphological parameters for the simulated images at different resolution levels. Fig. 2 shows the change in morphological parameters between the original and simulated images at different resolution levels against the resolution normalized by the galaxy size. It is evident that the decreasing resolution affects the measurement of morphological parameters; all morphological parameters measured from the images with poor resolution systematically exhibit large offsets in comparison with those from the original images. We selected the sample galaxies with good resolution; i.e., the resolution normalized by the galaxy size less than 5 %. We found that all morphological parameters are reliable to within approximately 15 % for galaxy images with resolutions down to this value.
The S/N of the galaxy image can also bias the derived values of the morphological parameters (Conselice et al. 2000; Lotz et al. 2004; Lauger et al. 2005). Lotz et al. (2004) explored the effect of the S/N per pixel on the measurement of the C, A, G, and M20 parameters. They found that the morphological parameters can be computed most reliably within about 10 % when the mean S/N per pixel is greater than 2. For the selection of sample galaxies with good S/N, we adopted the criterion of the mean S/N per pixel given by Lotz et al. (2004) as the S/N generally does not depend strongly on wavelength (see Lotz et al. 2004 for details).
In Fig. 3, we present the distribution of the C, A, G, and M20 parameters of nearby galaxies in the NUV as a function of the various physical parameters of galaxies. There are 257 galaxies represented as data points in all panels but the NUV-r color plot, where there are 153 galaxies. In all panels, different morphological types from the RC3 catalog are coded with different symbols. The numerical index of morphological type from RC3 is divided into different morphological classifications: elliptical (–6 < T < –3), lenticular (–3 ≤ T < 0), Sa (0 ≤ T < 2), Sb (2 ≤ T < 4), Sc (4 ≤ T < 6), Sd (6 ≤ T < 8), Sm (8 ≤ T < 9.5), and Irr (9.5 ≤ T).
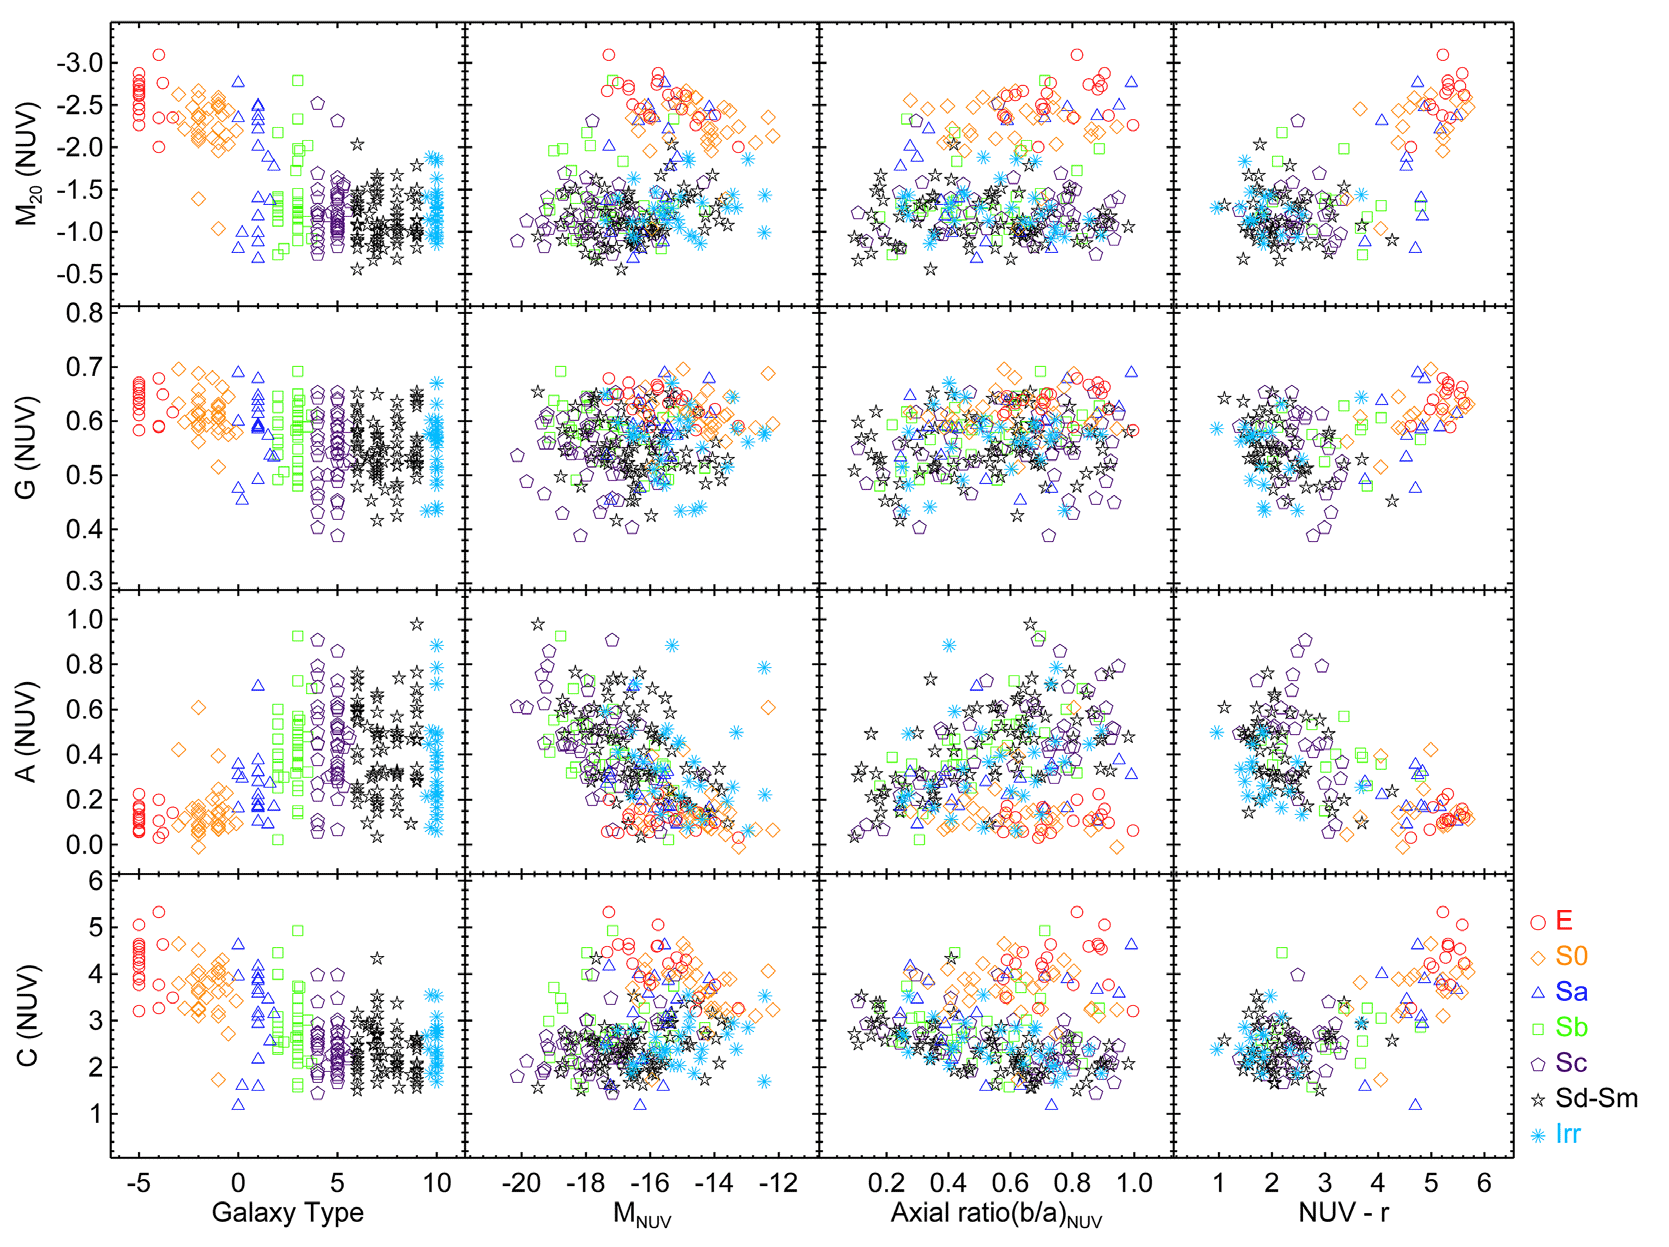
In Fig. 3, it is evident that there is a correlation between galaxy morphological type and the morphological parameters measured in the NUV images, which show a similar trend observed in the optical-band images (Conselice 1997; Taylor- Mager et al. 2007). This indicates that the morphological parameters measured in the UV images are also an effective tool to discriminate galaxies with different morphologies. Early-type galaxies (E and S0) are separated from galaxies with late-type morphologies (S and Irr) in all parameters. In addition, early-type galaxies are more concentrated (i.e., higher C and G and lower M20) and symmetric (i.e., lower A) than late-type galaxies. However, no strong correlations can be found in the planes of absolute NUV magnitude (and axial ratio) versus morphological parameters. In contrast, note that all morphological parameters exhibit a correlation with the NUV-r color. The color of the galaxy traces the global stellar population of galaxies with different morphologies in the sense that early-type galaxies, mostly consisting of old stellar populations, have systematically redder NUV-r colors.
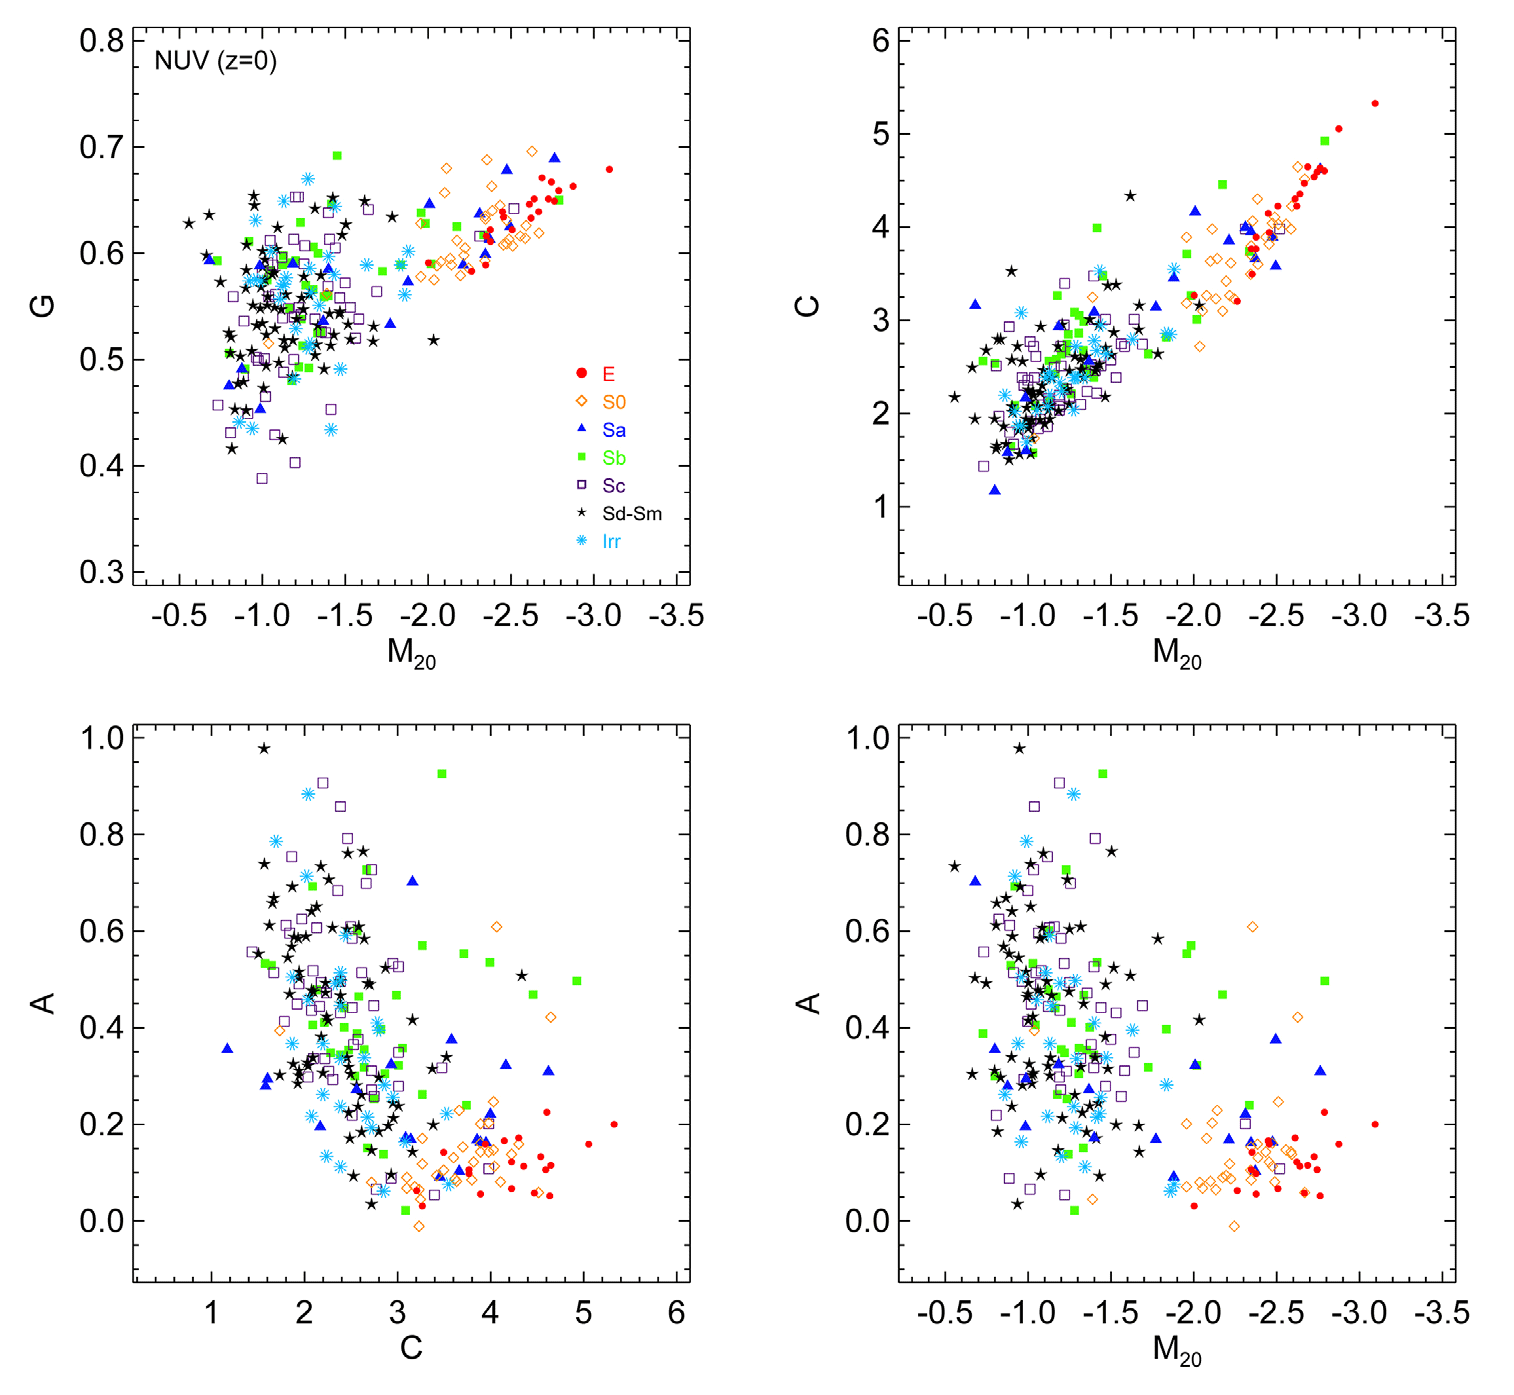
We further examined the structural properties of nearby galaxies in the NUV by using a combination of morphological parameters. Fig. 4 presents the distribution of galaxies in the G–M20, C–M20, A–C, and A–M20 planes, where galaxies with different morphologies are denoted by different symbols. The distinct feature is that these plots can be better used to separate early-type from late-type galaxies. However, it is ambiguous to distinguish galaxies with different morphologies (from Sa to Irr) among late-type galaxies. In the A–C and A– M20 planes, the morphologies of early-type galaxies are very symmetry (i.e., small A values) and well separated from latetype galaxies. The wide spread of the A index of late-type galaxies mainly stems from the fact that the distribution of star-forming regions within the UV images is patchier across the disk and spiral arm. A further striking feature is that the G–M20 and C–M20 plots show moderately strong correlations, while some scatters toward high G values at a given M20 is shown for late-type galaxies. These are natural consequences of the fact that the G and M20 values are remarkably similar to the behavior of C by definition. The low M20 values are indicative of a high concentration of light distribution and the high G values indicate that most of the flux of the galaxy is contained in only a few pixels, which is comparable to the case for high C values. The spread of the G coefficient at a given M20 of late-type galaxies in the G–M20 plot is mostly due to the fact that, in many cases, the UV morphology of latetype galaxies can be influenced by the degree of concentration of UV light within star-forming regions. In this respect, the G coefficients of a large fraction of late-type galaxies in the NUV present higher values than the case of the optical and near-IR images (e.g., Muñoz -Mateos et al. 2009).
If the morphological parameters are significantly affected by the morphological K-correction (i.e., cosmological distance effect and bandshift effect), the morphological parameters for nearby galaxies and high-redshift galaxies may not be directly compared (Taylor-Mager et al. 2007). By simulating the UIT FUV images of 32 local galaxies into the HST/WFPC2 images of high z galaxies in the HDF, Kuchinski et al. (2001) suggested that the morphological K-correction is strongly affected by the bandshift effect, whereas the cosmological distance effect gives rise to only small, random changes in the C and A indices. However, their sample was weighted toward spiral and irregular galaxies, not statistically representing the overall distribution of Hubbletypes. In this study, we revisit the morphological K-correction using our sample galaxies covering the full range of galaxy morphology in the local universe.
The appearance of artificially redshifted galaxies can change significantly because of the dimming of low-surface-brightness components and the loss of resolution. We examined this socalled cosmological distance effect using GALEX NUV images of galaxies with various morphologies and their artificially redshifted images. Fig. 5 presents the distribution of galaxies in the A–C and G–M20 planes at z = 0 and higher redshifts (i.e., z = 0.9 and 1.6) in the rest-frame NUV, illustrating how the morphological parameters of galaxies vary with redshift. In Fig. 6, we also present histograms of the change (Δ) in C, A, G, and M20 between the NUV image at z ~ 0 and artificially redshifted images at z = 0.9 and 1.6 for various morphological types.
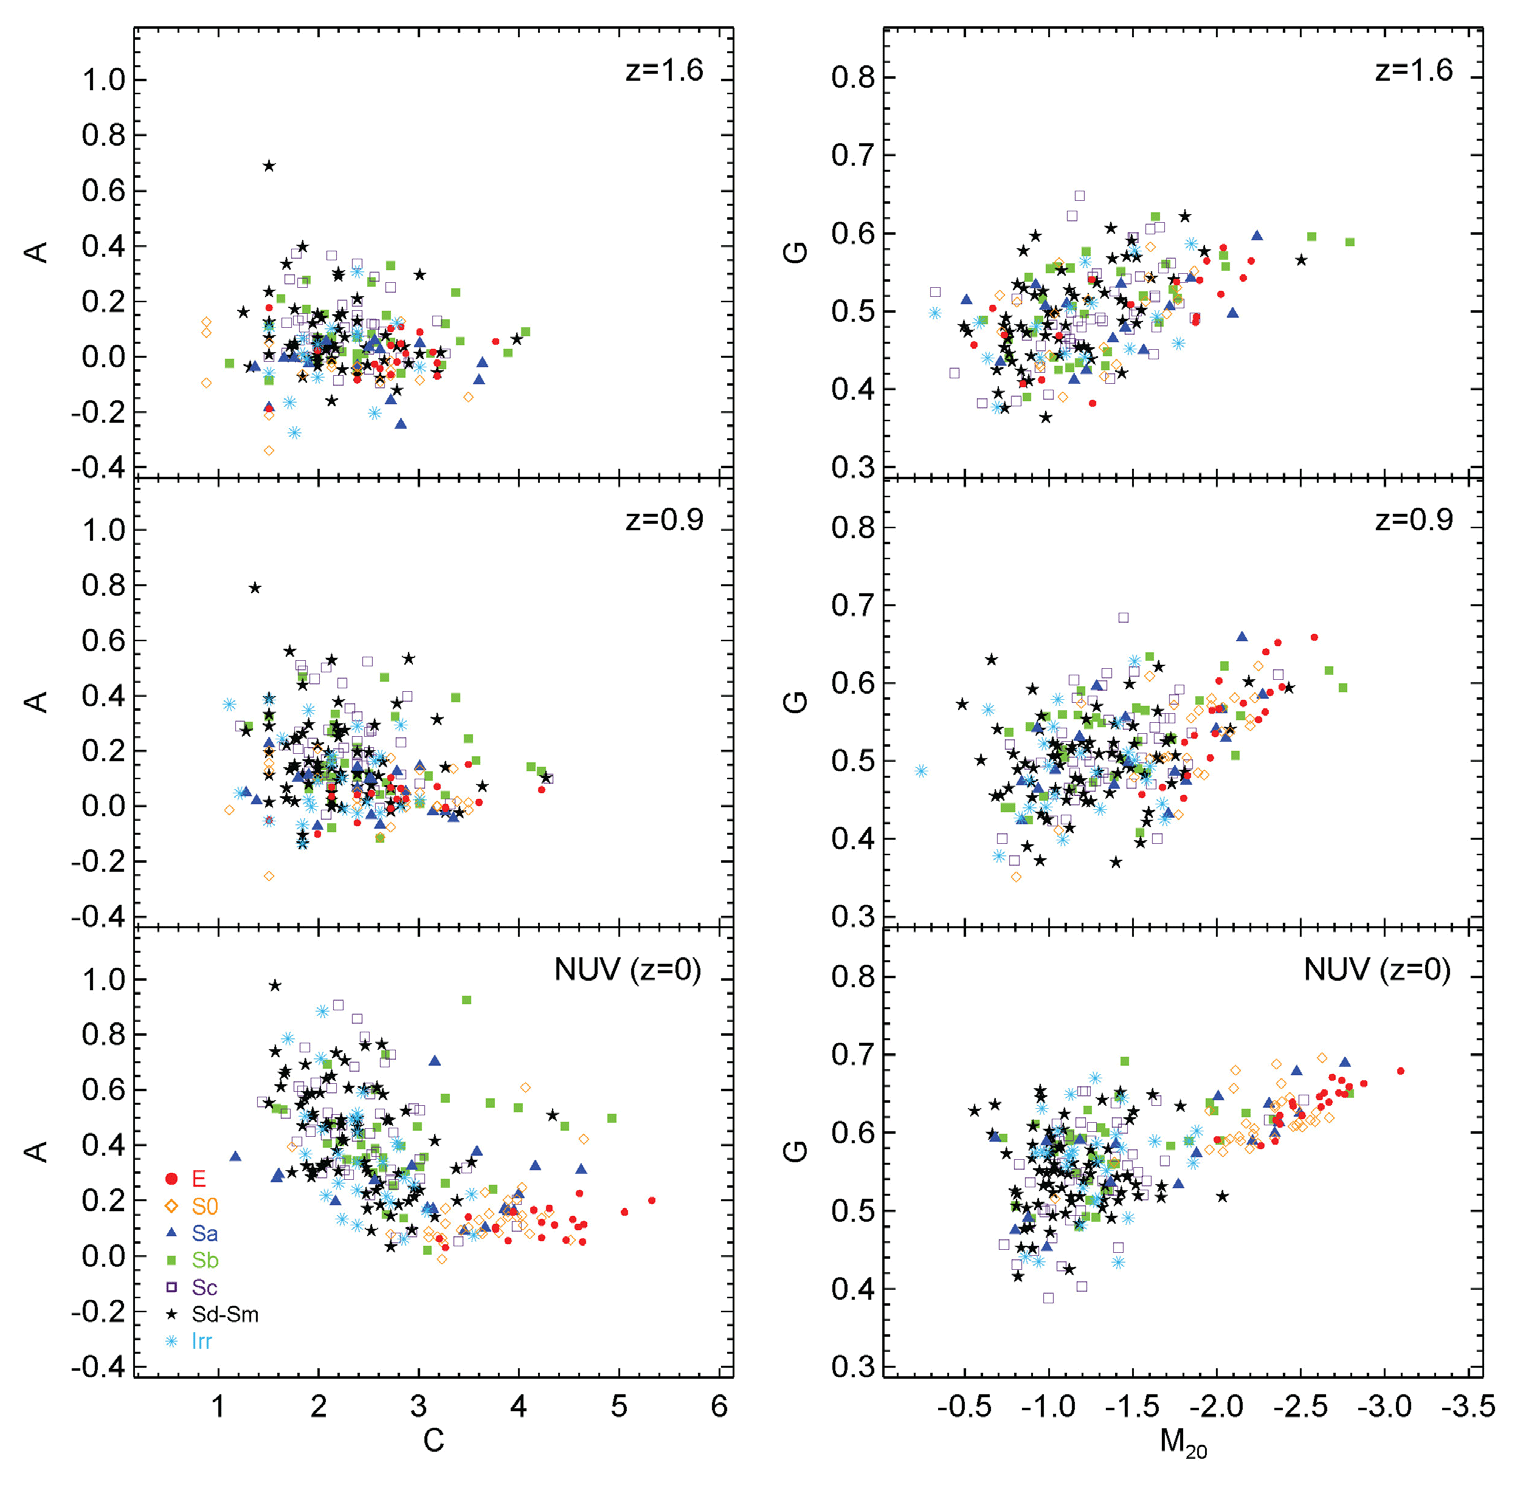
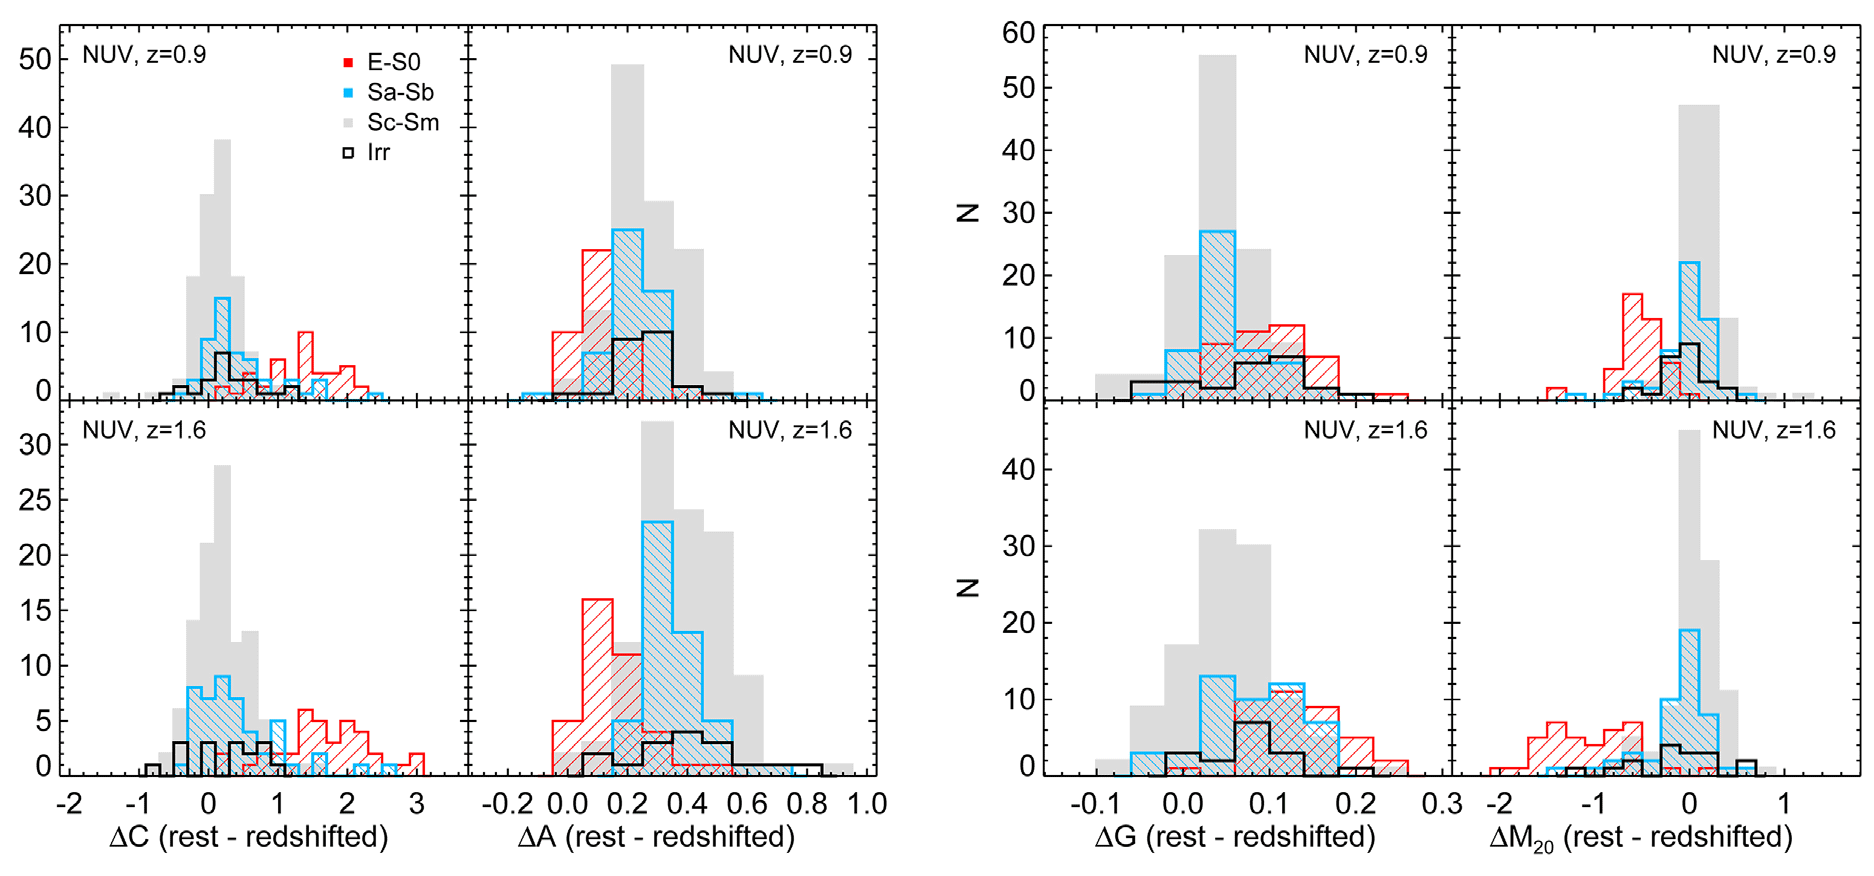
The early- and late-type galaxies are well divided in the plane of A–C at z = 0, but it is almost impossible to discriminate galaxies of these two different morphological types at high redshifts (see left panels of Fig. 5). While the majority of latetype galaxies at z = 0 exhibit a wide spread of the A index, the counterparts at high redshifts are biased to relatively low values comparable to those of early-type galaxies. The decrease in the A index of late-type galaxies with redshift occurs because the star-forming regions are less patchy in the redshifted images, which makes the galaxy more symmetrical. However, the C index distribution of late-type galaxies does not exhibit major changes with the increase in redshift. The median values of ΔA and ΔC in the late-type galaxies are about 0.26 and 0.25 for z = 0.9, and about 0.32 and 0.22 for z = 1.6, respectively. In contrast, in the case of early-type galaxies, the C index significantly decreases from local to high redshifts (i.e., median values of ΔC ~ 1.38 and 1.72 for z = 0.9 and 1.6, respectively) as the outer radii (r80) of galaxies containing 80 % of the total galaxy flux are systematically underestimated at high redshifts owing to the surface brightness dimming of the outer parts of the galaxies. However, the A index of early-type galaxies does not change significantly as a function of redshift (i.e., median values of ΔA ~ 0.11 and 0.12 for z = 0.9 and 1.6, respectively). Therefore, the early-type galaxies at high redshifts overlap with the late-type galaxies in the A–C plane.
In the G–M20 plane (see right panels of Fig. 5), the distribution of early-type galaxies significantly varies as a function of redshift, exhibiting systematically lower G and higher M20 values at high redshifts compared to the counterparts at z = 0. The appearances of early-type galaxies at high z are more uniform because of the fading of the outer parts with low surface brightness, leading to their smaller G and higher M20 values. The median values of ΔG and ΔM20 in early-type galaxies are about 0.09 and –0.8 for z = 0.9, and about 0.13 and –1.21 for z = 1.6, respectively. However, the distribution of late-type galaxies in the plot of G–M20 does not show a strong dependence of redshift in the sense that late-type galaxies exhibit only very small changes in G and M20 against the redshift. The median values of ΔG and ΔM20 in late-type galaxies are about 0.06 and –0.02 for z = 0.9, and about 0.07 and –0.06 for z = 1.6, respectively. Consequently, we suggest that the cosmological distance effect is significant for the quantitative morphological parameters (e.g., C, G, and M20) of early-type galaxies.
We investigated the bandshift effect that is the difference between the values of the morphological parameters in the restframe UV and optical images. Fig. 7 presents the distribution of galaxies with different morphologies in the A–C and G–M20 planes based on the morphological parameters measured in the GALEX NUV and SDSS r-band images at z = 0. In Fig. 8, we also present histograms of the change (Δ) in C, A, G, and M20 parameters between the optical and NUV images at z = 0.
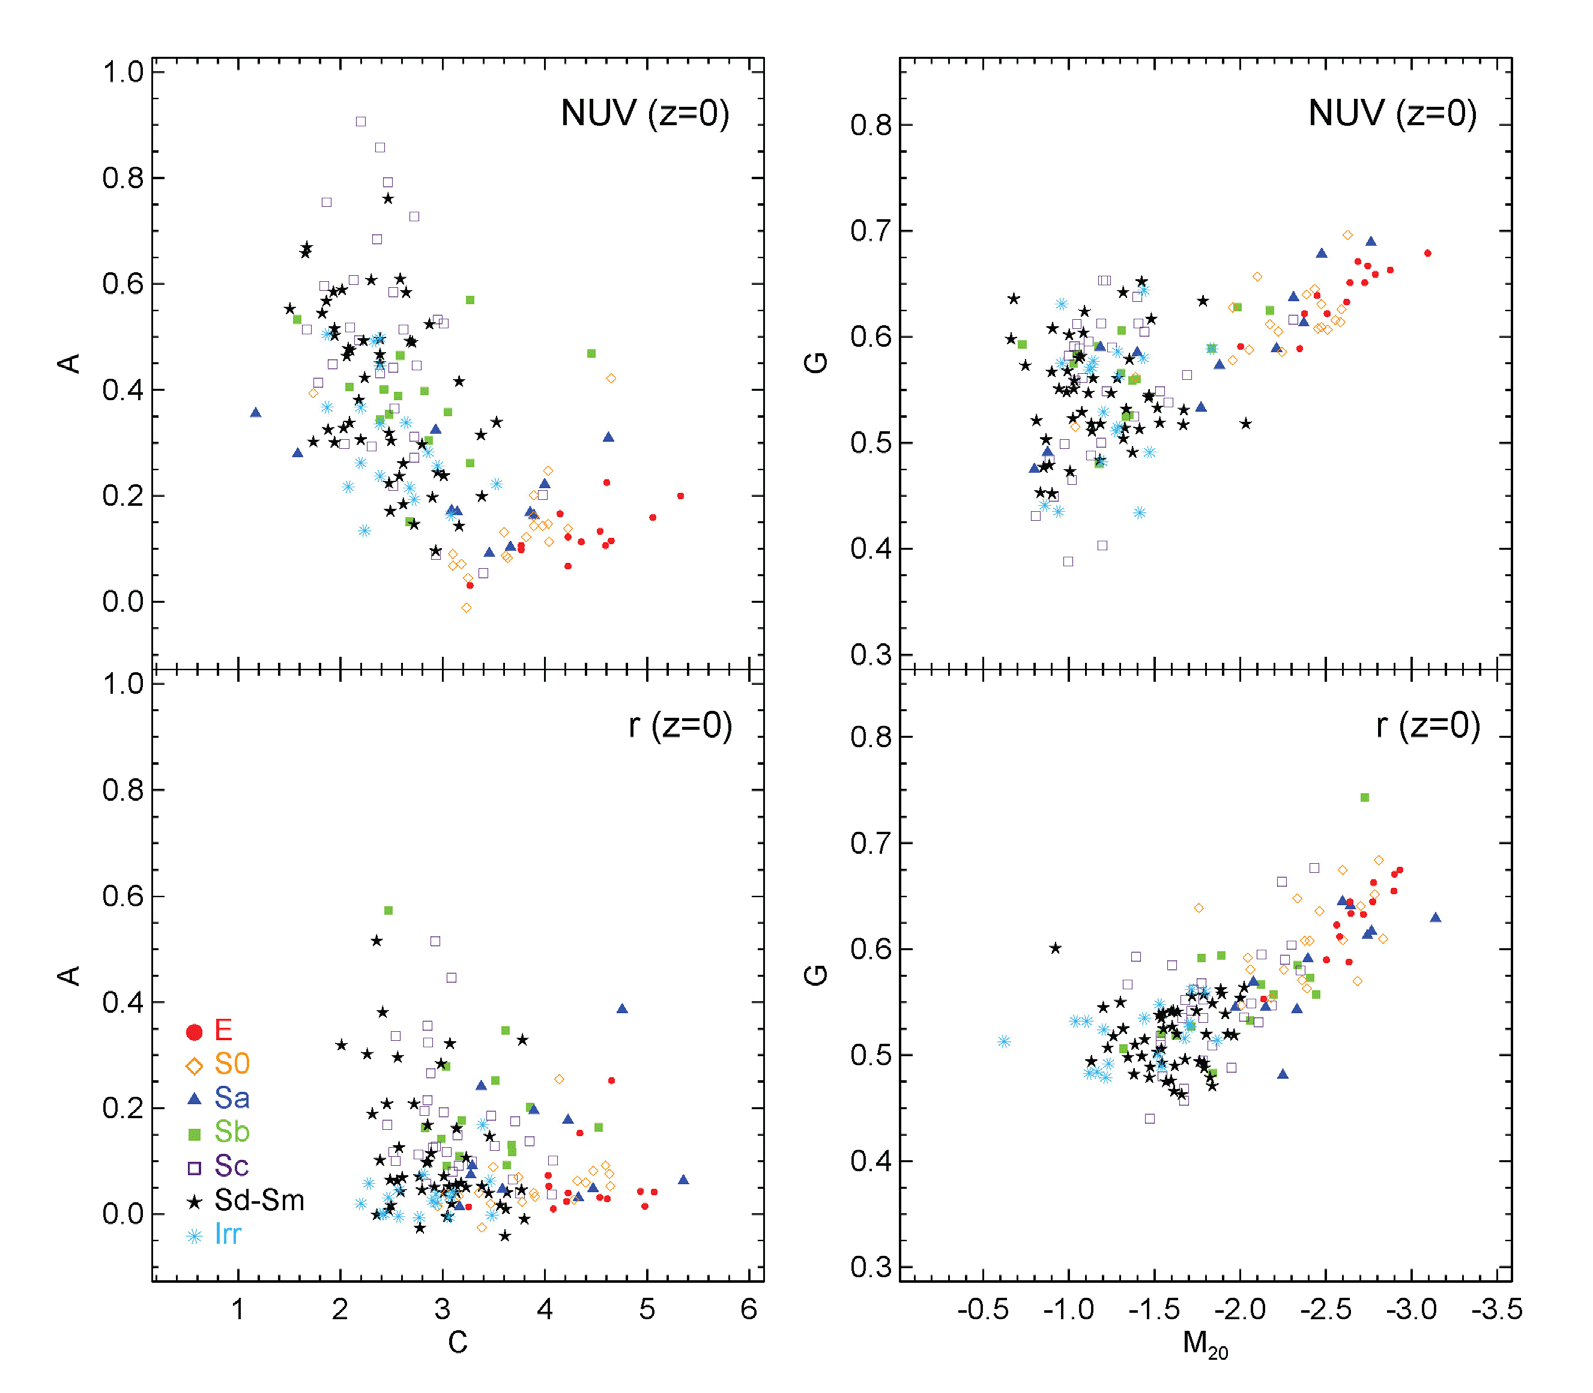
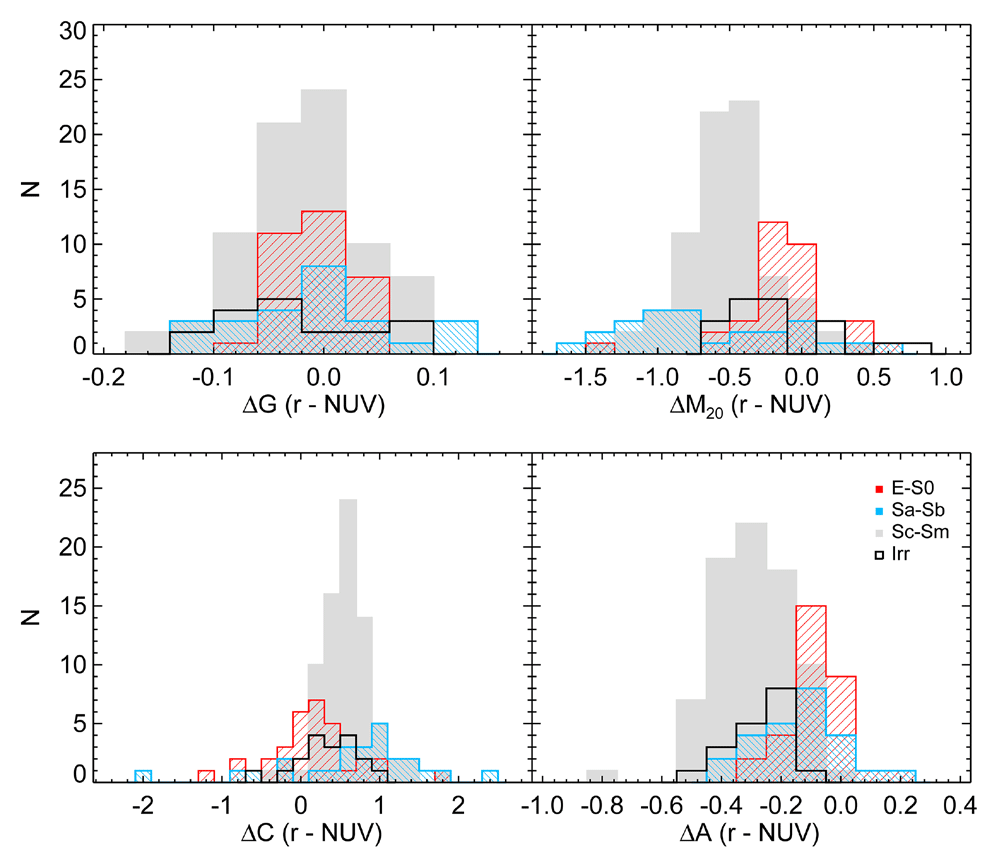
In Fig. 7, early-type galaxies exhibit a somewhat similar distribution in both the NUV and optical r-band, in which the A, C, G, and M20 parameters do not exhibit large differences between the NUV and optical r-band. The medians of the difference between the morphological parameter values of early-type galaxies in the optical r-band and NUV are approximately –0.07, 0.19, –0.01, and ~0.08 for ΔA, ΔC, ΔG, and ΔM20, respectively (see Fig. 8). However, in Fig. 7, the distribution of late-type galaxies in the NUV shows a large difference compared to that of the optical band. The median values of ΔA, ΔC, ΔG, and ΔM20 of late-type galaxies are approximately –0.22, 0.55, –0.02, and –0.41, respectively (see Fig. 8). The UV emission in late-type galaxies primarily emerges from star-forming regions, which are widely distributed across the disk, spiral arm, and outer parts of the galaxies. This is responsible for the low concentration (i.e., low C and high M20) and large asymmetry (i.e., high A) of latetype galaxies in the NUV images. Note again that, contrary to other morphological parameters, the G coefficient is not related to the spatial distribution of UV flux from star-forming regions within a galaxy, which is responsible for the spread to high G values of late-type galaxies at a given M20 (see upper right panel and Section 5.2). Consequently, we suggest that late-type galaxies are more greatly affected by the bandshift effect compared to early-type galaxies (factor of ~2–5).
6 SUMMARY AND CONCLUSIONS
We performed simulations of the optical band images seen in the HST ACS for the HUDF at high redshifts utilizing an unprecedented UV sample of nearby galaxies obtained through GALEX observations. The GALEX UV sample of nearby galaxies is representative of the overall galaxy population with various morphologies in the local universe (Gil de Paz et al. 2007), superseding the UV samples of previous studies that do not cover the full range of Hubble-types. This study primarily focuses on the simulation of high-redshift galaxies using UV data and the investigation of the quantitative morphology of nearby galaxies in comparison with those of high-redshift galaxies. Our simulation will be of importance in providing the basic information needed to study the images of high-redshift systems. The main results of this paper are summarized as follows.
-
1 Following the approach of Giavalisco et al. (1996), we artificially redshifted the GALEX NUV images of the sample galaxies to higher z-values, allowing us to simulate the appearance of galaxies at more distant reference frames. Many of the morphological features shown in the NUV images at z = 0 are still clearly observed in the simulated images at relatively low redshifts (e.g., z = 0.9) as the cosmological effects are negligible at this redshift. At higher redshifts (z > 2.4), some simulated spiral galaxies can be mistakenly classified as early-type or irregular galaxies and a fraction of early-type galaxies are undetectable in the simulated images.
-
2 We computed the C, A, G, and M20 parameters of galaxies in the NUV images at z = 0 and in the simulated optical images at high redshifts (i.e., z = 0.9 and 1.6) in order to quantify the morphology of the galaxies. For the selection of a reliable sample for analysis, we investigated the spatial resolution effect on the measurement of the morphological parameters in the NUV images of nearby galaxies. We found that all morphological parameters are reliable to within ~15 % for galaxy images with a resolution normalized by the galaxy size less than 5 %. We also adopt a mean S/N per pixel greater than 2 for the selection of sample galaxies with good S/N (Lotz et al. 2004).
-
3 The morphological parameters in the NUV images and galaxy morphological type from RC3 (and NUV-r color) exhibit an expected general correlation. This correlation implies that the morphological parameters measured in the UV images are an effective tool to discriminate galaxies with different morphologies and trace their global stellar population of galaxies. We further examined the morphological properties of nearby galaxies in the NUV using a combination of morphological parameters. In the G–M20, C–M20, A–C, and A– M20 planes, early-type galaxies are well separated from latetype galaxies, and it is ambiguous to discriminate late-type galaxies with different morphologies (from Sa to Irr).
-
4 Based on the distribution of galaxies in the plots of A–C and G–M20, we examined the morphological K-correction (i.e., cosmological distance effect and bandshift effect). By comparing the distribution of plots at z = 0 with those at higher redshifts (i.e., z = 0.9 and 1.6) in the rest-frame NUV, we found that the cosmological distance effect on the quantitative morphological parameters is significant for early-type galaxies. In contrast, in the distribution of plots using the morphological parameters measured from the GALEX NUV and SDSS r-band images at z = 0, late-type galaxies are more greatly affected by the bandshift effect, while this effect is negligible for early-type galaxies. Our results on the morphological K-correction could serve as a basis for understanding the intrinsic evolutionary effect of galaxies (e.g., O’Connell 1997; Windhorst et al. 2002).