1.INTRODUCTION
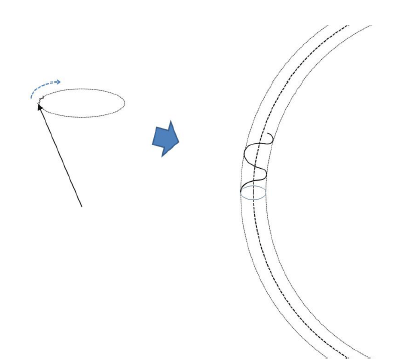
Chandler wobble and free core nutation are two major modes of perturbations in the Earth rotation. Earth rotation status needs to be known for the coordinate conversion between celestial reference frame and terrestrial reference frame. Due mainly to the tidal torque exerted by the moon and the sun on the Earth’s equatorial bulge, the Earth undergoes precession and nutation. Modeling of precession and nutation has become rigorous ever since the first development of Woolard and later one of Kinoshita (Moritz & Mueller 1988). The Earth’s reference pole, which is the origin of the geographic coordinates; latitude and longitude, was determined in the beginning of 20th century. However, the Earth’s rotational pole moves in time on the surface of the Earth, and this motion cannot be easily modelled because of nonlinear behavior of atmosphere and other various movements in the Earth. So called polar motion refers to the position of the true spin rotational pole denoted as (xp, yp). Official observation of the polar motion started more than a century years ago. Chandler wobble is also called Eulerian free nutation, because Euler early predicted its existence. Chandler wobble, along with annual wobble, are the largest components of the polar motion, and its period is about 430-435 days. Theoretical investigations and observations on its characters – period, quality factor, and its excitation source have been made repeatedly with improvements (Gross 2009). Poinsot diagram of Chandler wobble and the locus of angular velocity vector on the Earth during one Chandler period are illustrated in Figure 1 (left side). The body cone rotates around space cone every day. On the Earth’s surface the pole of rotation slowly moves counterclockwise around the symmetry axis of the earth with the Chandler period – here annual wobble or others are not considered. Smith (1977) clearly confirmed the definition of wobble and nutation: ‘wobble’ is the angle between CIP and symmetry axis, and ‘nutation’ is the angle of the symmetry axis from angular momentum vector. This definition was first made by Munk & MacDonald (1960).
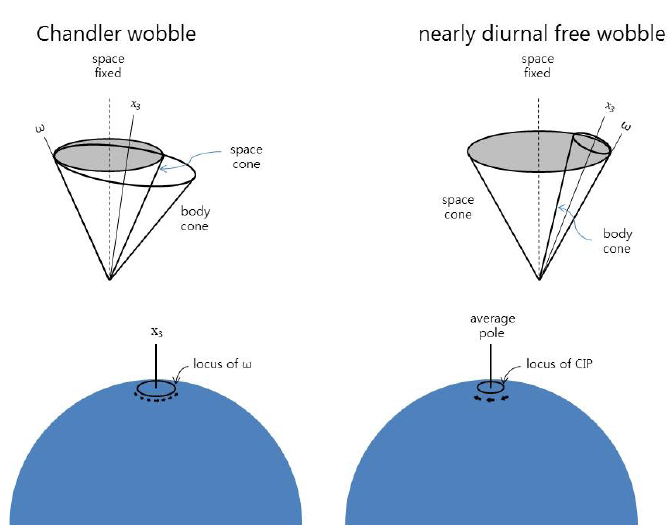
Not only the pole position changes on the Earth’s surface, but also exist small perturbation in the pole position on the celestial sphere - imposed on the known precession and nutation. This un-modelled error has been suspected to be associated with the free core nutation, which is another intrinsic mode of Earth’s rotational perturbation due to the mismatch between the two each rotational axes of the Earth’s mantle and core. After successful VLBI operation as well as accurate measurement of tidal gravity since 1980s, free core nutation has become clearly observable. The period of free core nutation has been reported to be around 430 days in the celestial sphere, however, free core nutation appears to be a diurnal variation for the observers on the earth. Therefore it is also called nearly diurnal free wobble. Poinsot diagram of free core nutation and its diurnal locus of angular velocity vector on the Earth are illustrated in Figure 1 (right side). The body cone spins clockwise nearly daily and rotates clockwise slowly with contacting the space cone: nearly diurnal free wobble. In this case the nutation angle is much larger than wobble (400 – 460 times) and body cone slowly moves with contacting the space cone with much longer period (again 400 – 460 times): free core nutation.
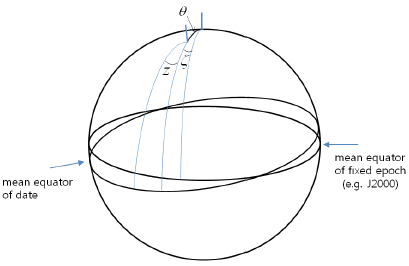
The IERS recommendation of the coordinate conversion from Celestial Reference Frame to Terrestrial Reference Frame is given as follows (Petit & Luzum 2010),
where Rprec+nut, Rspin, and Rpm are defined as follows.
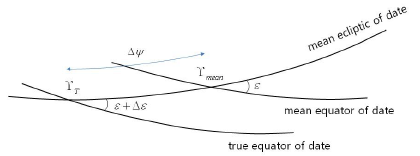
where; (1) X and Y are coordinates of the Earth pole in the celestial sphere - representing precession and nutation, (2) θ, s, and s’ are Earth’s spin rotation angle and two small correction terms, (3) xp and yp are called polar motion and denote true pole position on the Earth’s surface. More description of this coordinate transformation is given in the appendix.
Being the main components in pole positional perturbation on the Earth and celestial sphere, investigations were carried on Chandler wobble and free core nutation. One good summary about Chandler wobble was given by Gross (2009). An earlier workshop on Chandler wobble held in 2004 was a special and fruitful occasion dealing with diverse related disciplines (Plag et al. 2005). Mechanical existence of Chandler wobble mode itself is due to the equatorial bulge of the Earth, as early studied by Euler. Its reality was later confirmed by Chandler, while the period discrepancy of 14 months from 305 day was interpreted as the influence of mantle elasticity by Newcomb. Dahlen’s theoretical work was an important advance to explain the role of the global oceans increasing the period of Chandler wobble by 28 days. There have been controversies on the excitation mechanism of Chandler wobble, however, as accurate datasets accumulate on the global atmosphere and ocean, it is now widely accepted that Chandler wobble is being excited mainly by the changes in the states of atmosphere and ocean. Water and glacial mass redistribution on the surface and shallow crust of the Earth do another role in the polar motion. Earthquakes are no longer regarded as appreciable energy source of Chandler wobble (Gross 2009;Chung & Na 2016). Accurate estimation of Chandler wobble period and quality factor has long been attempted repeatedly by investigators using different approaches. Statistical methods were employed early, but after global data coverages, comparison between observation and model has become feasible. Furuya & Chao (1996) estimated Chandler period and quality factor as 433.7 days and 49 by minimizing the residual power between geodetic excitation function and atmospheric excitation. Gross elaborated and attained 431.9 days and 83 (Plag et al. 2005). There have been other type approaches, which led more or less similar results (see Plag et al. 2005;Gross 2009).
Theoretical studies of free core nutation started long ago by Poincare, Hough and others (Moritz & Mueller 1988), and later important step was made by Sasao (1980). The torque due to misalignment between the rotational axes of the mantle and the liquid core is known to be the cause of free core nutation. Unlike Chandler wobble excitation, the formulation of free core nutation excitation function is not clearly known. However, it is believed that free core nutation is also excited by atmosphere and ocean. Observation of free core nutation has been made either by accurate gravity observation or VLBI data analysis. Unlike its predicted period as 460 days by Sasao, studies repeatedly confirmed free core nutation period at around 430 days with small deviations (for example, Rajner & Brzezinsky (2017), Krasna et al. (2013), Defraigne et al. (1994) and dozens others cited in their references). On the contrary, large variation of the free core nutation period has been reported by Cummins & Wahr (1993) and recently by Gubanov (2010). Chao and Hsieh recently reported its period as 445 days (Chao & Hsieh 2015). Reported value of nearly diurnal free wobble Q varied largely from 1000 to several thousands. It is noted here that quality factor of free core nutation and that of nearly diurnal free wobble should be discerned, even though the two are identical phenomenon viewed from different reference frames: Qfcn Tfcn = Qndfw Tndfw.
Deep Earth inside processes are also candidates of some parts of Earth rotation variation – particularly decadal and other long periodic variations. All the dynamic processes of the Earth - atmospheric/oceanic/deep inside - eventually affect both Chandler wobble and free core nutation as well as other type perturbations in different amounts. In this article, we briefly summarize the theories of Chandler wobble and free core nutation. Also we report a few interesting results of our spectral analysis and modelling on them based on recent datasets.
2. BRIEF THEORETICAL SUMMARY
Except glacial isostatic adjustment and other slow Earth deep interior processes, overall mechanical response of the rotating Earth in the range of Chandler wobble and free core nutation can be explained by using linearized equation. This linearization holds true, even though the equations of hydrodynamic motions in the atmosphere or ocean are inherently nonlinear. In this section we summarize the theory of perturbation mode in the Earth’s spin rotation, which was originally given by Moritz & Mueller (1988).
Starting with rigid Earth we have simple equation for perturbation in its spin rotation as follows.
Define a coordinate frame rotating with constant angular velocity and another coordinate frame which has a slight deflection . Then the relation between the two coordinate frames can be written as , and the angular velocity of in frame can be written as
Insert Eq.(2) into Eq.(1), then we find (with setting ),
After rewriting the first two of Eq.(3) with defining and complex angle , we find
Assuming the solution for the Eq. (4) as , then we have the resulting condition for Ω as . Two solution of Ω are found as . These two may be compared with the frequencies of Chandler wobble and retrograde diurnal free wobble.
Now we assume the Earth is composed of rigid mantle and liquid core. Also we assume the core-mantle boundary is slightly elliptical so that it is expressed as follows.
The dynamical ellipticity of the core is almost the same as its flattening: . Denote the perturbed angular velocity of the mantle as and the relative angular velocity of the core w.r.t. mantle as , then the kinetic energy associated with the perturbed motion can be written as
where , and are the rotational inertia of the core.
Consider torque free motion for the whole Earth, then we have
Likewise we have following equation for the core free motion as
From the third equations of the two sets, we have . Assuming are small enough, the four other equations can be rewritten as follows.
These can be gathered into two following complex equations with defining complex quantities as .
Assuming oscillatory solution for ω and , Eq.(5) is expressed in matrix form as
Then, for existence of nontrivial solution, we have following condition.
With approximations as , Eq.(6) can be written as
(7) The frequency Ω of the mode of our interest can be found by using perturbation scheme, for the ellipticity ε is small (less than 1 percent). Taking ε = 0 in Eq. (7), we find two solutions of zero order as follows.
By putting terms of ε into right hand side, Eq. (7) can be rewritten as follows.
Write and insert it into Eq. (9), we find . Corresponding frequency is . Likewise, write and insert it into Eq. (9), we find and so . With proper values of ε = 1/400 and C/Cm = 1.13, we find εC/Cm = 0.0028.
Sasao (1980) extended this theory by including elasticity of mantle. His final equation for the eigenfrequency of perturbation mode of Earth rotation is given as follows.
Corresponding solutions of Ω are found as follows.
The values of parameters used above are known as e = 0.00329, ε = 0.00252, κ = 0.00105, β = 0.00063. Therefore, the frequencies are Ω1 = 0.00253ω0 and Ω2 = -1.00213ω0. The period of the wobble corresponding to Ω1 = 0.00253ω0 is 396 days, however, the effect of ocean is to increase this value by 28 days. Then theoretical value of Chandler period becomes 424 days. Also the frequency of second mode (nearly diurnal free wobble) is Ω2 = -1.00213ω0, while its apparent frequency to the inertial observer in space (free core nutation) should be -1.00213ω0, of which period is about 470 days.
3. DATA ANALYSIS
For inspection of recent features of Chandler wobble and free core nutation, we used IERS EOP C04 time series (January 1962 - August 2018), which contain the dataset of polar motion and LOD as well as the celestial pole offset; δX and δY. We evaluated atmospheric excitation function by using the global ECMWF interim dataset of barometric pressure and wind distribution.
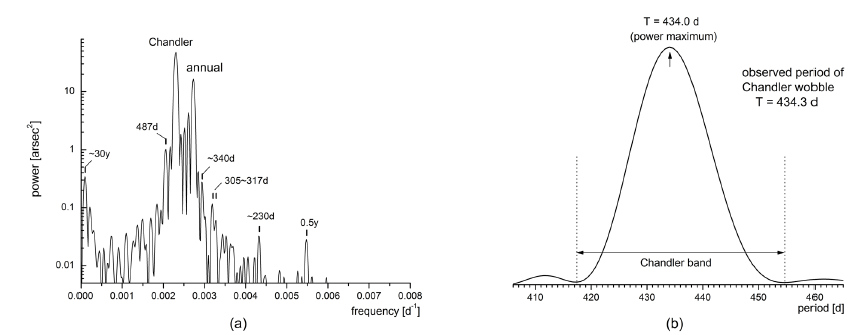
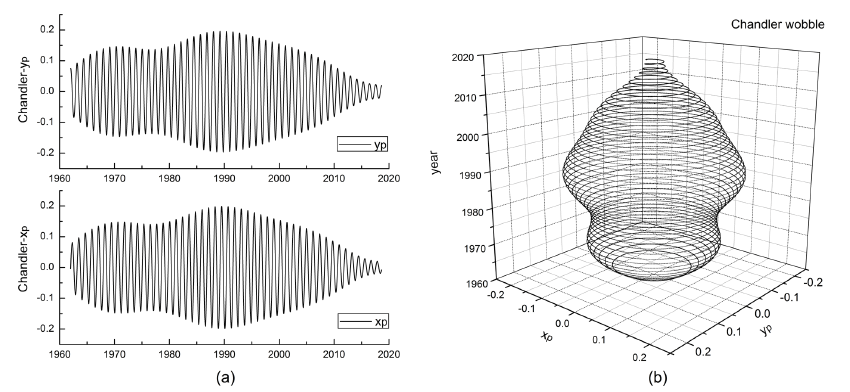
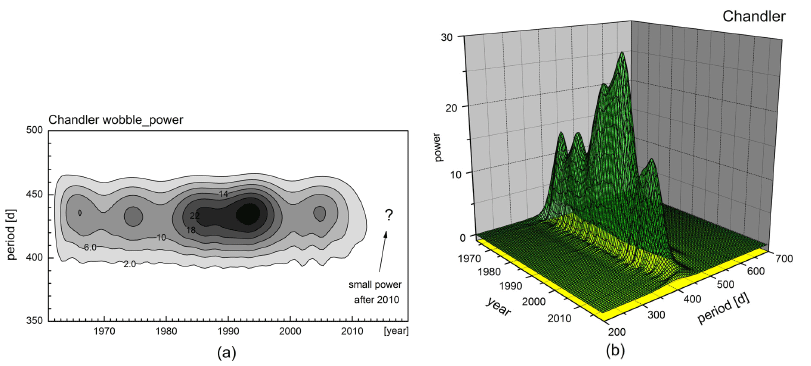
Polar motion is referred to the (xp, yp), which is the coordinate of Earth’s spin angular velocity (termed as CIP) with respect to its nominal position of 1900-1905. The Fourier power spectrum of the polar motion is shown in Figure 2. To enhance the resolution and fidelity of the spectrum we separated the daily-basis dataset into four subsets of day number n = 4k, 4k+1, 4k+2, and 4k+3, and then added all the each four corresponding spectra. Obviously Chandler and annual wobble take the dominant parts in the spectrum, and there also exist other components of which periods are about 487, 340, about 300 days and others (Fig. 2a). Period of maximum power in the Chandler band was found as 434.0 days (Fig. 2b). From analysis on power spectrum in frequency domain, its center period was found as 434.3 days (423.6d < T < 445.6d as ±1s range). Assuming white spectral excitation, one may deduce the quality factor from the spectrum. We found corresponding value as Q = 30. Chandler wobble components acquired by filtering in the frequency domain from IERS EOP C04 data are shown in Figure 3a. It is noticeable that the amplitude of Chandler wobble has been much reduced since 2010. After 2015, its amplitude is less than 30 milliarcsec. Wavelet spectrum of Chandler wobble time series has been attained by using Morlet wavelet and is illustrated in Figure 3b. In the figure, a slight variation of temporal period of Chandler wobbling motion can be seen. 3-dimensional surface illustration wavelet spectrum describes evident Chandler wobble amplitude variation together with its slight periodicity variation.
By comparing geodetic excitation function derived from polar motion and atmospheric excitation function derived from ECMWF dataset in frequency domain of Chandler band, we acquired estimate of Chandler period and quality factor. Three different criteria have been tested: (a) minimum sum of squared difference (Gross method; in Plag et al. 2005), (b) minimum sum of power difference (Furuya & Chao method; Furuya & Chao, 1996), (c) minimum sum of power difference plus total power difference. Results are followings: (a) T = 431.0 days & Q = 265, (b) T = 432.5 days & Q = 47, (c) two sets T = 432.3 days & Q = 45 and T = 433.1 days & Q = 43. The results are also illustrated in Fig. 5. Simple average of these may be taken as T = 432.2 days and Q = 100.

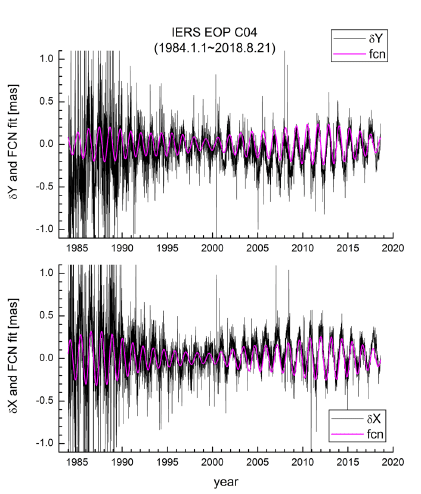
The celestial pole offset; δX and δY since 1984 are given in EOP C04 dataset. In Figure 6, the data and the free core nutation as acquired by filtering on the frequency domain are shown together. Relatively large error in δX and δY exist in the early time before 1990. Basically the celestial pole off set has been determined from vast amount of VLBI observations through lengthy reduction procedure including the comparison with model of the Earth’s precession and nutation.
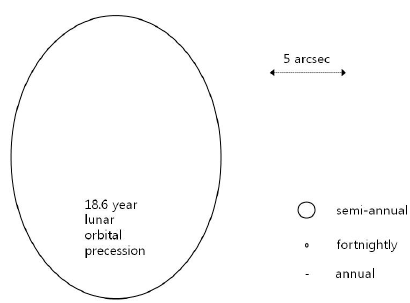
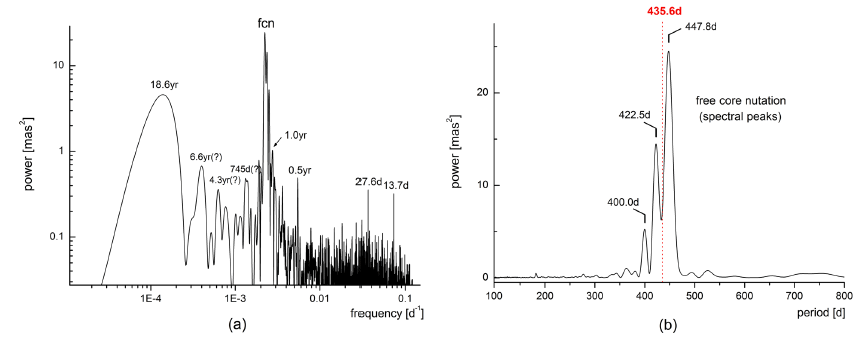
The Fourier power spectrum of the celestial pole offset is shown in Figure 7. For better resolution of the spectrum we again used four sets of day number = 4k, 4k+1, 4k+2, and 4k+3, and then added the each four corresponding spectra. From the spectra, it is clear that free core nutation takes more than 95 percent of total power, however, small content of 18.6 year and 1 year periodicities as well as other weak periodicities can be seen (Fig. 7a). These minor contents can be regarded as minute traces of residual forced nutation - not compensated by the model. Fourier spectrum shows that spectral peaks are split into three ones, of which periods are 448, 423, and 400 days and others (Fig. 7b). Its center period was found as 435.6 days (409.2d < T < 465.6d as ±1σ range) from the distribution of power in frequency domain. Assuming white spectral excitation, we found the quality factor of free core nutation as Q = 8 from the power spectrum. Corresponding quality factor of nearly diurnal free wobble follows as Q = 3600.
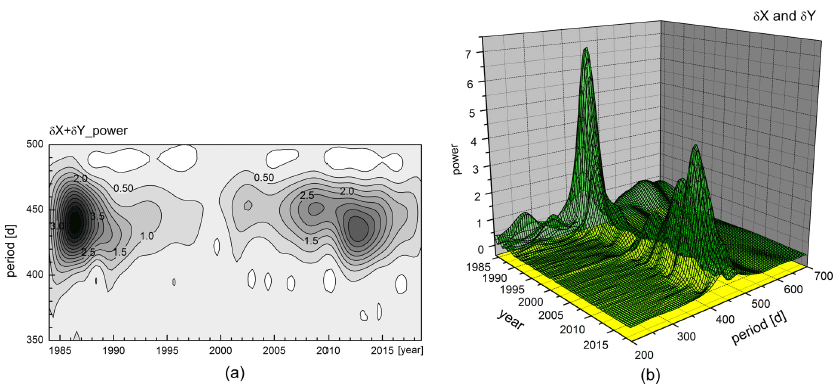
Wavelet spectrum of celestial pole offset time series has been attained by using Morlet wavelet and is illustrated in Fig.8. Large variations of both the temporal amplitude and periodicity of free core nutation are noticeable. 3-dimensional illustration gives panoramic view of these features.
4. DISCUSSION AND CONCLUSION
As shown in Figure 3(a) the amplitude of Chandler wobble kept on decreasing since 1990 and is now one third of its average amount or less. Though not shown here, atmospheric excitation has not so decreased with such large reduction at the same time, therefore, other source of excitation must have affected significantly. From the comparisons between geodetic excitation and atmospheric excitation, the period and Q-value of Chandler wobble were determined as T = 432.2 days and Q = 100 in this study, while direct interpretation on the power spectrum led T = 434.3 and Q = 30. This discrepancy could be partly due to un-modeled oceanic excitation.
Average period of free core nutation was found as T = 435.6 days in the given time span (1984 – 2018), however, its periodicity is found unstable with variations over 50 days. Unlike Chandler wobble, we have not attempted to infer the period and Q-value of free core nutation by excitation comparison, for its excitation function is not quite accurately formulated. From the power spectrum the quality factor of free core nutation was read as Q = 8, which corresponds to nearly diurnal free wobble quality factor as Q = 3600. Morlet wavelet spectrum well describes the amplitude and period variations of free core nutation.
Existence of free core nutation is due to misalignment of rotation axes of mantle and liquid core associated with the ellipticity of core-mantle boundary (ε = 0.00252 in Eq. 10). Thus its large period variation is quite possibly caused by a certain change in the core-mantle boundary. More investigations are needed in both its theory and data analysis. It is also desirable to have reliable formulation for excitation function of free core nutation.
