

1. INTRODUCTION
A Forbush decrease (FD) is a phenomenon characterized by a sudden decrease in cosmic ray intensity associated with solar activity and was first reported by Forbush (1937). This phenomenon is generally attributed to the modulation of galactic cosmic rays (GCRs) by interplanetary (IP) shocks and magnetic structures associated with interplanetary coronal mass ejections (ICMEs) as they propagate through the heliosphere and pass the Earth (Venkatesan et al. 1992; Ananth & Venkatesan 1993; Badruddin 2002; Oh et al. 2008; Oh & Yi 2012).
FD events are commonly divided into three phases similar to phases of geomagnetic storm: the initial phase, main phase and recovery phase. The initial phase is the brief period immediately preceding the main drop in cosmic ray intensity. It is characterized by small, directional variations such as a subtle decrease or localized increase in cosmic ray intensity caused by the approach of an IP shock and its associated coronal mass ejection (CME) before they actually impact Earth's magnetosphere. The main phase is defined as the period from the onset of the rapid drop in cosmic ray intensity to the minimum value, typically lasting approximately half a day. The recovery phase corresponds to the gradual return of cosmic ray intensity toward its pre-event level and usually continues for approximately one week (Lockwood 1971; Oh & Yi, 2009). In some cases, FD events show a two-step decrease associated with the sequential passage through the shock/sheath region and the magnetic ejecta region of an ICME (Cane 2000).
FDs can be observed using several types of cosmic ray detectors, among which the neutron monitors are one of the most widely utilized ground-based instruments (Clem & Dorman 2000; Simpson 2000). Neutron monitors record secondary neutrons produced when primary GCRs interact with atmospheric particles. Variations in neutron monitor count rates reflect changes in the flux of high-energy cosmic rays reaching near-Earth space and provide an effective means of identifying short-term modulation events, such as FDs. In particular, the worldwide neutron monitor network enables detailed investigations of FD onset times, depression amplitudes, and recovery characteristics at different locations (Oh & Yi 2009). In addition, observations from neutron monitor stations with different geomagnetic cutoff rigidities provide valuable information on the rigidity- or energy-dependent characteristics of cosmic ray modulation during FD events (Usoskin et al. 2008).
In 2024, the Daejeon neutron monitor was relocated to the Satellite Laser Ranging (SLR) observation site at Mt. Gamak in Geochang, Korea (Lim 2017; Lim et al. 2018), due to maintenance and operational issues at the previous site (Jung et al. 2025). The relocated Geochang neutron monitor (GCHN) now serves as a ground-based cosmic ray observation facility in the East Asian mid-latitude region, providing an opportunity to investigate cosmic ray variability at relatively high geomagnetic cutoff rigidity. Because GCHN operates under a comparatively high geomagnetic cutoff rigidity, strong FD events offer valuable opportunities to evaluate its sensitivity and observational capability under such conditions.
In this study, we investigate the FD event of 19 January 2026, one of the most significant FD events observed since the relocation of GCHN. By comparing the response recorded at GCHN with observations from neutron monitor stations distributed worldwide, we evaluate the consistency of GCHN observations within the global neutron monitor network. We also examine the rigidity-dependent characteristics of the event and discuss the potential role of GCHN in future studies of FDs and ground-based cosmic ray variability.
2. DATA AND ANALYSIS METHODS
To investigate the evolution of the January 2026 FD event, we analyzed observations of solar activity, interplanetary conditions, geomagnetic disturbances, and cosmic ray variations. Solar activity was characterized using X-ray and proton intensity measurements from the GOES-18 satellite, which are available from the NOAA/SWPC (http://www.swpc.noaa.gov).
Interplanetary parameters, including the interplanetary magnetic field (IMF), solar wind speed, and density were obtained from the SWx TREC Space Weather Data Portal (https://doi.org/10.25980/NMFX-XX89). Specifically, the IMF data were provided by the ACE/MAG instrument, while the solar wind speed and density data were sourced from the ACE/SWEPAM instrument and the ACE Science Center. To evaluate the geomagnetic impact of these solar events, we utilized the Dst index provided by the World Data Center (WDC) for Geomagnetism in Kyoto, Japan.
Cosmic ray variations during the FD event were investigated using data from 17 neutron monitor stations, including the GCHN. Data from the remaining 16 neutron monitor stations were obtained from the Neutron Monitor Database (NMDB; https://nmdb/eu/; Mavromichalaki et al. 2011). Detailed information on the selected stations is listed in Table 1, and their geographic locations and geomagnetic cutoff rigidities are shown in Fig. 1. The cutoff rigidity of GCHN (11.3 GV) was calculated using the Oulu Open-source Geomagnetosphere Propagation Tool (OTSO) with the International Geomagnetic Reference Field (IGRF) model (Larsen et al. 2023). Because cutoff rigidity depends on geomagnetic field configuration and access trajectories of charged particles, stations at similar geographic latitudes may have different cutoff rigidities. Although the relocated station was referred to as the Mt. Gamak neutron monitor in Jung et al. (2025), we use its official designation, GCHN, throughout this paper. The installation procedure, pressure-correction procedure, and basic data-quality characteristics of the GCHN were described by Jung et al. (2025). Following the methodology established in that study, we analyzed pressure-corrected GCHN count rates to examine the 19 January 2026 FD event, focusing on the observed cosmic ray response rather than on instrumental validation.
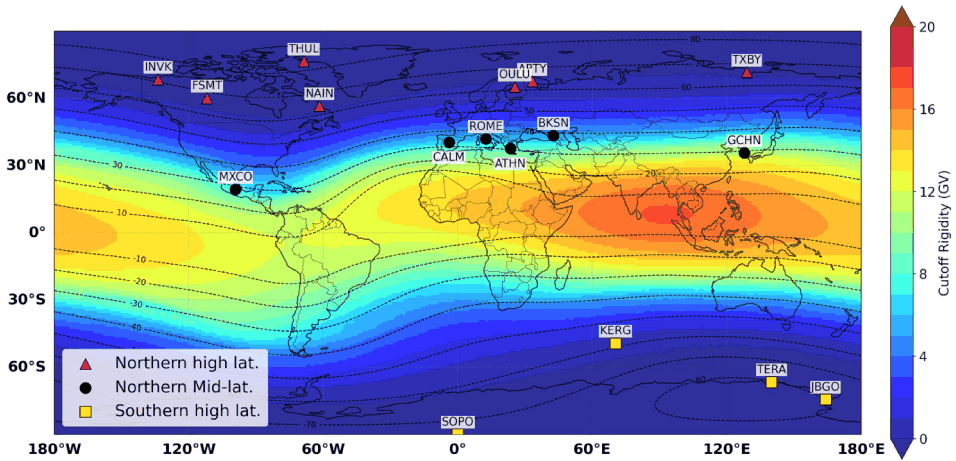
For comparative analysis, the 17 neutron monitor stations were grouped into three geographic regions: northern high-latitude, northern mid-latitude, and southern high-latitude regions, based on their geographic locations. This classification was used to compare the temporal characteristics of the FD among broadly separated geographic regions.
Neutron monitor count rates were converted to percentage variations relative to a pre-event reference level, defined as the mean count rate during the interval from 18:00 UT on 18 January to 18:00 UT on 19 January 2026, prior to the arrival of the CME-driven IP shock (18:55 UT on 19 January 2026). This interval ended before the arrival of the CME-driven IP shock and was selected to provide a stable reference while reducing the influence of short-term fluctuations and diurnal variations.
The relative variation was calculated as:
where N is the neutron monitor count rate and N0 is the corresponding pre-event mean count rate. For inter-station comparisons, all neutron monitor data were resampled to a temporal resolution of 30 min. The FD amplitude was quantified using the minimum GCR variation, defined as the lowest value of GCR percentage variation observed between the onset of the main phase and 06:00 UT on 20 January. The end time of 06:00 UT on 20 January was selected because all selected stations reached their event minimum within this interval. Because FD signatures appear as negative deviations in cosmic ray intensity, more negative minimum GCR variation values correspond to larger FD amplitudes.
For the temporal comparison, the onset of the FD main phase was estimated as the beginning of the sustained rapid decrease toward the event minimum in the 30-min averaged neutron monitor profiles. Because the data were analyzed at a temporal resolution of 30 min, differences of cosmic ray variations should be interpreted with caution.
3. OVERVIEW OF THE 19 JANUARY 2026 EVENT
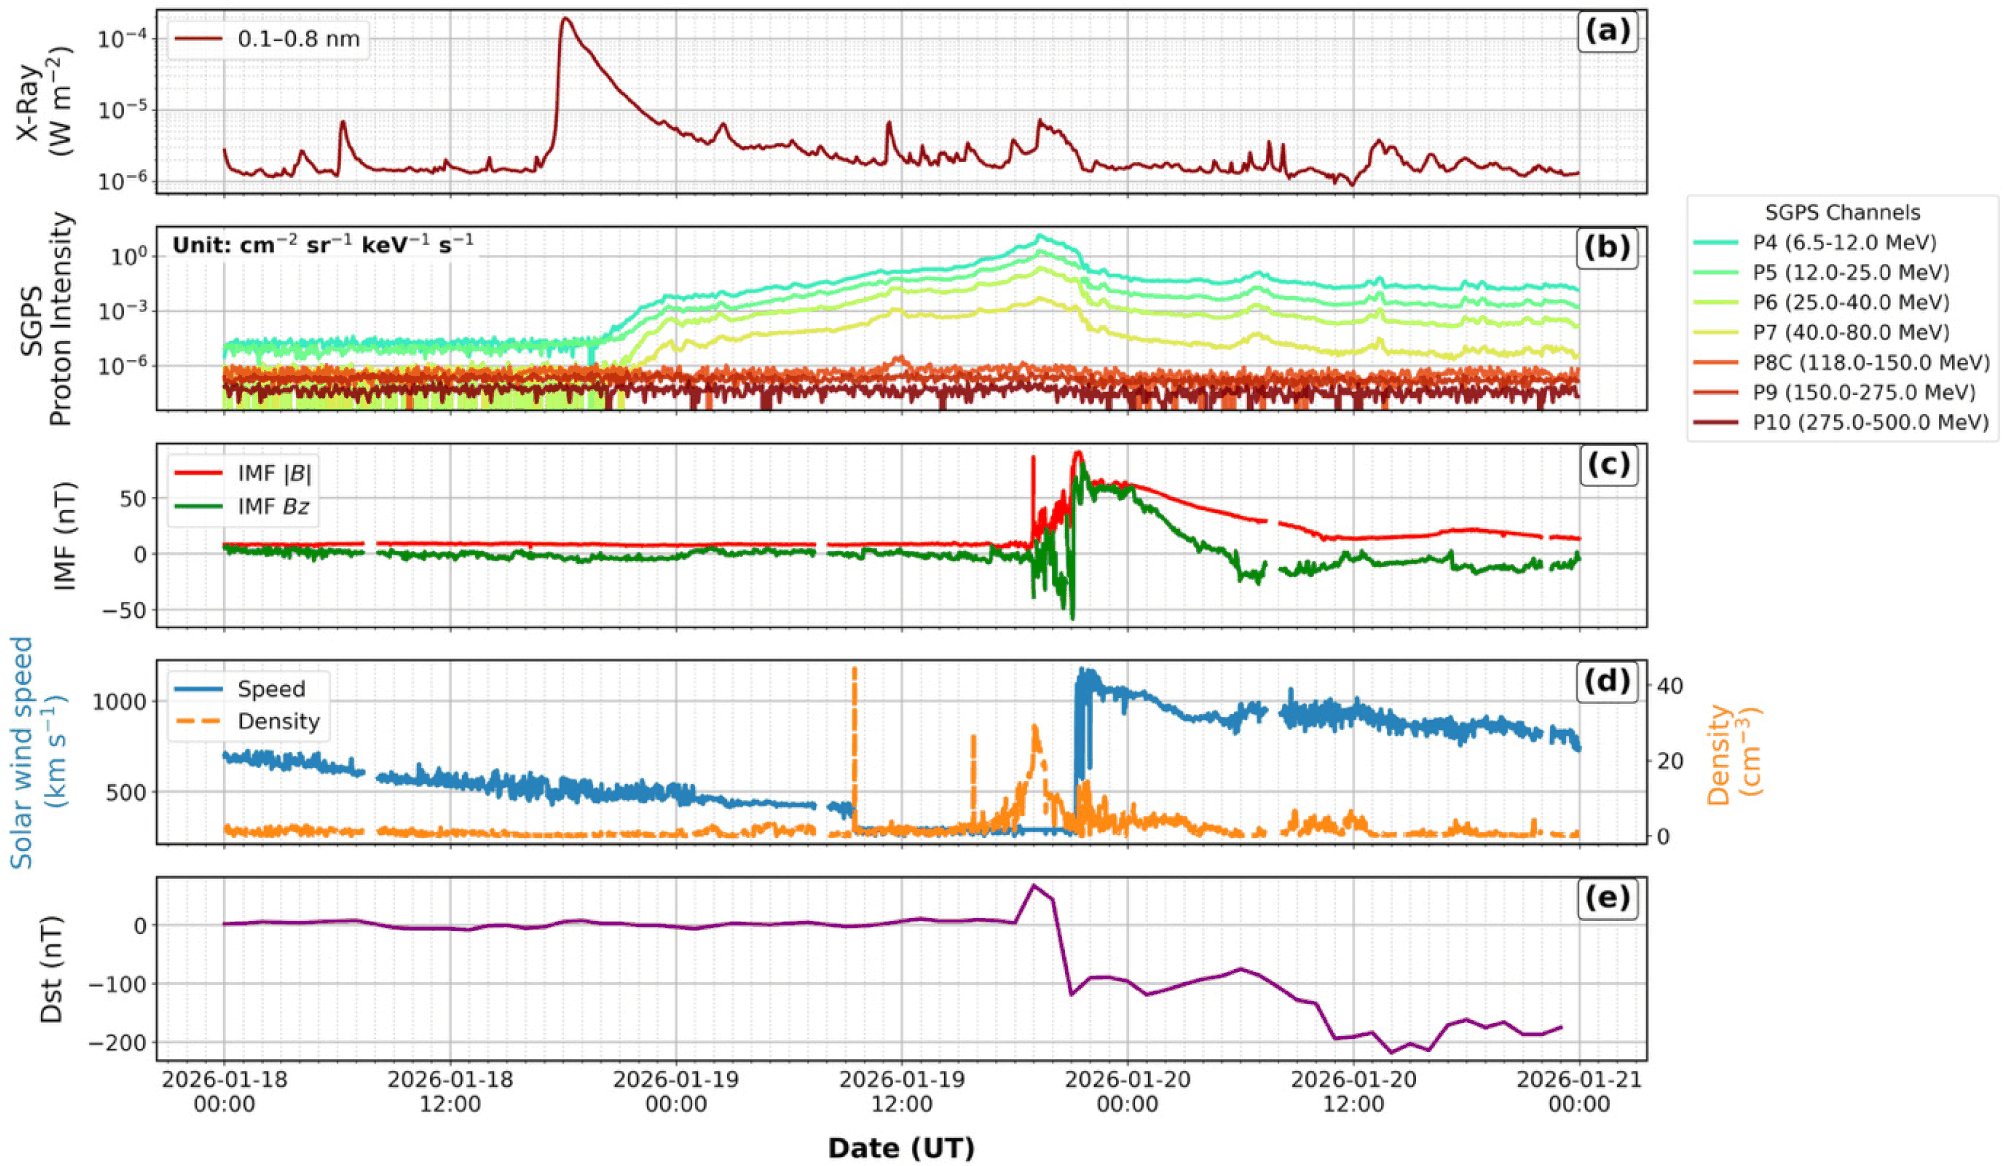
Fig. 2 presents the solar, interplanetary, and geomagnetic parameters observed from 18 to 20 January 2026. At 18:09 UT on 18 January 2026, an X1.9 flare occurred in active region (AR) 14341 (S15°, E20°) and was accompanied by a CME. According to the NASA/CCMC CME Scoreboard (https://kauai.ccmc.gsfc.nasa.gov/CMEscoreboard/), the associated CME-driven IP shock arrived at L1 at 18:55 UT on 19 January 2026. The proton intensity began to increase at ~20:00 UT on 18 January, which can be attributed to the preceding M1.1 flare from AR 14345. A subsequent enhancement of proton intensity starting at ~12:00 UT on 19 January, was associated with the CME and X1.9 flare (Fig. 2(a)). During this event, the > 10 MeV proton intensity reached a peak value of approximately 37,000 PFU (particles cm–2 s–1 sr–1) at 19:15 UT on 19 January, representing the most intense proton event since the major solar proton event of October 2003 (Halloween storms). Following the May 2024 superstorm (Kwak et al. 2024), the event also marked another significant episode of extreme space weather activity during Solar Cycle 25. In contrast, the high-energy proton channels (P8-P10, > 100 MeV) relevant to GLE detection showed no clear enhancement (Fig. 2(b)). This indicates that although the event produced a strong SEP enhancement at lower energies, the absence of a clear enhancement in the >100 MeV proton channel is consistent with the lack of a reported GLE (Oh et al. 2010). Consistent with this interpretation, no GLE was reported during the event. The IMF magnitude, |B|, reached a peak value of ~86 nT near the onset of the IP shock (Fig. 2(c)). The ACE/SWEPAM solar wind speed and density measurements during this interval may have been affected by proton contamination, because enhanced solar energetic protons can corrupt real-time ACE solar wind measurements during SEP events as reported by Machol et al. (2013). Nevertheless, the available data indicate that the solar wind speed increased to approximately 1,000 km/s after 21:00 UT on 19 January, while the solar wind density increased to ~30 cm–3 at 18:55 UT (Fig. 2(d)). A sudden storm commencement (SSC) was observed at ~18:00 UT on 19 January, followed by the onset of the geomagnetic storm main phase, as indicated by a sharp decrease in the Dst index.
4. RESULTS AND DISCUSSION
Fig. 3 compares the cosmic ray variations observed at the GCHN and JBGO neutron monitor stations during the January 2026 FD event. Both stations recorded a clear and rapid decrease in cosmic ray intensity beginning at approximately 21:00 UT on 19 January, marking the onset of the FD main phase. The minimum GCR variations reached −13.7% at GCHN and −19.5% at JBGO, indicating a substantially larger decrease at the Antarctic high-latitude station. This difference is consistent with the small geomagnetic cutoff rigidity of JBGO, which makes it more sensitive to cosmic ray modulation at lower cutoff rigidity. Following the main phase, both stations showed a gradual recovery, although the recovery at JBGO remained more depressed than that at GCHN. Although GCHN showed a weaker response than JBGO, the clear FD signature at GCHN demonstrates that the interplanetary disturbance associated with this solar activity event was strong enough to modulate cosmic ray intensity at a mid-latitude station with relatively high geomagnetic cutoff rigidity.
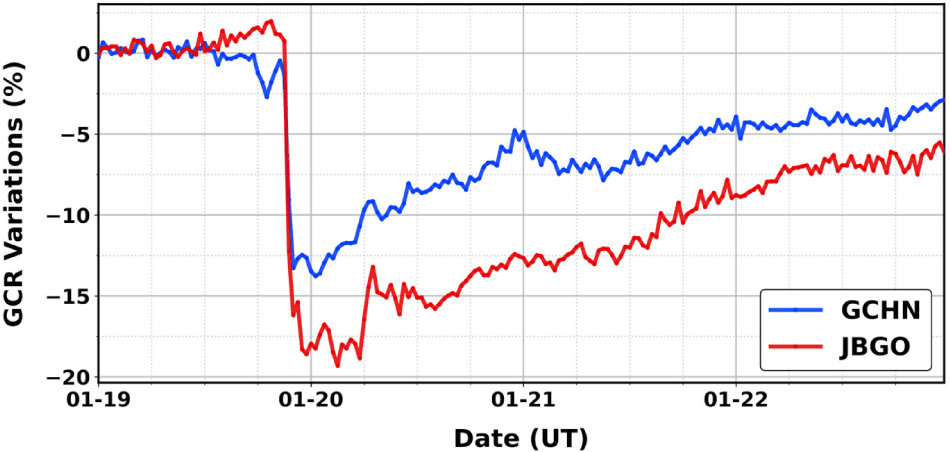
Fig. 4 shows the cosmic ray variations observed at the 17 neutron monitor stations from 15:00 UT on 19 January to 06:00 UT on 20 January 2026. A distinct decrease in cosmic ray intensity was observed at all selected stations, indicating that the FD signature was detected across a broad range of latitudes. The rapid main-phase decrease became evident after arrival of the CME-driven IP shock at L1, marked by the red dashed line, and was followed by a subsequent gradual recovery.
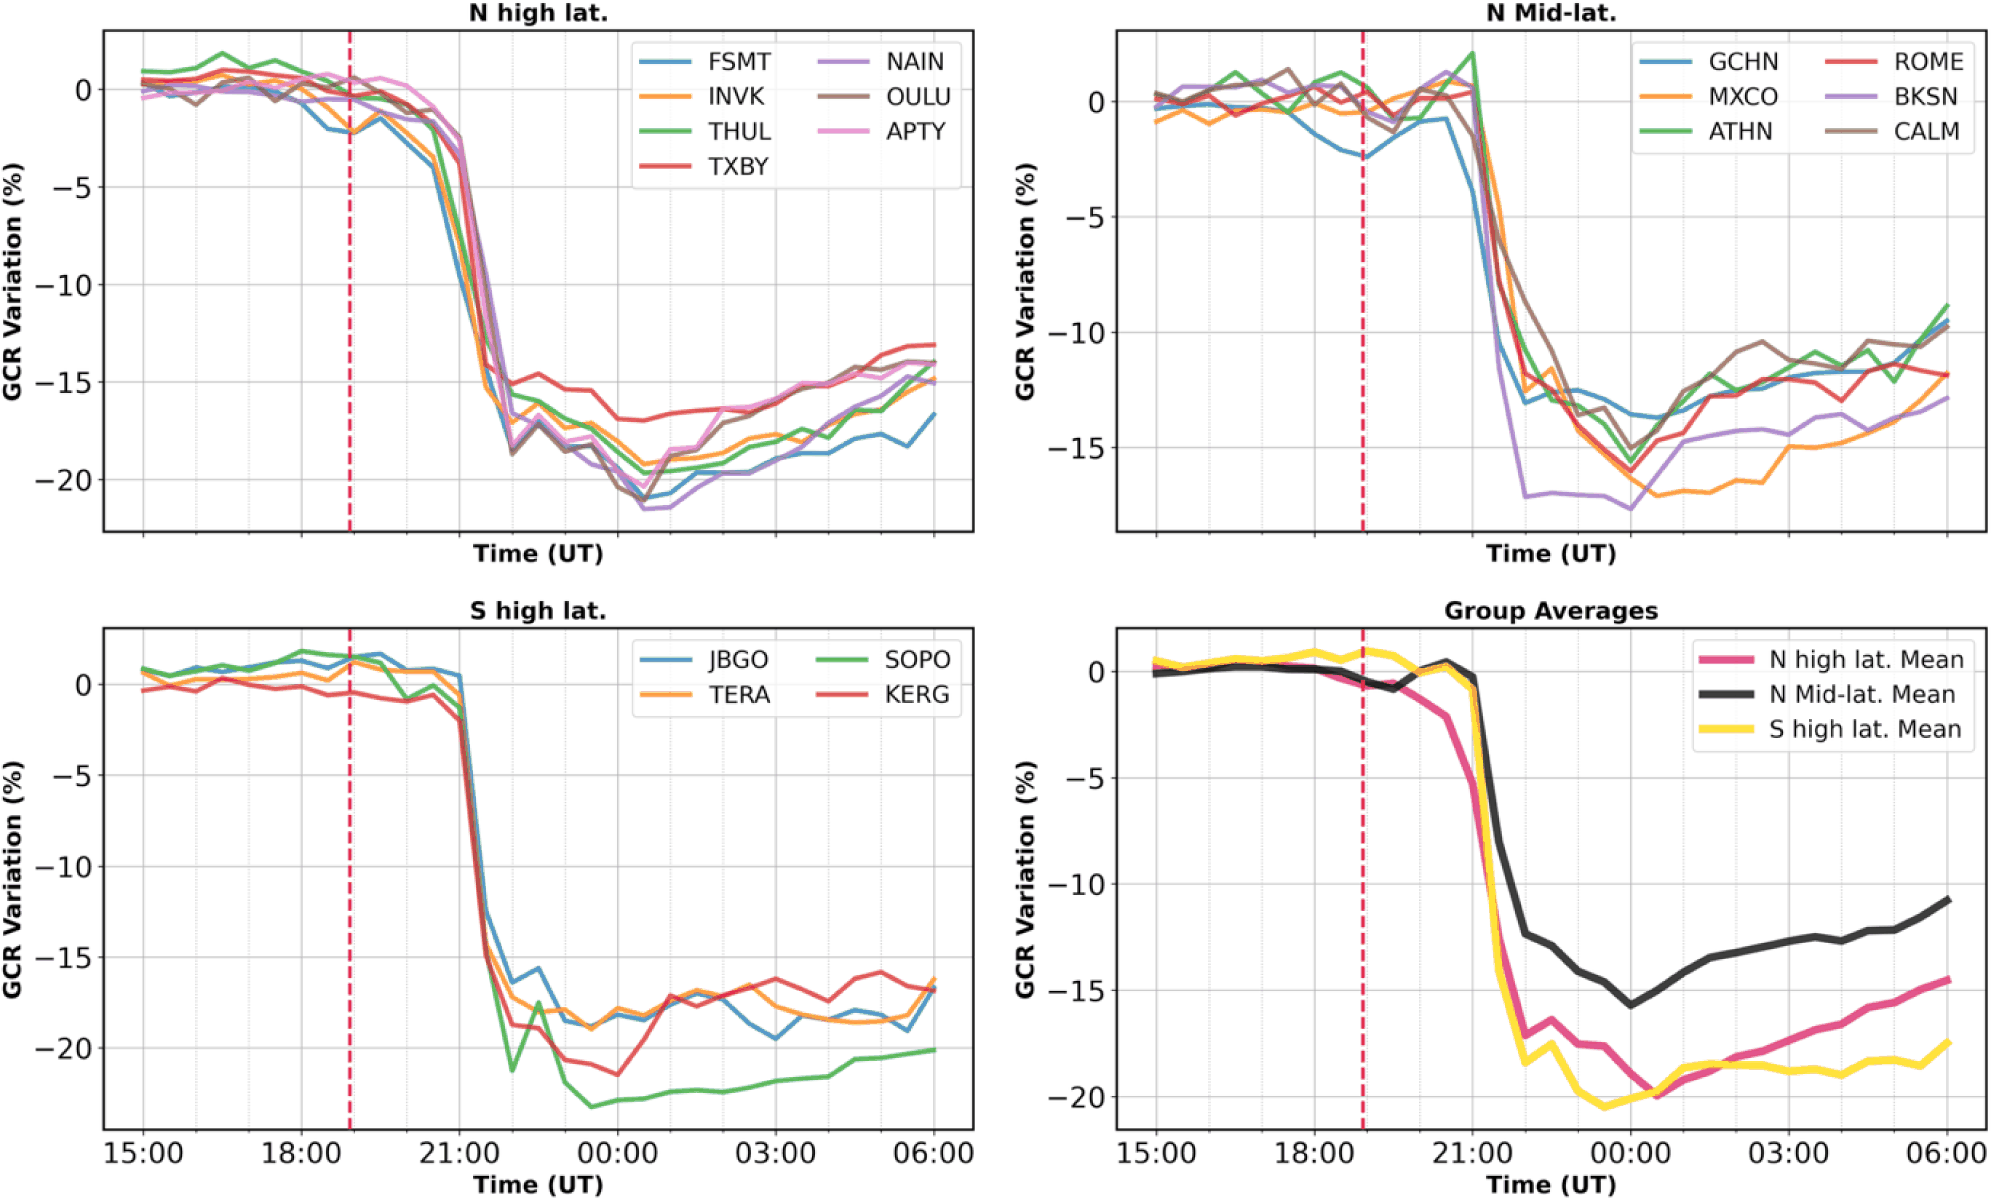
The group-averaged profiles reveal notable differences of FD signatures among the three latitude groups. The northern high-latitude stations showed a gradual decrease prior to the IP shock arrival, followed by a rapid main-phase decrease. In contrast, the northern mid-latitude stations exhibited small fluctuations before the onset of the main-phase decrease, whereas the southern high-latitude stations remained nearly stable until the rapid decrease began. The onset of the main phase at the northern high-latitude stations appeared to occur approximately 30 min earlier than at the other stations. Because the data were resampled to a temporal resolution of 30 min, however, this timing difference should be interpreted with caution.
The apparent early decrease observed at some northern high-latitude stations may be associated with directional variations in cosmic ray intensity. The anisotropy in cosmic ray, together with differences in the asymptotic viewing directions of individual neutron monitors, can produce the responses dependent on the station because neutron monitors at different geographic locations sample particles arriving from the different directions in interplanetary space (Plainaki et al. 2009). The modulation dependent on the local time may also affect the apparent timing and shape of FD variations (Oh & Yi 2009). In addition, the propagation direction of the responsible ICME can produce asymmetric cosmic ray modulation among neutron monitor stations (Jung et al. 2023). Although the observed early decrease resembles a precursor-like variation, Papailiou et al. (2024) showed that clear pre-decreases were not observed in the majority of the 50 large FD events examined, with only three events showing signs of a pre-decrease. Therefore, the observed early decrease should not be regarded as definitive evidence of a typical FD precursor. Since the anisotropy of cosmic ray and the station-specific asymptotic viewing directions were not quantitatively analyzed in this study, the relative contributions of these mechanisms cannot be determined from the present observations.
In this context, the location of GCHN in the East Asian mid-latitude sector, together with its relatively high geomagnetic cutoff rigidity of 11.3 GV, provides complementary observational coverage for comparing station-dependent differences in FD onset.
Fig. 5 shows the cosmic ray variations observed at three mid-latitude neutron monitor stations during the 19 January 2026 FD event. At the time of the CME-driven IP shock arrival at L1 at 18:55 UT, the stations were located in distinctly different local-time sectors. The GCHN was located on the nightside at 03:26 LT and exhibited a gradual decrease beginning near the shock arrival time. In contrast, MXCO at 12:18 LT and ATHN at 20:30 LT remained relatively stable until the rapid main-phase decrease began after approximately 21:00 UT.
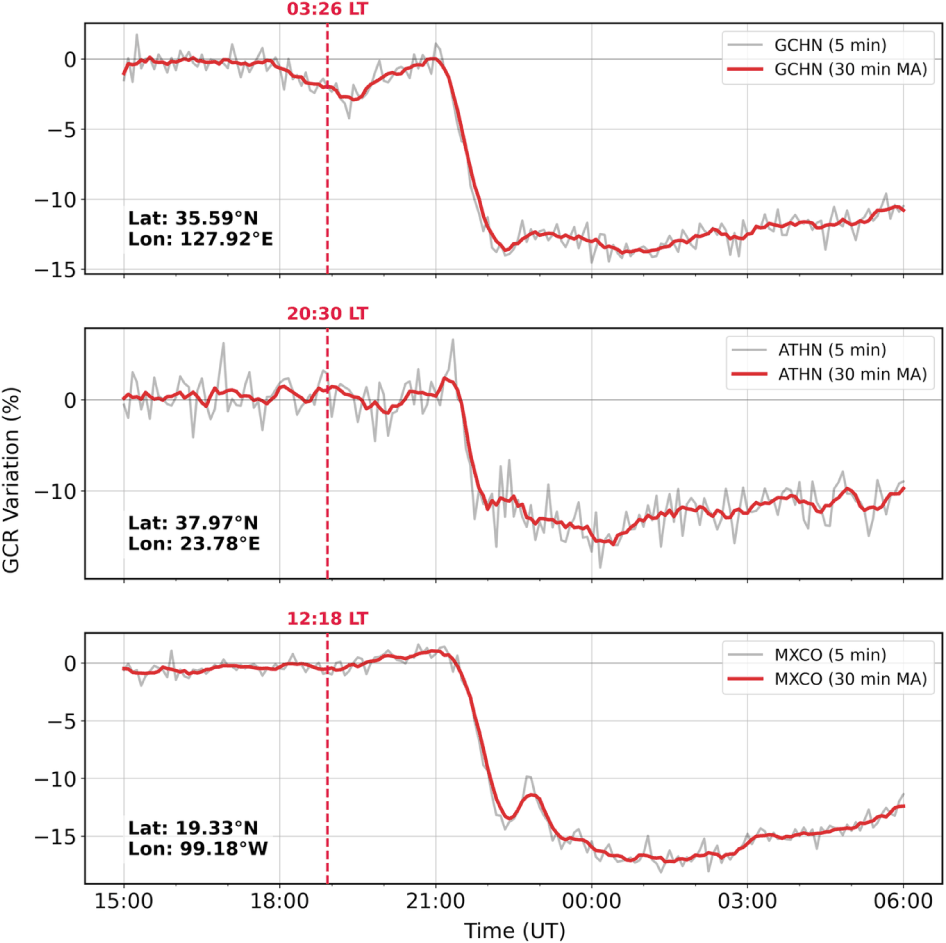
These differences suggest that the modulation dependent on local time may contribute to the station-dependent characteristics of the early FD variation. At the time of the IP shock arrival, GCHN was located at approximately 03:26 LT. Jung et al. (2025) showed that the diurnal variation of cosmic ray intensity at GCHN reaches its minimum at approximately 03:00 LT and its maximum at approximately 14:00 LT. Oh et al. (2008) showed that the diurnal variation dependent on local time can influence the apparent onset of non-simultaneous FD events, particularly when a relatively weak FD decrease is superposed on the declining phase of the diurnal variation. In the present event, however, the shock arrival at GCHN occurred close to the diurnal minimum rather than during the declining phase emphasized by Oh et al. (2008). Therefore, the modulation dependent on local time alone cannot fully explain the gradual early decrease observed at GCHN. Additional station-dependent effects, such as cosmic ray anisotropy and asymptotic viewing geometry, may also have contributed to the observed differences among the mid-latitude stations. The comparison demonstrates that GCHN provides complementary observational coverage in the East Asian mid-latitude sector for examining station-dependent FD onset signatures.
The dependence of the FD amplitude on geomagnetic cutoff rigidity is shown in Fig. 6. Overall, the minimum GCR variation becomes progressively less negative with increasing cutoff rigidity. A strong correlation was found between cutoff rigidity and minimum GCR variation (r = 0.79), indicating that stations with higher cutoff rigidities generally recorded weaker FD amplitudes.
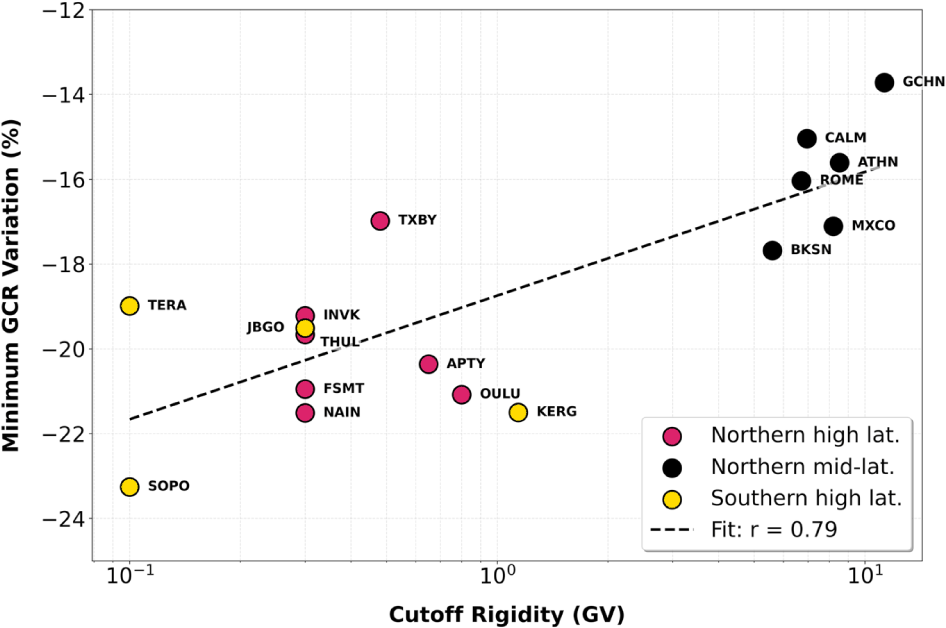
Lockwood (1971) reported that the rigidity controls the magnitude of decrease and the recovery phase time, their onset times and anisotropies and precursory increases. This result is consistent with the well-established rigidity dependence of FD events, whereby stations with lower cutoff rigidity generally show stronger FD amplitudes during interplanetary disturbances. Nevertheless, the scatter among stations indicates that cutoff rigidity alone does not account for all of the inter-station variability in FD amplitudes. Other factors, including cosmic ray anisotropy, asymptotic viewing directions, local-time effects, and station-specific viewing geometry, may also contribute to the observed differences. However, their quantitative contributions were not evaluated in the present study. A dedicated analysis of these effects, including calculations of station-specific asymptotic viewing directions and cosmic ray anisotropy, will be considered in future work using this event and additional FD events.
Among the selected stations, the GCHN has the highest cutoff rigidity and recorded the weakest FD amplitude, with a minimum GCR variation of −13.7%. This behavior is consistent with the overall rigidity-dependent trend shown in Fig. 6. Despite its relatively weak response compared with those of polar and high-latitude stations, the decrease was nevertheless distinct and clearly detectable. This result demonstrates that the January 2026 event was sufficiently intense to produce a measurable FD signature even under the relatively high geomagnetic cutoff conditions of GCHN.
5. SUMMARY AND CONCLUSIONS
We investigated the FD on 19 January 2026 using observations from the Geochang neutron monitor (GCHN) together with observations from 16 additional neutron monitor stations distributed across a wide range of latitudes. The event was associated with a CME-driven IP shock related to the X1.9 solar flare on 18 January 2026. Following the shock arrival, a clear decrease in cosmic ray intensity was observed throughout the selected neutron monitor network, confirming the global nature of the FD event.
GCHN recorded a distinct FD signature, with a minimum GCR variation of approximately −13.7%. In comparison, the Jang Bogo neutron monitor (JBGO) recorded a substantially larger decrease of about −19.5%, consistent with its lower geomagnetic cutoff rigidity and greater sensitivity to the modulation of cosmic rays. The FD amplitude generally increased with decreasing cutoff rigidity, and a strong correlation (r = 0.79) was found between cutoff rigidity and minimum GCR variation. The GCHN, which had the highest cutoff rigidity among the analyzed stations, exhibited the weakest FD amplitude, in agreement with the expected rigidity dependence of cosmic ray modulation.
Comparisons among latitude groups revealed differences in FD onset characteristics and temporal evolution. Northern high-latitude stations showed a gradual decrease prior to the IP shock arrival, whereas southern high-latitude stations remained relatively stable until the onset of the rapid main-phase decrease. The observed pattern cannot be fully explained by the specific asymptotic longitudinal zones proposed by Papailiou et al. (2012), because the stations showing similar initial-phase behavior were distributed over different longitude sectors. Instead, the north–south asymmetry may be associated with the trajectory and propagation direction of the ICME, consistent with the asymmetric cosmic ray modulation reported by Jung et al. (2023). Nevertheless, station-dependent asymptotic viewing directions and local-time effects may also have contributed to the observed differences.
Among the mid-latitude stations, GCHN exhibited an earlier and more gradual pre-decrease than the Mexico City (MXCO) and Athens (ATHN) neutron monitors. This behavior suggests that station longitude, local time, and asymptotic viewing geometry may influence the apparent onset of FD events. The unique location of GCHN in the East Asian sector therefore provides valuable observational coverage for investigating longitudinal asymmetries in cosmic ray modulation associated with interplanetary disturbances.
Overall, the observations demonstrate that GCHN reliably detected the 19 January 2026 FD event and produced results consistent with the global rigidity-dependent behavior of cosmic ray modulation. These findings indicate that the relocated Geochang neutron monitor serves as an important East Asian mid-latitude station for monitoring strong cosmic ray variations and for investigating regional, rigidity-dependent, and station-specific responses to interplanetary disturbances. Future observations of major FD events will further improve our understanding of the role of station location and viewing geometry in shaping neutron monitor responses to heliospheric disturbances.

