

1. INTRODUCTION
All-sky interferometric meteor radars, originally developed using the wide-beam antenna configuration of Jones et al. (1998), have become one of the most effective ground-based instruments for continuous monitoring of the mesosphere and lower thermosphere (MLT)-region. Their commercial implementation, the SKiYMET meteor radar, is now widely deployed, with more than 50 such radar systems operating worldwide, to detect meteor echoes between approximately 70 and 110 km altitude. These radars use an almost isotropic zenith-pointing transmitting antennas and five independent interferometric receiving antennas, enabling the detection of meteor trails from nearly all-sky directions and allowing accurate estimation of meteor drift velocities, diffusion properties, supporting both atmospheric and meteoroid studies (Hocking et al. 2001).
Over the past two decades, meteor radars have been extensively used to investigate large-scale MLT dynamics, including neutral winds, tides, planetary waves and gravity waves (e.g., Hocking 2005; Beldon et al. 2006; Kumar et al. 2007; Beldon & Mitchell 2009; John et al. 2011; Day et al. 2012; Koushik et al. 2020; Liu et al. 2020). They have also played a key role in meteoroid science, contributing to shower radiant surveys, identification of established and new showers and determination of meteoroid orbital parameters (e.g., Brown et al. 2008; Campbell-Brown & Brown 2014; Janches et al. 2015; Younger et al. 2015; Lukianova et al. 2018; Reddy et al. 2019).
Among the various meteor-radar observables, the decay time of underdense meteor echoes, which is defined as the time taken for the back-scatter signal power to fall one half of its maximum value, has proven especially valuable (McKinley 1961). Decay time has been used to estimate the ambipolar diffusion coefficient in the MLT region (e.g., Chilson et al. 1996; Cervera & Reid 2000; Ballinger et al. 2008); to infer mesospheric density levels (Younger et al. 2015); to examine the effects of geomagnetic disturbances on mesospheric density (Yi et al. 2017, 2018a, b); and to study long-term trends in atmospheric density (Clemesha & Batista 2006; Stober et al. 2012). Through the well-established relation of Mason & McDaniel (1988), the ambipolar diffusion coefficient can be used to retrieve temperature from known values of pressure (or vice versa), enabling estimates of mesospheric temperature, pressure, density and related parameters (e.g., Hocking et al. 1997; Hall et al. 2006;Holdsworth et al. 2006; Hall et al. 2012; Holmen et al. 2016). This framework has also been applied to derive electron density variations (Stober et al. 2012; Yi et al. 2018a, b) and temperature-pressure parameters (Hocking et al. 1997; Kumar & Subramanyam 2012). The temperature-gradient method of Hocking (1999) further enables temperature estimation independent of pressure assumptions.
While most of the earlier studies treat decay time as a single aggregated quantity, several investigations have shown that decay-time profiles computed separately for weak and strong echoes exhibit distinct vertical structures, especially near the mesopause (Singer et al. 2008; Younger et al. 2008; Lee et al. 2013; Reddy 2026). For example, Ballinger et al. (2008) demonstrated that processes other than ambipolar diffusion can significantly influence trail decay at high latitudes. Singer et al. (2008) reported systematic differences between weak and strong-echo decay times at low and high latitudes, except during high-latitude summer, likely due to the presence of larger ice particles associated with noctilucent clouds (NLCs). Premkumar et al. (2019) further showed that the turning altitude of decay-time profiles differs between weak and strong echoes by up to ~2 km, with a clear latitude dependence. Reddy (2026) reported on seasonal dependence of turning altitude between weak and strong echoes, which is about 2–5 km. These findings highlight the importance of distinguishing weak and strong echoes when interpreting decay-time variability.
Despite the availability of identical meteor radars at conjugate polar latitudes for more than two decades, most previous work has focused on inter-hemispheric differences in winds, tides, and wave activity. Such analyses are crucial for understanding hemispheric differences in background atmospheric structure, seasonal variability, and meteoroid ablation processes. In this study, we investigate the long-term seasonal behavior of meteor decay-time and its derived parameters using two identical SKiYMET radars located at Esrange (68°N, 21°E) and Rothera (68°S, 68°W). Their identical design and symmetric placement at conjugate latitudes ensure that the results are directly comparable, providing a robust basis for assessing inter-hemispheric differences. This enables a like-for-like evaluation of decay-time variability, weak- and strong-echo characteristics, and the underlying MLT dynamics in the Arctic and Antarctic regions.
2. METEOR RADAR SYSTEMS AND DATA
This study employs archival data accessed from two identical all-sky SKiYMET meteor radars located at opposite polar latitudes, Esrange (68°N, 21°E) in the Arctic and Rothera (68°S, 68°W) in the Antarctic. Both the radar systems operate at 32.5 MHz frequency and use a transmitter with a peak power of 6 kW, and a duty cycle of 15%. The transmitted pulse has a pulse repetition frequency (PRF) of 2,144 Hz, and a pulse length of 13.3 μs that gives a nominal range resolution of 2 km. Each radar is equipped with a three-element crossed-dipole Yagi transmitting antenna providing an all-sky illumination pattern, along with an interferometric receiving array comprising five two-element crossed-dipole Yagi antennas. The angle of arrival of meteor echoes is retrieved from the phase differences between antenna pairs, enabling unambiguous determination of the echo location (Jones et al. 1998). The data acquisition system excludes overdense and other non-meteor ionospheric echoes, ensuring that only underdense meteor trails with duration shorter than 2 sec are recorded. A comprehensive technical description of the SKiYMET radar and associated meteor detection procedure can be found in Hocking et al. (2001).
The datasets analysed in this study are publicly available through the CEDA repository (https://data.ceda.ac.uk/badc/meteor-radars) and offer near-continuous temporal coverage from 2005 onward for both Esrange and Rothera. Although the two radars are identical in design, their daily meteor detection rates are differ: the Esrange radar typically records about 12,000–18,000 echoes per day, while the Rothera radar records approximately 10,000–20,000 echoes per day. For the present analysis, only unambiguous echoes with zenith angles between 10° and 60° were used in order to improve data reliability and to minimise uncertainties in the determination of trail heights. In addition, a signal-to-noise ratio (SNR) criteria was applied at all heights to ensure robust echo detection. The echoes with 5 dB < SNR ≤ 15 dB were classified as weak echoes, while those with SNR > 15 dB were classified as strong echoes, following the established practice (Ballinger et al. 2008; Kim et al. 2010; Premkumar et al. 2019).
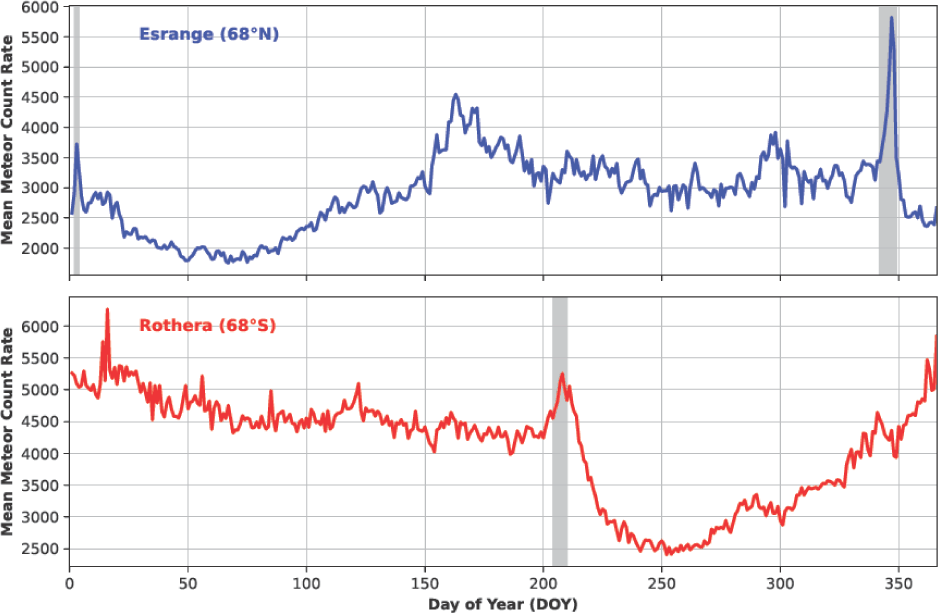
Meteor count rates used in the subsequent analysis are composite daily mean values derived after applying the above selection criteria. The composite year was constructed by grouping all valid detections by day of year (DOY) and stacking them to obtain a climatological mean. Prior to compositing, standard quality-control procedures were applied, including outlier removal, consistent height and zenith-angle filtering, and exclusion of periods affected by radar maintenance or insufficient data coverage. The analysis was restricted to the 85–95 km altitude range, where ambipolar diffusion dominates meteor-trail decay (Ballinger et al. 2008). After quality control and compositing, the daily mean count rates range from ~2,000 to 6,000 at Esrange and ~2,500 to 6,000 at Rothera (Fig. 1). Differences between the two otherwise identical radars are attributed to site-dependent factors such as radio-frequency interference, minor system-performance variations, and differences in the detectability of sporadic meteor radiant sources.
3. ANALYSIS AND RESULTS
Fig. 1 presents the long-term comparison of the seasonal variability in mean meteor count rates recorded by two identical meteor radars located at conjugate polar latitudes, Esrange (68°N) and Rothera (68°S). The count rate shown in Fig. 1 are composite daily mean meteor count, after applying data selection criteria. The datasets comprise more than 17 years observations at Esrange (2005 to 2022) and 20 years of observations at Rothera from 2005 to 2024. Both stations exhibit well-defined annual cycles, with clear minima during local winter and maxima during local summer. Despite these seasonal similarities, the phase of the seasonal progression differs between hemispheres: Esrange shows increasing activity toward mid-year, whereas Rothera displays enhanced counts toward the end of the year. This hemispheric opposition likely reflects differences in the seasonal distribution of sporadic radiant sources (Szasz et al. 2005), annual variations in atmospheric density (Younger et al. 2009), and radar sensitivity.
Superimposed on the background annual cycle are short-lived enhancements associated with major meteor showers. Distinct peaks corresponding to the Quadrantids in early January and the Geminids in mid-December are clearly evident at Esrange, while a pronounced enhancement associated with the South Delta Aquarids in late July appears at Rothera. The identified meteor showers are marked by grey vertical bars in Fig. 1. As shown in the figure, the days of enhanced ionisation associated with these shower events coincide well with the peak activity periods of the corresponding annual meteor showers reported in the literature (Jenniskens et al. 2016). Several weaker but established showers are also present, although their signatures are more subtle in the long-term averages. In addition to the seasonal pattern, both datasets exhibit substantial inter-annual variability, with maximum-to-minimum count-rate ratios of approximately 2.5 at Esrange and 2.2 at Rothera, indicating significant year-to-year changes in meteor influx and/or detection conditions.
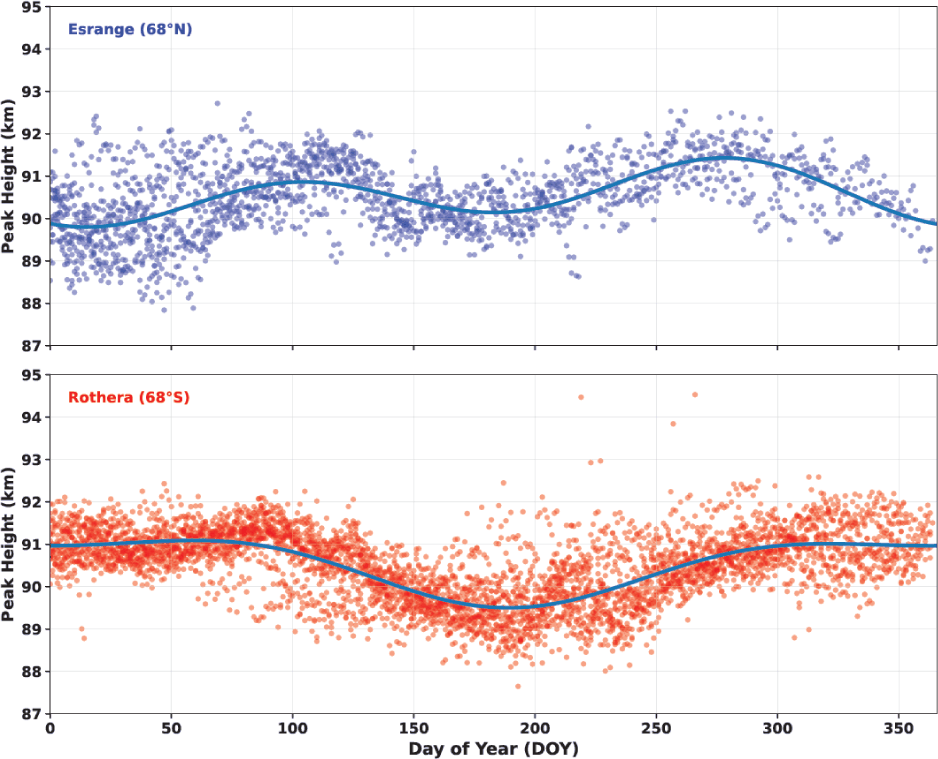
Fig. 2 illustrates the seasonal variation of peak occurrence heights at Esrange (top panel) and Rothera (bottom panel), along with their annual and semiannual harmonic fits. At Esrange, the peak height vary within a relatively narrow range (~88–92 km) and exhibits only modest seasonal modulation. The harmonic fit indicates a weak annual cycle, characterized by a broad minimum around DOY 150–180 (June–July) and gradual increases towards spring–autumn. In contrast, Rothera displays a substantially larger seasonal amplitude, with peak heights spanning between ~88–92 km with some outliers around 93–94 km and displaying sharper, more asymmetric maxima during austral summer, in similar with earlier studies (Dawkins et al. 2024). The semiannual harmonic component is notably stronger in the Southern Hemisphere, producing secondary maxima and increasing overall variability. The consistently higher summer peak heights and broader seasonal range at Rothera suggest a more pronounced seasonal restructuring of the meteor ablation region. Together with the long-term count-rate patterns, these results indicate that meteor-trail formation altitudes respond differently in the two hemispheres, reflecting fundamental asymmetries in MLT dynamics.
Mesopause temperature was derived from meteor trail decay times using the classical ambipolar diffusion approach applied to underdense, specular echo. For each detected echo, the exponential decay time (τ) of the signal power was estimated from the received amplitude. Assuming that the decay is primarily controlled by ambipolar diffusion, then the diffusion coefficient Da was obtained from τ = λ2/16π2 Da, where λ is the radar wavelength. The ambipolar diffusion coefficient is related to the neutral atmospheric temperature (T) and pressure (P) through the proportionality Da∝T2/P. Since pressure is not directly measured by meteor radars, this method generally requires the adoption of an empirical pressure model and, in many cases, calibration using independent temperature measurements obtained from other techniques such as lidar or satellite observations (e.g., Chilson et al. 1996; Hocking et al. 1997; Hall et al. 2006; Holdsworth et al. 2006; Dyrland et al. 2010). An alternative technique was proposed by Hocking (1999), in which temperature is inferred from the vertical gradient of log10Da as a function of height. This method removes the explicit dependence on pressure but requires the specification of a realistic vertical temperature gradient (dT/dz), typically obtained from climatological models or independent observations. Neutral temperatures in the MLT region were estimated using the meteor trail decay-time (ambipolar diffusion) method, which is the standard approach for meteor radar observations. In the present study, temperature estimates were obtained from individual meteor echoes after applying quality control criteria on SNR, decay-time fitting uncertainty, and echo geometry. Daily mean temperatures were calculated by averaging the valid temperature estimates within a narrow altitude interval centred near 90 km. Composite-year temperatures were then constructed by grouping the daily means according to DOY in order to examine the seasonal behaviour.
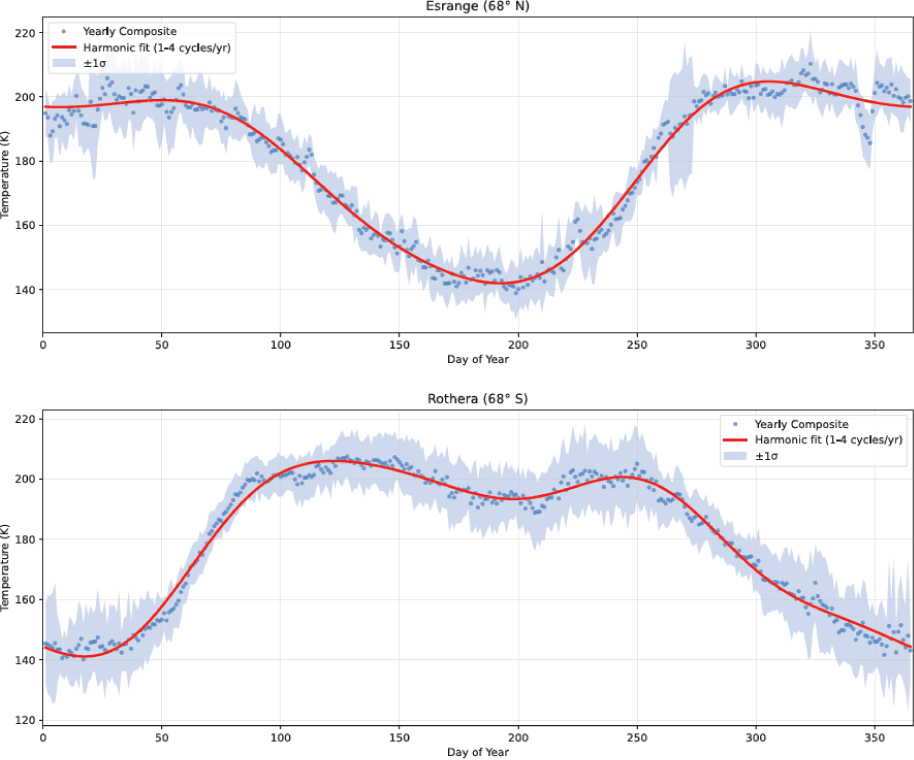
Seasonal temperature behavior is more clearly examined using a composite-year approach, in which daily values from all available years at each site are superimposed to form a representative annual cycle. Fig. 3 presents the composite mesopause temperatures derived from the two radars, along with their corresponding yearly standard deviations (gray shading) and harmonic fits (red curves). The harmonic analysis incorporates annual (AO), semiannual (SAO), and quarter-annual (QAO) components, which together describe the primary sources of variability at both radar stations. Here, we can also notice a sudden under estimation of temperature of several orders of magnitude at Esrange (68°N), corresponds to shower activity period of the Geminid meteoroids. Such underestimation of temperature was due to unusual properties (e.g., mass, speed, or chemical composition) of Geminids, which are believed to be asteroidal origin (Kozlovsky et al. 2016).
To further quantify the dominant periodicities, the temperature time series were subjected to Lomb-Scargle spectral analysis (Scargle 1982). The resulting periodograms, shown in Fig. 4, reveal prominent spectral peaks corresponding to the AO and SAO at both stations. A weaker, but discernible, QAO signal is also present. Additional peaks near DOY 182 and 179 appear in both datasets and may be associated with intra-seasonal oscillations or secondary modulations of the SAO. Similar periodicities in temperature were also noticed by Lima et al. (2018) from two Brazilian low latitude stations in southern hemisphere. Together, the composite temperature profiles and spectral analysis highlight the strong seasonal structure of the mesopause region and demonstrate the consistency of dominant periodicities across conjugate hemispheric sites.
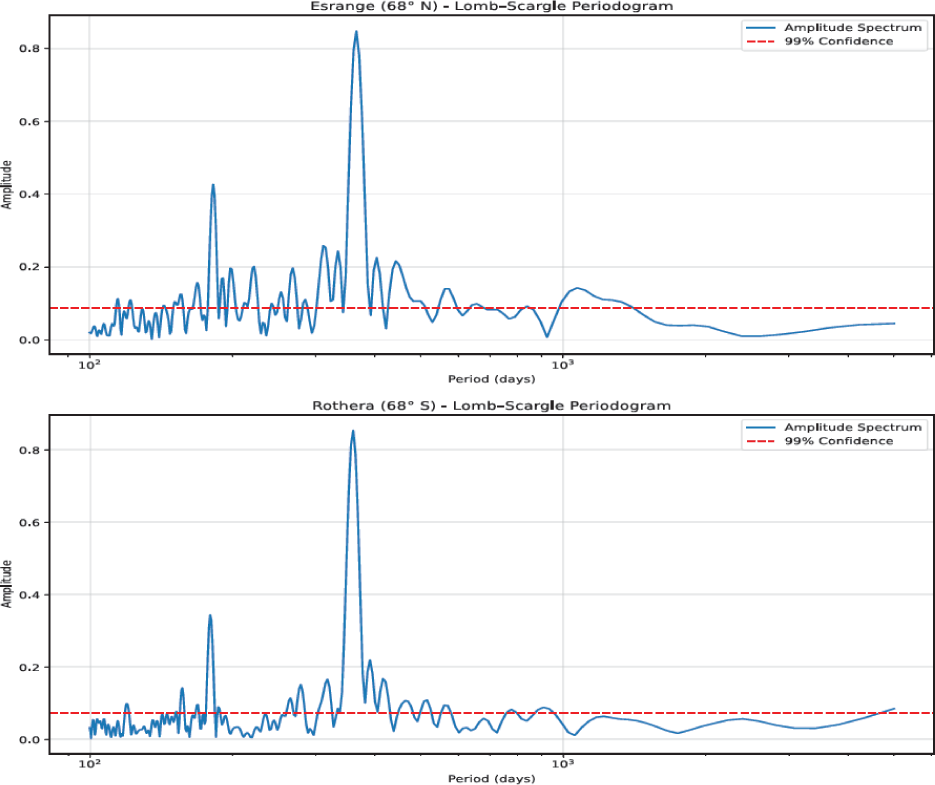
At high latitudes, the SAO is generally weaker and more variable than the AO and is influenced primarily by dynamical processes rather than direct solar forcing. In particular, hemispheric differences in gravity-wave filtering, planetary-wave activity, and background circulation can contribute to variability in SAO amplitude. However, several studies (e.g., Lee et al. 2021; Song et al. 2023; Kam et al. 2024) have shown that the relative dominance of SAO and AO is strongly altitude dependent, with SAO amplitudes often becoming comparable to or exceeding AO above ~90 km. In the present study, the harmonic analysis (Fig. 4) confirms the presence of both AO and SAO components; however, the derived temperatures represent a layer-averaged signal from meteor echoes spanning a finite altitude range in the MLT region. Consequently, the observed oscillation pattern reflects a vertically integrated response in which altitude-dependent contributions are superposed. While SAO may be enhanced at higher altitudes and AO dominates at lower levels, their combined effect can produce an apparent increase of SAO in the layer-mean signal. Therefore, any apparent dominance of SAO over AO in the Northern Hemisphere should be interpreted as a consequence of vertical integration rather than a systematic hemispheric characteristic. Accordingly, no firm conclusion regarding hemispheric asymmetry in SAO strength is implied here.
To investigate the seasonal and vertical behaviour of decay time, we computed the plotted height of peak occurrence, height of maximum decay time and maximum decay times profiles which were computed for each season as shown in Fig. 5, separately for weak and strong echoes. Based on received echo power, following the approach of Younger et al. (2008); Premkumar et al. (2019) and Reddy (2026), the total dataset was partitioned into two groups as strong and weak, using 1-km height bins. Strong echoes correspond to the upper 25% of received echo power, while weak echoes correspond to the lower 25%. Such categorization of echoes based on upper and lower quartiles of received signal power may introduce seasonal and height dependent biases. To minimize such biases, classification was applied independently for each season and for every one-kilometer height bin at each site. At Esrange (68°N), summer, autumn, winter, and spring were defined as May-July, August-October, November-January, and February-April, respectively. At Rothera (68°S), the seasons are summer in November-January, autumn in February-April, winter in May-July, and spring in August-October. We have chosen seasons so as the equinoxes and the solstices are in middle of three-months window. For direct inter-hemispheric comparison, the Rothera decay-time profiles were phase-shifted by six months.
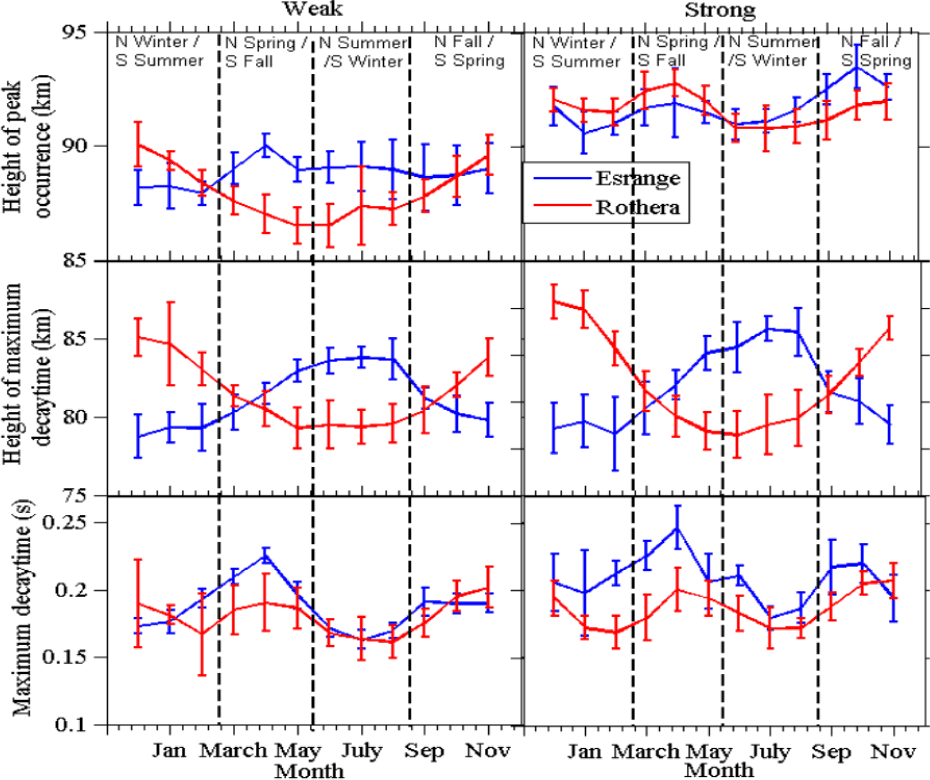
The seasonal variation in the height of peak occurrence for weak and strong echoes is presented in the upper panel of Fig. 5. From the figure, we can identify a clear difference between the peak occurrence height of weak and strong echoes throughout the seasons. For weak echoes, Esrange exhibits relatively small seasonal changes, with peak heights largely confined to 88–90 km. In contrast, Rothera shows a more pronounced seasonal modulation, with a clear minimum of ~87 km during June-July and a recovery to ~90 km during January and November. Strong echoes occur at systematically higher altitudes at both latitudes, typically between 91 and 93 km, and show markedly reduced seasonal variability compared to weak echoes. Esrange consistently reports slightly higher peak heights than Rothera, and both stations exhibit a modest mid-year minimum. These differences point to hemispheric asymmetries in the background MLT structure, particularly for weak meteor trails.
Seasonal changes in the height of maximum decay time are shown in the middle panel of Fig. 5. For weak echoes, Esrange displays a gradual rise from ~79 km in January to ~83–84 km in early boreal summer, followed by a decline toward autumn. Rothera exhibits an opposing seasonal phase, with the height decreasing to ~79–80 km in June-July and increasing to ~84–85 km during January. This hemispheric anti-correlation suggests a strong influence of seasonal changes in mesospheric temperature, neutral density, and turbulent diffusion on trail persistence (Younger et al. 2008). For strong echoes, both stations show enhanced seasonal structure, with Esrange exhibiting a clear maximum during July-August and Rothera showing a pronounced minimum during June-July. These patterns highlight the sensitivity of decay-time-related parameters to seasonal dynamical variability within the MLT-region.
The seasonal variation of mean meteor decay time is shown in the lower panel of Fig. 5. At both stations, mean decay times remain lie within 0.08–0.15 sec and exhibit only weak seasonal modulation. Weak echoes consistently show slightly longer maximum decay times at Rothera than at Esrange, although the overall amplitude of seasonal variation remains small. In contrast, strong echoes display nearly identical mean decay times at the two stations throughout the year, indicating that strong meteor trails are comparatively insensitive to seasonal changes in mesospheric conditions (Kim et al. 2010). The close agreement between conjugate latitudes likely reflects hemispherically symmetric background atmospheric conditions as well as the identical radar configurations and comparable transmitting power. Seasonal density variations also influence the detection height, with mean meteor heights at polar latitudes reported to be ~3 km lower in winter than in summer (Younger et al. 2008). The relatively large standard deviations in both weak and strong echo categories reflect the inherent variability of meteor trail diffusion and ion–neutral collision processes.
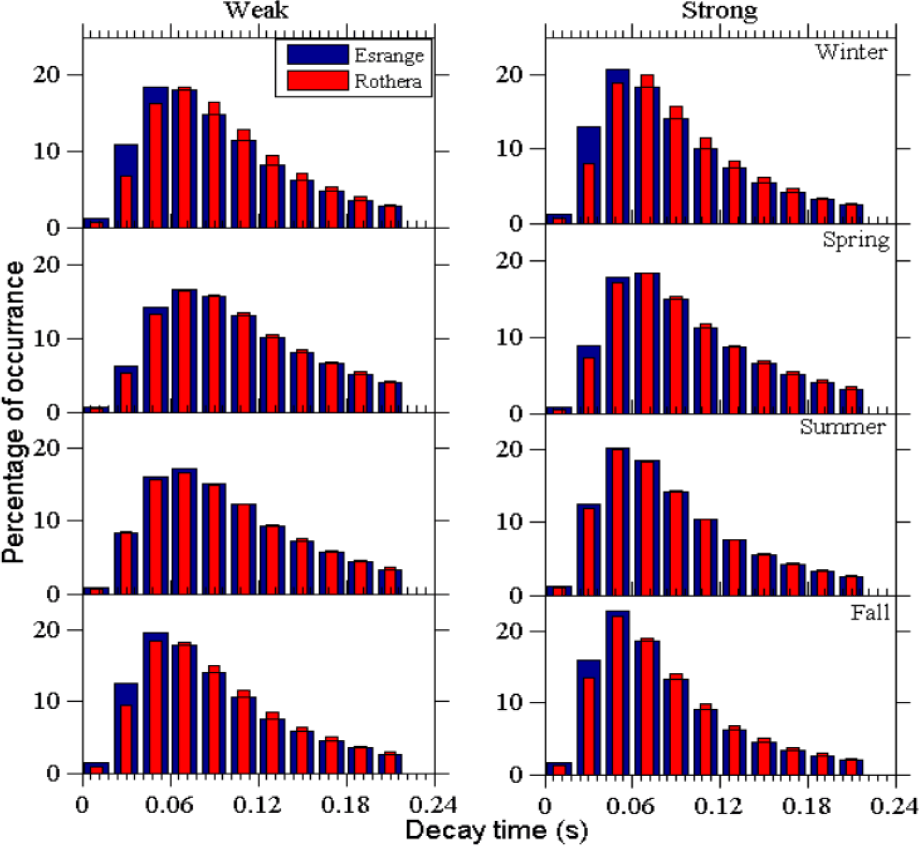
Furthermore, seasonal variations in the percentage occurrence of decay times for weak and strong echoes are shown in Fig. 6. The decay-time occurrence exhibits a largely symmetric pattern between the two hemispheres, with only minor differences during the winter–fall transition, particularly for short-lived echoes. Seasonally resolved decay-time distributions at Esrange and Rothera show consistent behavior across conjugate hemispheres. In winter, both radars record narrowly peaked distributions centered near 0.05–0.06 sec, with Esrange showing a slightly higher occurrence of short-lived trails, consistent with enhanced diffusion under cold, dense mesopause conditions. During spring, the distributions broaden and shift toward longer decay times (~0.07–0.08 sec), reflecting reduced atmospheric density and increased trail persistence. Summer exhibits the longest and broadest decay times for both weak and strong echoes, with peaks near 0.08–0.09 sec and extended tails beyond 0.15 sec, particularly at Rothera, consistent with elevated temperatures and reduced ambipolar diffusion. In fall, the distributions narrow again and shift back toward 0.06–0.07 sec, marking the transition toward winter conditions. Overall, the strong correspondence between the two polar stations across all seasons indicates that meteor trail diffusion and ionization decay respond similarly in hemispherically opposite but dynamically analogous mesopause environments.
4. DISCUSSION
Using long-term observations from two identical meteor radars at conjugate polar latitudes, this study investigates inter-hemispheric similarities and differences in meteor decay time and related parameters. The results show a strong hemispheric symmetry in the seasonal evolution of meteor activity (Fig. 1), alongside clear hemispheric differences in vertical structure and seasonal amplitude of decay-time-derived parameters (Figs. 2–6), indicating asymmetries in polar MLT dynamics.
The composite meteor count rates at Esrange (68°N) and Rothera (68°S) exhibit pronounced annual cycles with summer maxima and winter minima that are phase-opposed between hemispheres (Fig. 1). This behavior is consistent with seasonal variations in atmospheric density (Younger et al. 2008) and hemispheric differences in sporadic meteor radiant geometry (Szasz et al. 2005). Although meteor shower signatures are present, they remain superimposed on the dominant seasonal background (Lukianova et al. 2018). In contrast, the peak meteor occurrence height displays a markedly different seasonal response between hemispheres (Fig. 2). Rothera shows a larger seasonal range and a stronger semiannual component than Esrange, with systematically higher summer peak heights, indicating enhanced seasonal restructuring of the Antarctic MLT.
Mesopause temperatures derived from decay-time parameters exhibit a clear hemispheric phase reversal, with summer maxima and winter minima occurring six months apart (Fig. 3). The larger seasonal temperature amplitude at Rothera is consistent with the enhanced variability observed in peak meteor heights, supporting the internal consistency of the decay-time-derived diagnostics. Lomb-Scargle spectral analysis (Fig. 4) shows that the AO and SAO’s dominate temperature variability at both sites, with weaker QAO components contributing secondary modulation. These common periodicities suggest similar dominant forcing timescales in both hemispheres, while the differing amplitudes reflect hemispheric contrasts in seasonal modulation strength. The AO at high latitudes is primarily driven by seasonal changes in solar forcing and meridional circulation and exhibits a robust hemispheric phase reversal. In contrast, the SAO is weaker and more variable, arising mainly from dynamical processes such as gravity-wave and planetary-wave modulation that are maximized near equinoxes. Differences in wave activity and background circulation between hemispheres can therefore lead to asymmetries in the observed SAO strength, as commonly reported in previous high-latitude meteor radar studies (e.g., Lee et al. 2021; Song et al. 2023; Kam et al. 2024).
A key result is the contrasting behavior of weak and strong meteor echoes (Fig. 5). Strong echoes occur at higher altitudes and exhibit relatively small seasonal variability in both peak occurrence height and mean decay time at both sites, consistent with decay dominated by ambipolar diffusion under comparable background conditions. Weak echoes, by contrast, show stronger seasonal variability and a clear hemispheric phase opposition in the height of maximum decay time. This enhanced sensitivity reflects their formation at lower altitudes, where ion-neutral collisions and background density gradients exert greater influence. Seasonal decay-time distributions (Fig. 6) further support this interpretation. Both stations show broader distributions and longer decay times during summer, particularly for weak echoes at Rothera, while winter distributions are narrower and centered at shorter lifetimes. The close similarity of winter distributions between hemispheres indicates convergence toward comparable polar winter MLT conditions, despite larger hemispheric differences during summer. Overall, these results demonstrate that decay-time-derived parameters, especially when analyzed in a height- and power-resolved framework, provide a sensitive diagnostic of hemispheric asymmetry in the polar MLT. Separating weak and strong echoes is essential, as analyses based solely on aggregated decay-time statistics may underestimate systematic hemispheric differences in mesospheric structure and seasonal variability.
The seasonal behavior of weak echoes is mainly controlled by enhanced electron–neutral collision losses, whereas the phase reversal observed for strong echoes reflects a different decay regime. Strong echoes, typically occurring near the underdense–overdense transition with high electron line densities, decay predominantly through ambipolar diffusion rather than collisional loss. In summer, higher neutral densities reduce the ambipolar diffusion coefficient and prolong decay times, while faster diffusion in winter leads to more rapid dissipation. As a result, strong echoes exhibit a seasonal phase opposite to that of weak echoes, arising from fundamentally different dominant physical processes.
5. CONCLUSIONS
This study examines inter-hemispheric differences in meteor decay time and decay-time-derived atmospheric parameters using long-term observations from two identical SKiYMET meteor radars at conjugate polar latitudes, Esrange (68°N) and Rothera (68°S). Both sites exhibit pronounced seasonal cycles and broadly similar decay-time distributions, indicating comparable large-scale MLT structure. In contrast, the Southern Hemisphere shows larger seasonal amplitudes in peak meteor occurrence height and mesopause temperature, pointing to stronger seasonal restructuring. Weak meteor echoes display clear hemispheric phase differences in the height of maximum decay time, reflecting enhanced sensitivity to seasonal variations in temperature and neutral density, whereas strong echoes remain relatively stable. These findings demonstrate that meteor decay-time parameters provide a robust diagnostic of hemispheric asymmetries in polar MLT dynamics.

