

1. INTRODUCTION
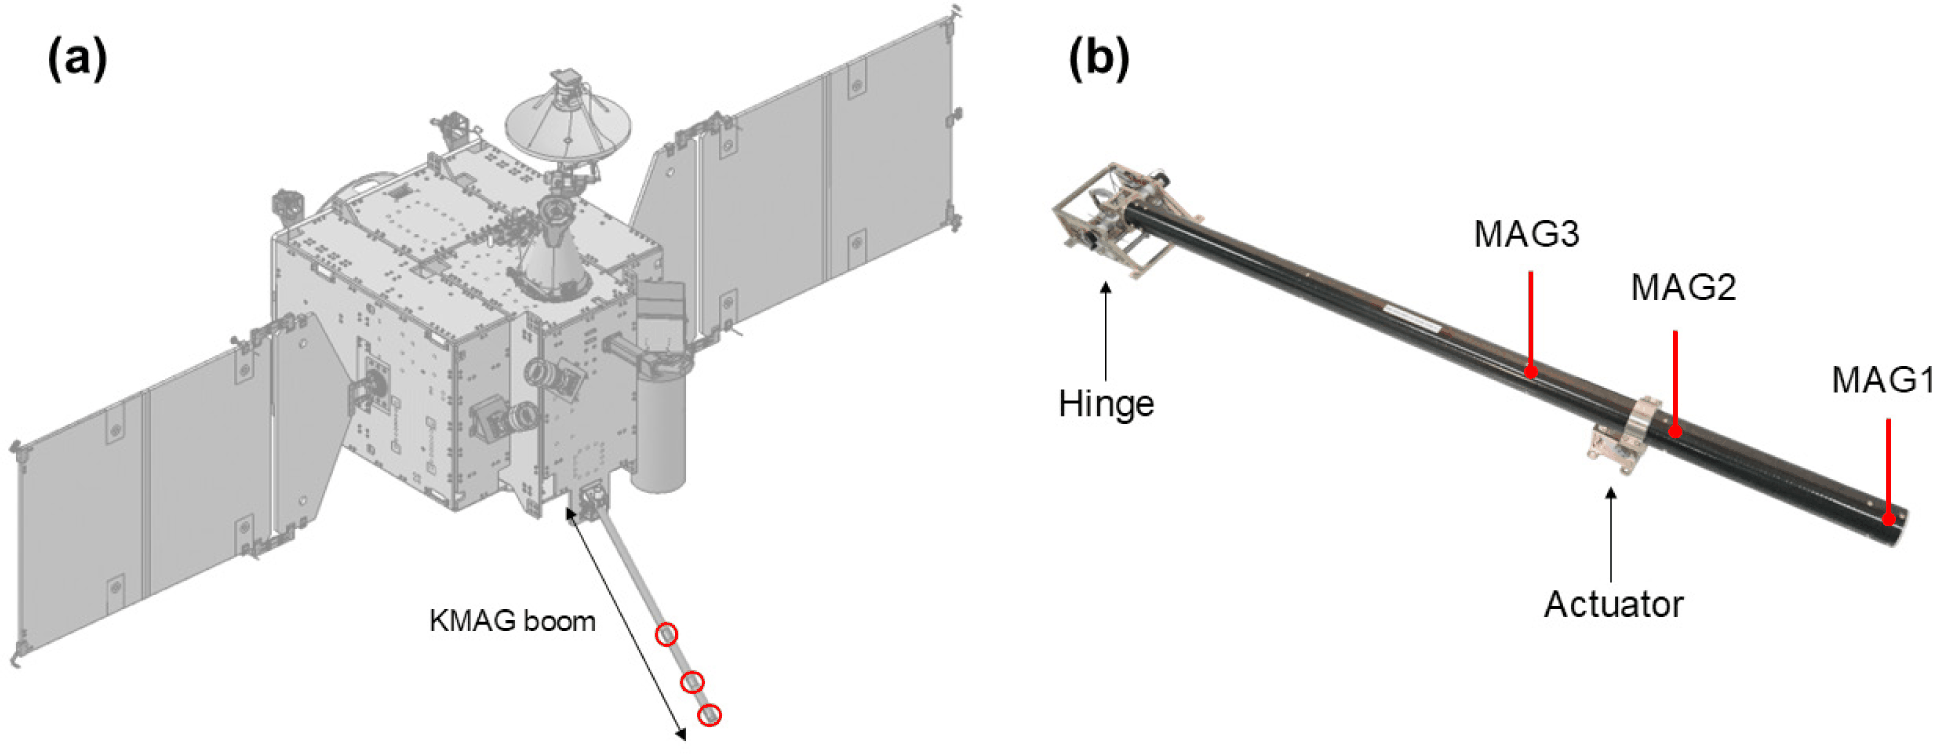
The Korea Pathfinder Lunar Orbiter (KPLO), launched on August 4, 2022, has been operating in a lunar orbit for about three years, exceeding its originally planned mission phase of one year. The KPLO magnetometer (KMAG) is one of the scientific payloads of the KPLO. The major scientific objectives are magnetic investigations of lunar surface magnetic anomalies and lunar interior structures, including the lunar space environment (Jo et al. 2023). KMAG consists of a magnetometer (MAG) unit with three triaxial racetrack-shaped fluxgate magnetometers (FGMs) along a 1.2-meter-long boom and a Fluxgate magnetometer Control Electronics (FCE) unit that controls the KMAG system with four electrical boards (Son 2012; Lee et al. 2021).
Magnetometers are one of the key instruments in space missions, and fluxgate sensors are widely used in space-borne magnetometers. Therefore, calibration methods based on sensor characteristics and mission environments are important. For example, calibration based on the CHAOS-7 geomagnetic field model was proposed for the FGMs of low Earth orbit satellites. (Song et al. 2021). For the Juno mission, spacecraft spin and a strong Jovian magnetic field generate magnetic disturbances induced by Eddy currents, and the matrix-based calibration method removes this distribution (Kotsiaros et al. 2020). For the Lunar exploration mission Kaguya, zero-offset determination and sensor alignment calibration were conducted (Takahashi et al. 2009). Applying appropriate calibration procedures suitable for each mission and magnetometer is essential for achieving mission objectives and utilizing the data.
To utilize magnetometer observations for scientific research, it is essential to process the data from raw to calibrated form. To obtain accurate observation results, both ground-based calibration conducted before launch and in-orbit calibration performed during the mission phase are carried out for all magnetometers used in the space exploration mission. Ground calibration alone could not fully account for all the noise or interference sources arising during the mission phase, such as temperature variations, changes in sensor gain and offsets, alignment errors, and magnetic interference from the spacecraft. Therefore, in-orbit calibration that considers the actual mission environment is required to obtain better calibration results.
In-orbit calibration of an FGM requires careful consideration of temperature-dependent variations because the performance of fluxgate sensors can be affected by changes in sensor temperature. Sensor temperature variations cause a change in the geometry of the sensor, generally the thermal expansion of the windings (Acuña et al. 1978; Miles et al. 2017), and this eventually adds temperature-dependent effect to the measurements.
Previous studies on in-orbit calibration of magnetometers have reported that FGM calibration parameters and magnetic field observations drift with temperature changes (Loto’aniu et al. 2019; Zhou et al. 2019; Greene et al. 2023; Tong et al. 2023). Several previous missions identified this relationship and included the temperature dependence in the in-orbit calibration procedures. For example, it was shown that incorporating the temperature effect into the calibration model for CryoSat-2 mission further decreased the root mean square (RMS) of the residuals between the observed field and the reference field (Olsen et al. 2020). For the Cluster mission, the calibrated long-term offsets of the certain outboard FGMs exhibited cyclical trends, indicating a correlation between the sensor temperature cycles, which were related to the spacecraft position relative to sunlight (Alconcel et al. 2014). Through on-orbit analysis of the GOES-16 spacecraft MAG sensor, variations in offsets were larger than expected, which was possibly due to the thermal instability which was not sufficiently addressed in ground calibration (Loto’aniu et al. 2019). In the case of the China Seismo-Electromagnetic Satellite (CSES), linear calibration parameters, particularly the non-orthogonal angles of FGMs, periodically changed with temperature, and this trend was eliminated by applying a polynomial model as a function of space thermal conditions (Tong et al. 2023). These studies demonstrate that in-orbit calibration that considers sensor temperature changes is essential because temperature variations are related to changes in calibration parameters. Such effects are common, but critical to data quality.
We established an in-orbit data-processing pipeline using KMAG data from the initial operation phase, which has been applied to the calibration data acquired after KPLO entered the lunar orbit (Jo et al. 2023). Currently, we generate research-grade data using a calibration method based on the wavelet transform, which removes periodic peak-to-peak interference signals corresponding to the continuous orbital motion around the dayside and nightside of the Moon (Hoffmann et al. 2025). Due to the short boom length of 1.2 meters, multiple noise sources are mixed in the uncalibrated KMAG data, making it difficult to categorize each noise factor. Therefore, a calibration method that handles multiple signals in the wavelet domain was selected.
However, during a specific period, residual magnetic interferences are not fully eliminated even after the full calibration process. Therefore, it is difficult to distinguish between the lunar magnetic field and noise below 1 nT small-amplitude signals of interest in scientific studies. Therefore, it is necessary to develop a method to address this issue. We investigated multiple in-orbit temperature calibration methods based on the thermal characteristics of the fluxgate sensor, focusing on sensor temperature variations caused by periodic lunar orbital passages during which KPLO traverses the lunar dayside and nightside of the moon. We take a different approach to in-orbit temperature calibration from the calibration method based on the magnetic gradiometry in the wavelet domain. Our approach directly utilizes the relationship between the measured field and the sensor temperature, thereby reducing the residuals that are believed to be related to temperature variations.
In this study, we propose three methods for in-orbit temperature calibration and apply the most accurate method across several dates to evaluate its effectiveness. By comparing the calibration results with the magnetic field measurements from ARTEMIS-P1 as a reference, we confirmed that the method based on the long-term relationship between the KMAG data and sensor temperature is effective for temperature calibration. In Section 2, we present an overview of the in-orbit calibration techniques we currently employ. Sections 3 and 4 introduce the temperature calibration methods and initial results obtained by applying the best method to several cases. Discussions and future works are presented in Section 5.
2. IN-ORBIT CALIBRATION
KMAG has three racetrack-shaped core FGMs: MAG1, MAG2, and MAG3 (Fig. 1). Lee et al. (2021) described the instrument specifications of the KMAG, including measurable range, resolution, noise level, and operational temperature. As in previous lunar missions, the primary sensor, MAG1, is located at the end of the boom, followed by MAG2 and MAG3 (Lee et al. 2021). To minimize the magnetic disturbance generated by the spacecraft, previous magnetometer instruments for lunar exploration missions were designed with long boom structures. For example, Kaguya and Lunar Prospector (LP) adopted a 12 m and 3.6 m boom, respectively (Binder 1998; Kato et al. 2010). If the boom is not sufficiently long, adopting a multi-sensing technique can compensate for this limitation. This approach has been applied to the Service-Oriented Spacecraft Magnetometer (SOSMAG) with a 1.0 m boom (Magnes et al. 2020), as well as to the KMAG. Therefore, in the case of the KMAG instrument, three MAGs are used for interference corrections using the measurements retrieved from each sensor.
Before launch, we performed ground calibration, and the remaining elements were calibrated through in-orbit calibration during the mission phase. Sensor offset determination, coordinate transformation, and spacecraft-generated field elimination described in Fig. 2 were performed through in-orbit calibration processes.
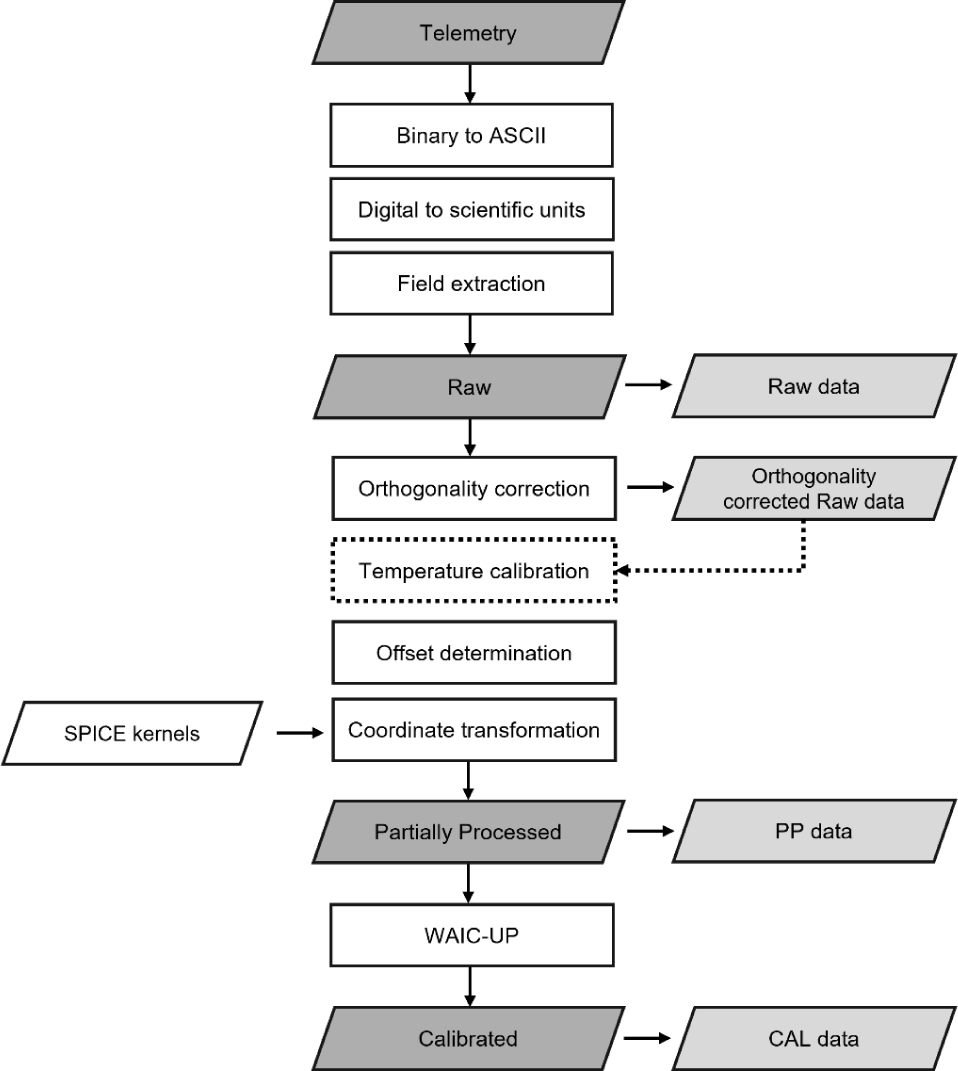
We found the offset in the initial KMAG measurements which was thought to be caused by magnetization effects and change in the operational environment. Therefore, we initially applied the Davis-Smith (D-S) method (Belcher 1973) over every 8-hour block to determine offsets individually for each of the three sensors (Jo et al. 2023). However, this method is effective when the spacecraft is within the solar wind with Alfvénic perturbations and becomes less accurate after KPLO entered the lunar orbit. Currently, we determine the offset by referring to ARTEMIS-P1 and ARTEMIS-P2 FGM data. The ARTEMIS-P1/P2 have been operating in highly elliptical lunar orbits and have become useful references for KPLO (Jo et al. 2023).
Coordinate transformation is necessary to interpret KMAG measurements in a physically meaningful context. The data must be transformed into an appropriate scientific coordinate system relevant to the target scientific objectives, such as cis-lunar space and the Moon. We convert the offset-corrected data from the sensor coordinate system into four coordinate systems used in space and planetary sciences: geocentric solar ecliptic (GSE), geocentric solar magnetospheric (GSM), selenocentric solar ecliptic (SSE), and selenographic (SEL). We use a transformation matrix and SPICE kernels for this process (Jo et al. 2023).
The final calibration step for the end-user data product is the elimination of spacecraft-generated fields. In this step, the Wavelet-Adaptive Interference Cancellation for Underdetermined Platforms (WAIC-UP) algorithm removes noise by applying a wavelet transform under the assumption that the interfering magnetic fields included in the KMAG data exhibit different spectral characteristics. This method mitigates multi-source stray magnetic fields while accounting for the short boom length of the KMAG instrument (Hoffmann et al. 2025).
3. TEMPERATURE CALIBRATION
We conducted several ground tests before launch, one of which was a thermal offset test for the KMAG flight model inside the shielding chamber with a single halogen lamp as the heating source. The result of this test showed that the temperature coefficients for the x, y, and z axes of MAG1 were 0.15 nT/°C, –0.15 nT/°C, and –0.18 nT/°C, respectively, which were close to the theoretical temperature coefficient of 0.2 nT/°C (Lee et al. 2021; Jang 2022).
However, different distances between the halogen lamp and each sensor resulted in different temperature ranges (Jang 2022). Moreover, MAG2 was selected as the reference sensor because it was closest to the lamp. In contrast, the in-orbit measurement data of MAG2 are more susceptible to spacecraft-related interference during operation because it is structurally more affected by the actuator. After entering lunar orbit, the thermal condition of the KMAG varies compared with that in the ground test, and other noise components not found in the test can be included depending on the state of the KPLO. Therefore, the test results and in-orbit data should be cross-checked to ensure that the ground test coefficients are applicable to the in-orbit calibration.
Fig. 3 shows orthogonality corrected raw magnetic field data and sensor temperature measured immediately after the reactivation of KMAG on March 14, 2025, which was performed as a part of the KPLO total lunar eclipse survival operations (Jeon et al. 2026). From 12:00 to 13:00 UT, temperature increased by over 10°C, and MAG1-X showed a drift of almost 40 nT. Drifts of 15 nT were observed in MAG1-Y and MAG1-Z. Similar fluctuations were observed for MAG2 and MAG3. In the case of MAG2-Z, extremely small values were measured which were thought to result from measurement errors associated with the prolonged operation of the KMAG. If this magnetic field variation was due to the temperature effect, it would be much larger than the expected maximum value of 2 nT according to the ground test.
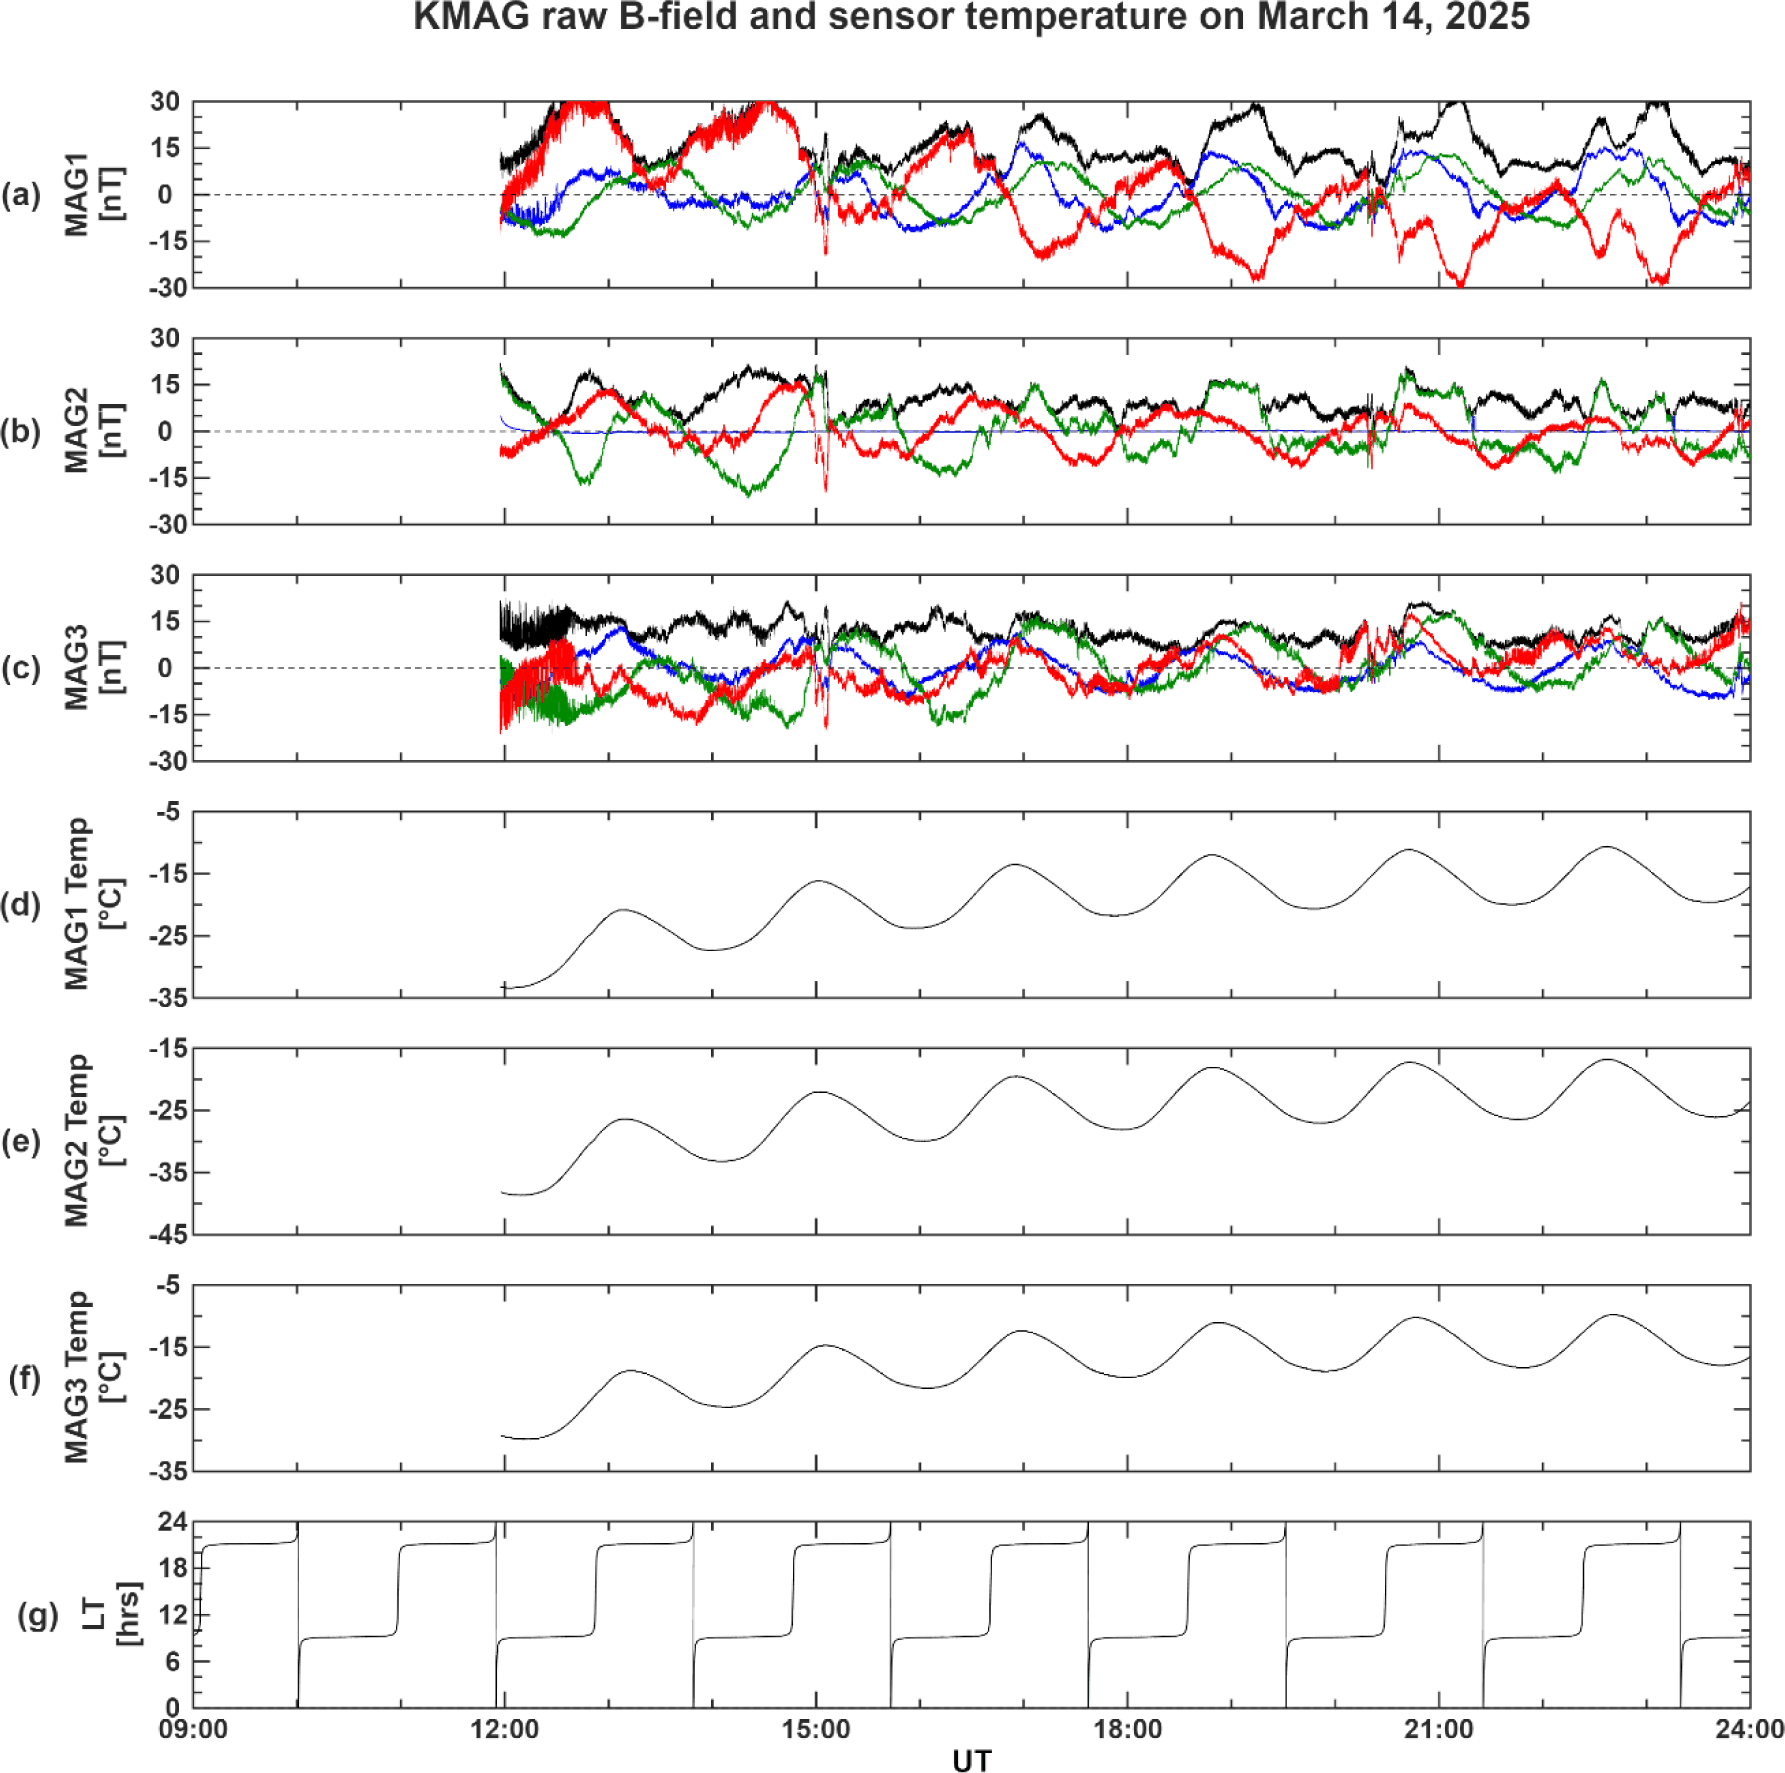
However, this drift observed in the uncalibrated data may result from multiple sources. In this study, we assumed that this drift was due to the temperature effect based on the similarity of the pattern between the measured magnetic field and sensor temperature. However, according to the ground simulations, this drift occurs when there is a rapid temperature change more than 0.5°C/min (Jang 2022), which does not match with the in-orbit temperature behavior. Therefore, this phenomenon should be approached from an in-orbit effect perspective.
Although it cannot be guaranteed that these variations are caused solely by temperature changes, it is still necessary to identify this temperature-related behavior at the orthogonality corrected raw data level because signals from individual axes and sensors are mutually coupled through the calibration matrix.
Therefore, we used three temperature calibration approaches: (1) local maximum-based approach, (2) relative variation-based approach within a specific time interval, and (3) long-term relationship-based approach. All methods leverage the fact that the signal trends of the magnetic field and sensor temperature measurements are similar. The methodology and performance of each method are detailed in Sections 3.1–3.3. The initial results of the best method are presented in Section 4.
On March 14, 2025, the variation consisted of two components: fluctuations with a period of approximately 2 h and a gradual variation over 12 h. The periodicity of the 2-hour fluctuation matched one orbital period (LT 00–24), indicating that this fluctuation had clear orbital periodicity. The gradual 12-hour increase in sensor temperature was due to the reactivation after the lunar eclipse, and this trend was also observed in the magnetic field data. Therefore, we divided the data into 2-hour segments and determined the local maximum (peak) points at each segment. These peaks served as reference points for dividing the periods and indicated a gradual variation when connected.
We selected six local maximum points for each axis and calculated the change in the magnetic field along each axis using the difference between two adjacent peaks. The sensor temperature change was calculated in the same way. We then applied first-order polynomial fitting to the values to remove the gradual variation. This procedure was then applied to the periodic components.
However, a limitation of this method is the time offset between peaks, which are treated as corresponding points across different datasets. This difference varied across sensors and axes, and even among individual axes within a single sensor. The periodic fluctuations observed in the magnetic field data were primarily caused by KPLO’s periodic orbital motion around the Moon with nadir pointing. The interplanetary magnetic field (IMF) dominates the magnitude of the measured field, and this motion generates periodic fluctuations with different phases among the axes. Tracking only temperature-dependent variations in the raw field using selected peaks is challenging. Therefore, Method 1, which had these constraints, was unsuitable for calibrating KMAG data.
From the analysis using Method 1, we found that the KMAG raw data consists of multiple signals that are affected by the periodical maneuver of the KPLO in lunar orbit. Additionally, the IMF exhibited the largest amplitude and dominated the variations. The measured raw magnetic field Bmeas consists of the observed field, Bobs, and additional magnetic field affected by the temperature effect, where αT denotes the in-orbit temperature coefficient and T0 denotes the reference temperature.
Bobs is the sum of all fields observed by the KMAG: magnetic offset Boffset,interplanetary magnetic field BIMF, lunar crustal magnetic field BM, and spacecraft-generated noise BS/C.
The final goal of the temperature calibration is to eliminate temperature-related term. This term was obtained by subtracting the ARTEMIS-P1 magnetic field from offset-corrected KMAG data where the two data were expressed in the KMAG sensor coordinate system. When applying this method, we assumed that ARTEMIS-P1 and KMAG measured the same BIMF and BM. To examine the deviation in the residuals with respect to changes in the sensor temperature, we applied a 5-minute moving average window to each axis while preserving the underlying trend. We divided the data into segments in which the temperature increased or decreased and analyzed how the magnetic field changes with the temperature.
A limitation of this method is that the temperature-dependent variation in the residual did not exhibit a stable sign. As shown in the gray shadowed region in Fig. 4, an increase in temperature was associated with an increase in the residual of the x-axis on October 19, 2023, whereas it corresponded to a decrease on April 20, 2023, and vice versa.
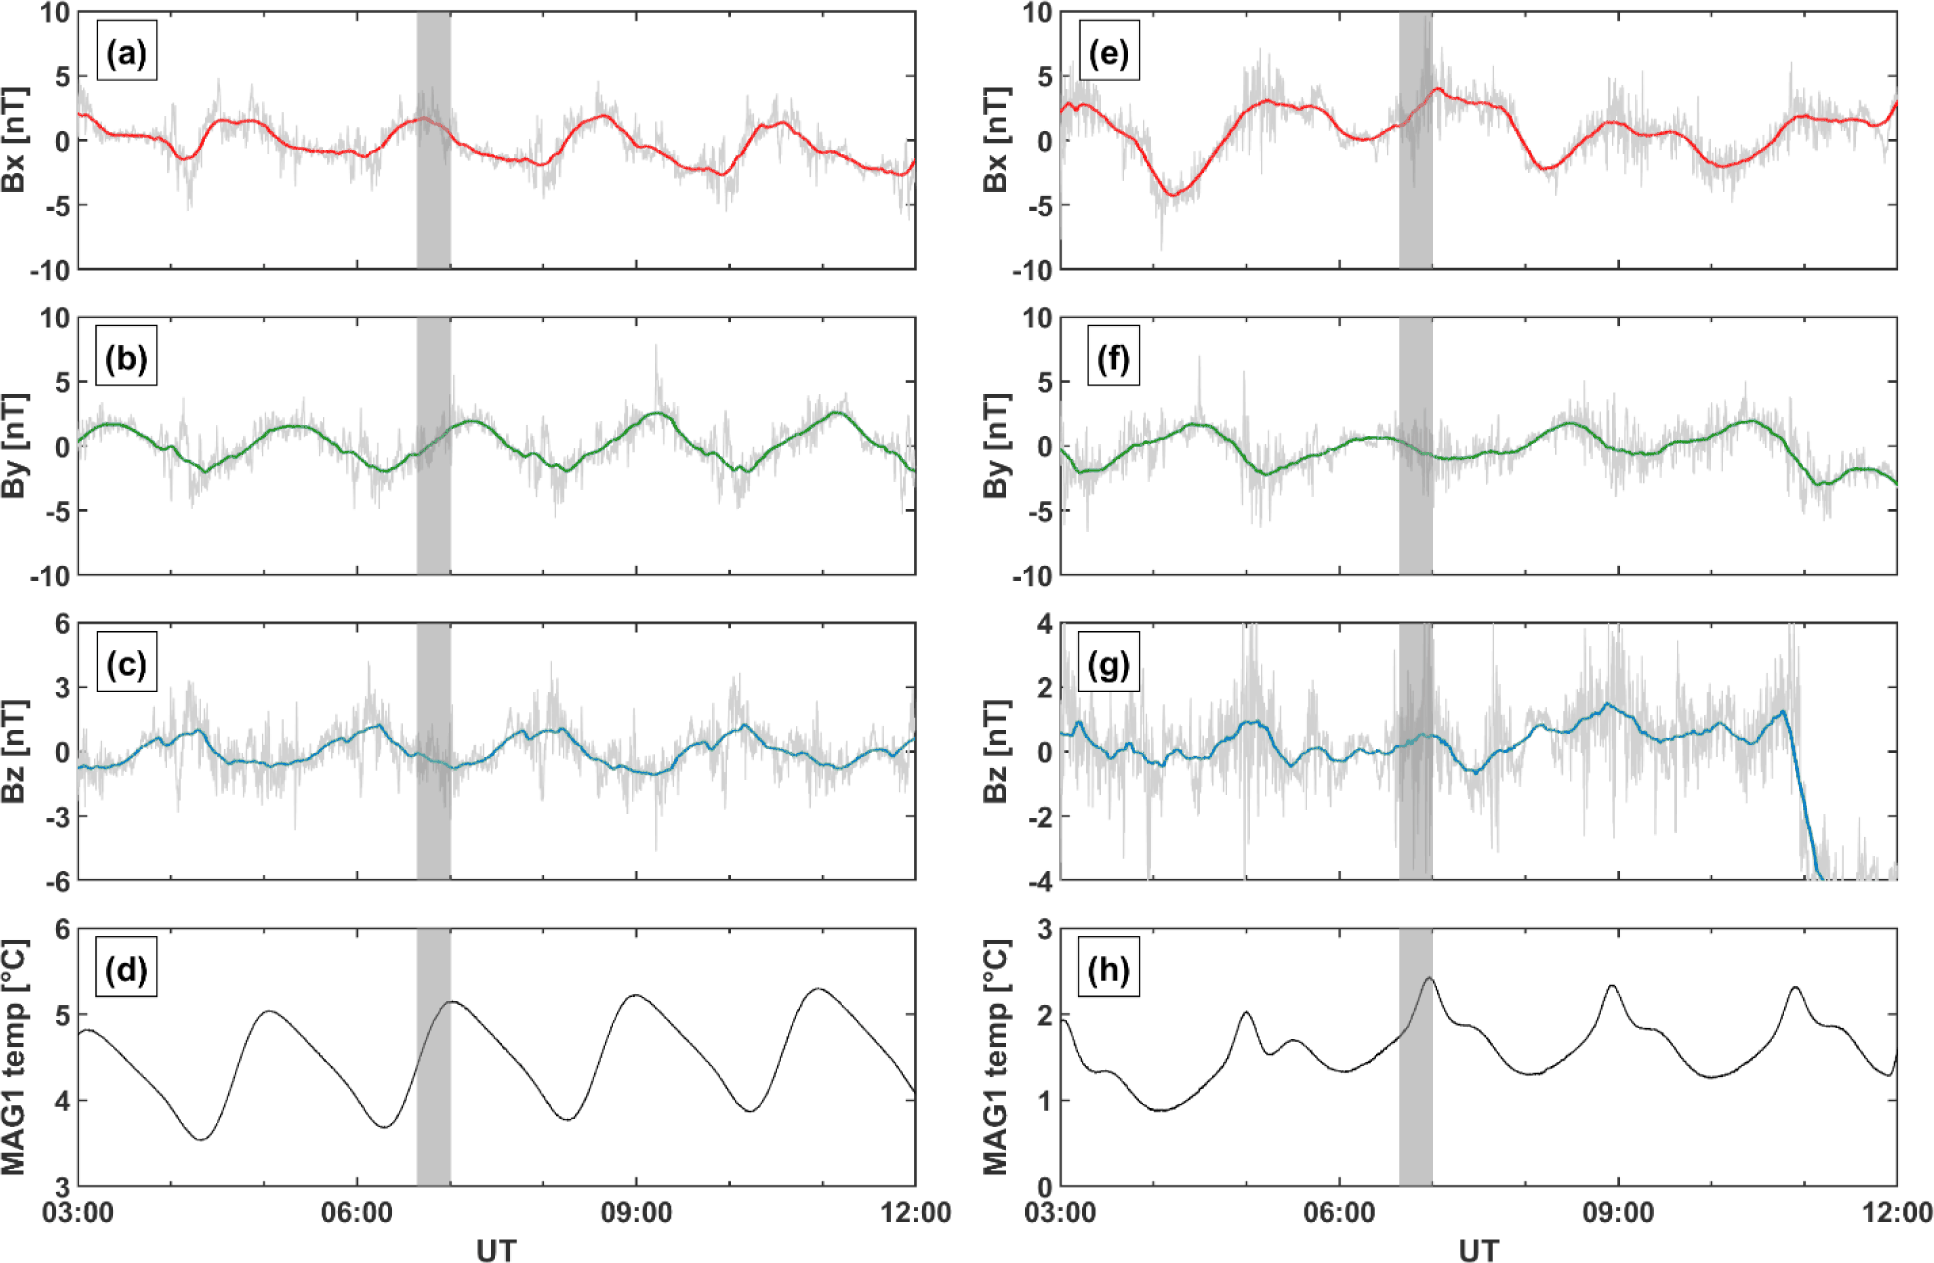
The temperature effect is an intrinsic characteristic of the sensor and is expressed by the temperature coefficient. Therefore, the temperature-dependent offset field should vary consistently with sensor temperature, with a constant sign for all observations. However, the moving-averaged residuals, which were intended to represent the temperature-dependent offset, did not follow this behavior. This suggests that the residuals and their moving-averaged values derived by this method were not sufficient to capture the stable temperature coefficient. We initially assumed that the residuals consisted of variations due to thermal effects only; however, other signals that we considered as zero may have affected this unstable situation.
It is difficult to generalize Methods 1 and 2 to all datasets because the precise sources of noise are difficult to identify. Moreover, a short boom length of 1.2 m makes the sensors susceptible to noise generated by the spacecraft body, making it difficult to distinguish between noise and signals. Therefore, since previous methods were limited to short term analyses, from a few hours to one day, they have weaknesses that require extensive case studies for individual days. From this perspective, we selected another approach to examine long-term KMAG data variation, which was different from Methods 1 and 2.
Fig. 5 shows the total magnetic field and MAG1 temperature for one year, covering various orbital phases. When the KPLO orbital plane is at high inclination relative to the lunar equatorial plane, temperature variations are relatively small compared with those in other phases. As a result, sensor temperature data during these intervals appear as bump-like features within the one-year profile, as shown in Fig. 5.
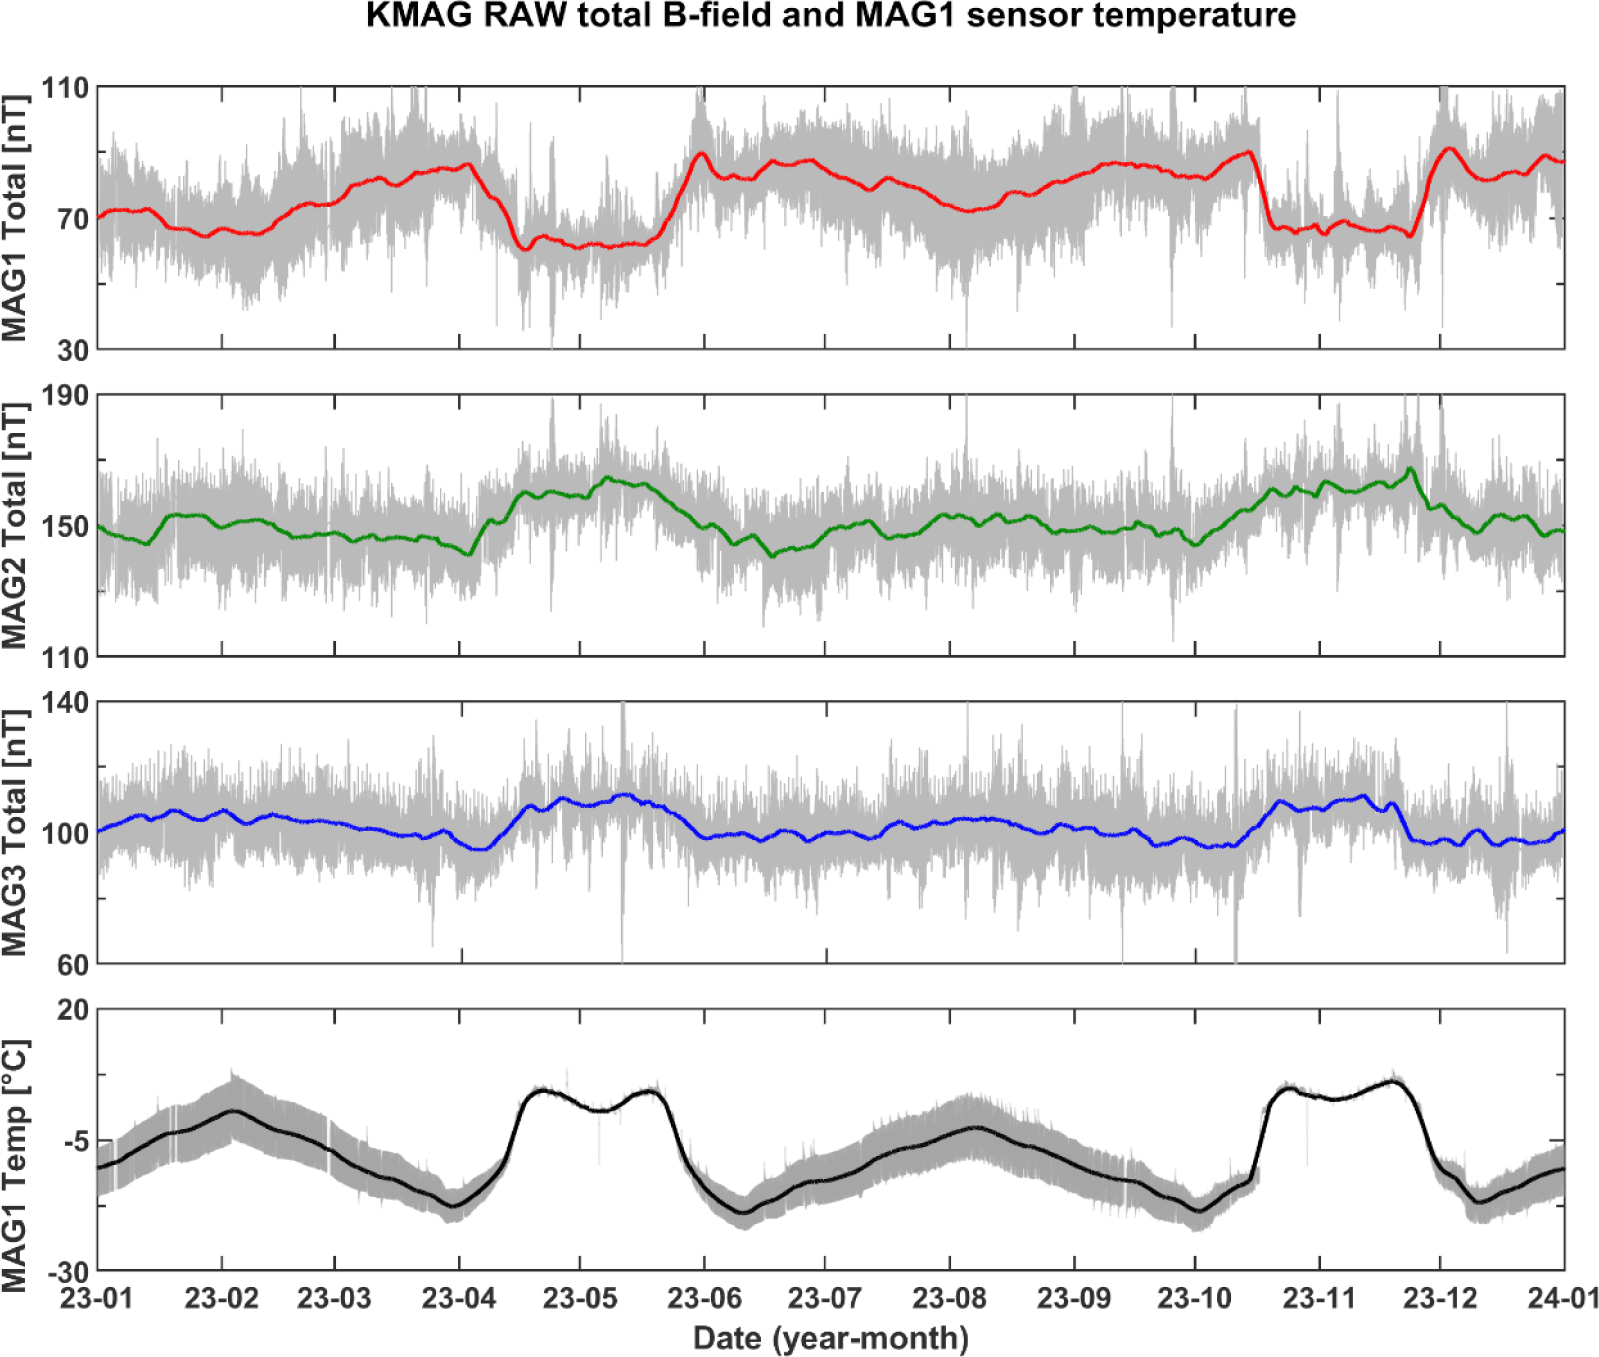
We found that the sensor temperature and measured field variation trends were similar over the long term. In Method 3, we compared the trends for temperature and magnetic field in two different time ranges: 1 year (2023.01.01–2023.12.31) and more than 2 years (2023.01.01–2025.02.01). A moving average was applied to both the magnetic field and sensor temperature to capture their variation trends. To minimize the effects of short-term fluctuations within the orbital cycle, the window size was set to 2 h, which corresponded to 7,200 samples for the data used in this method. Fig. 5 shows the raw magnetic field and sensor temperature of MAG1 within the 1-year interval, and the moving-average value for each data.
As shown in Eq. (1), the measured field consists of the observed field Bobs and the temperature-dependent offset field Btemp, where Btemp is represented as aT (T–TO). Therefore, to retrieve Bobs, which we want to obtain after temperature calibration, Btemp should be eliminated. We determined the in-orbit temperature coefficient αT by evaluating the ratio of the moving-averaged magnetic field to the moving-averaged sensor temperature.
In the case of Method 3, we could obtain a stable temperature coefficient αT because we assumed that this moving-averaged magnetic field data could minimize short-term changes and show constant magnetic field variations with temperature changes only.
After comparing coefficients in two different time ranges, we finally adopted the temperature coefficient derived from the 1-year interval, as it was estimated using data from the nominal mission phase where the magnetometer measurements were considered more stable and reliable. The data from the extended mission phase sometimes includes uncertainties that could bias the estimation of the coefficient. The temperature coefficients αT for the x, y, and z-axes of MAG1 were 1.2 nT/°C, 0.1 nT/°C, and –0.02 nT/°C, respectively. By applying these temperature coefficients to αT (T–TO), we could obtain Btemp and perform temperature calibration by subtracting this offset from the uncalibrated data.
4. INITIAL RESULTS
Using Method 3, we derived the in-orbit temperature coefficients, which were larger than those from the ground test. We then performed a temperature calibration using these coefficients at the stage indicated by the dashed box in Fig. 2. In this section, we present the results of the temperature calibration applied to two different days, which indicates the effectiveness of Method 3. The reference temperature was defined as the first measured sensor temperature for each day.
Fig. 6 shows the calibration enhancement for the KMAG data compared with ARTEMIS-P1 FGM data in a 4-hour plot on August 13, 2024. The colored lines in the left panels show calibrated (CAL) data without temperature calibration, whereas those in the right panels show temperature-calibrated (TCAL) data.
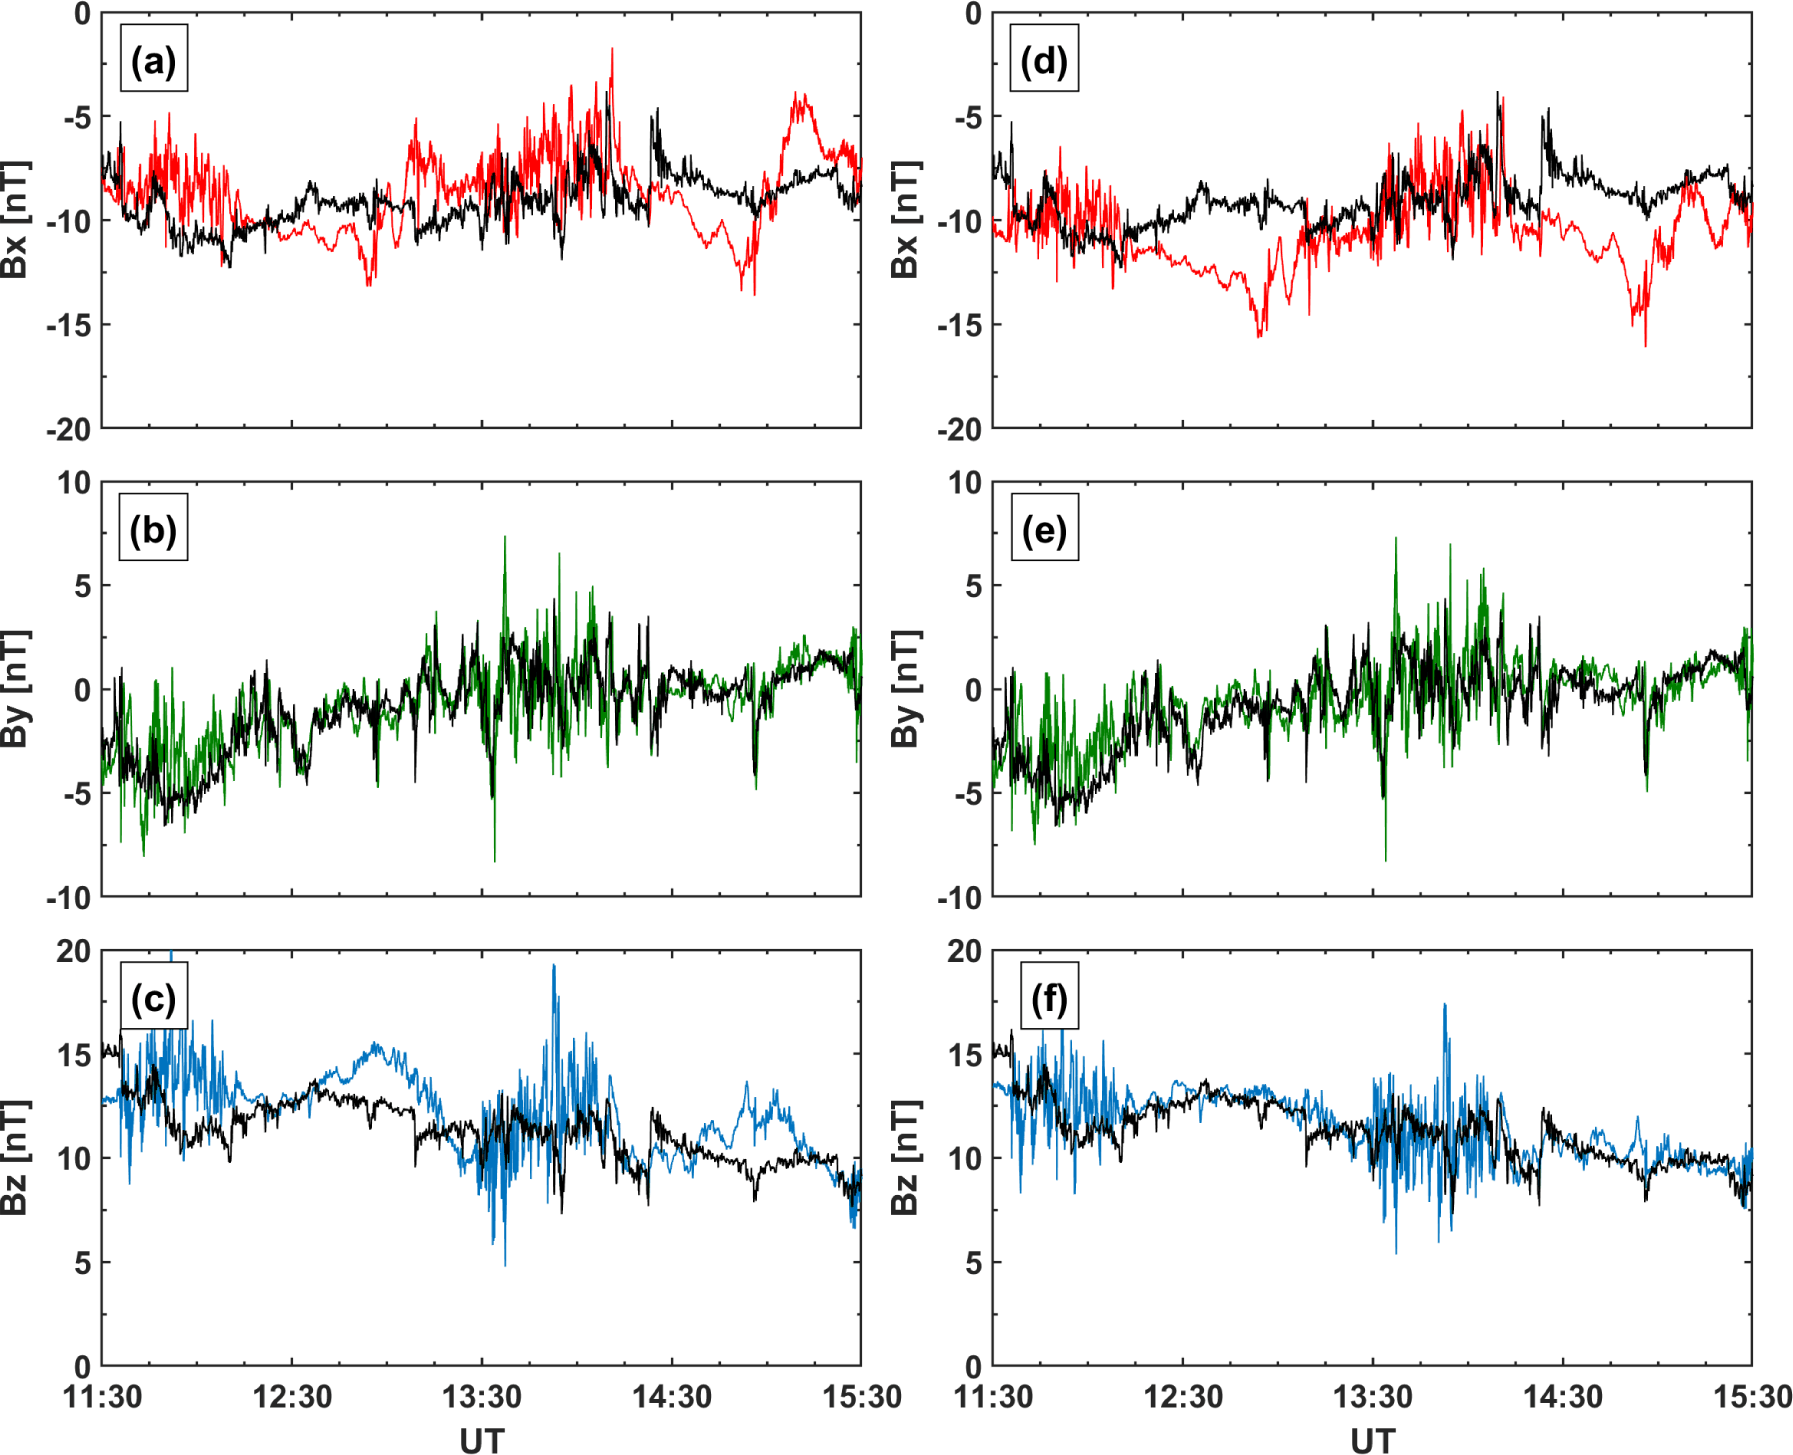
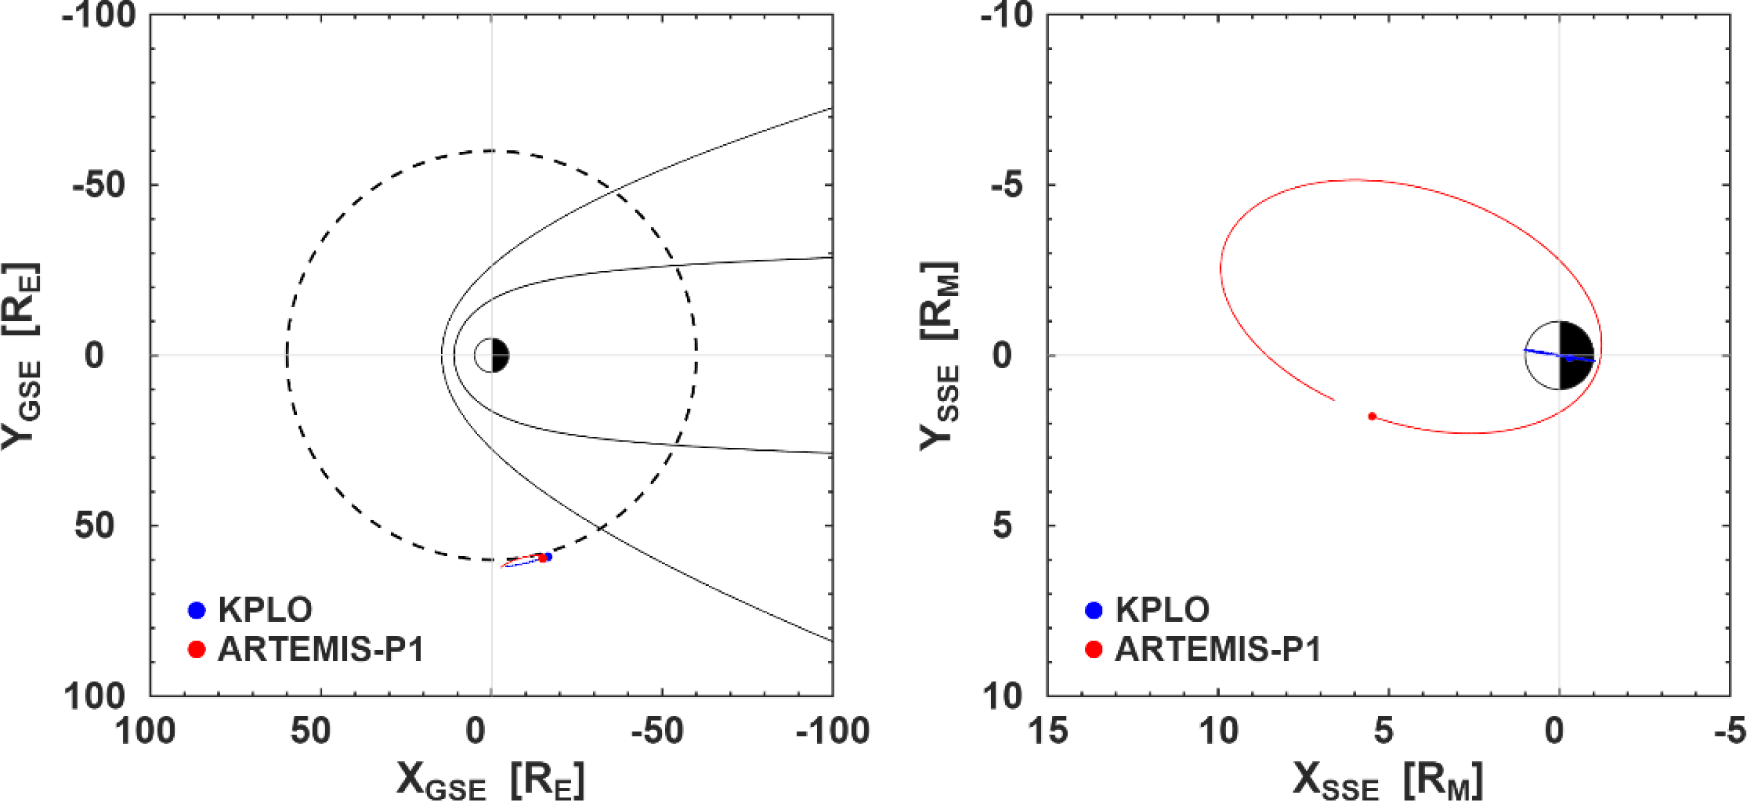
In the left panels, Bx and Bz were different from those of ARTEMIS-P1. In the case of the z-axis, a fluctuation in CAL appeared again at around 14:30 UT, approximately 2 h after the first fluctuation. As KPLO and ARTEMIS-P1 were at the solar wind region (Fig. 7), KMAG observations should show similar trends to those of ARTEMIS-P1. Therefore, we considered that this difference occurred because of another reason that the spacecraft-generated noise calibration process did not detect.
After applying temperature calibration, Bx and Bz followed the overall trend with ARTEMIS-P1, as shown in the right panels. As shown in Table 1, this improvement was confirmed by a decrease in the root mean square error square error (RMSE) between the KMAG and ARTEMIS-P1 data. At approximately 12:30 UT and 14:45 UT, Bx differed from the ARTEMIS-P1 observations. These periods corresponded to the battery charging–discharging phase, and the x-axis appears to have been more strongly affected by the current generated during this phase.
| Date | Calibrated (CAL) | Temperature calibrated (TCAL) | ∆ = TCAL – CAL | ||||||
|---|---|---|---|---|---|---|---|---|---|
| Bx | By | Bz | Bx | By | Bz | Bx | By | Bz | |
| Case 1 (Aug 13, 2024) | 2.31 | 1.85 | 2.22 | 2.15 | 1.73 | 1.89 | –0.16 | –0.12 | –0.33 |
Furthermore, the calibrated data located slightly above ARTEMIS-P1 moved downward after temperature calibration. Since the offset determination was conducted after the temperature calibration, the previously determined sensor offsets were changed (Table 2).
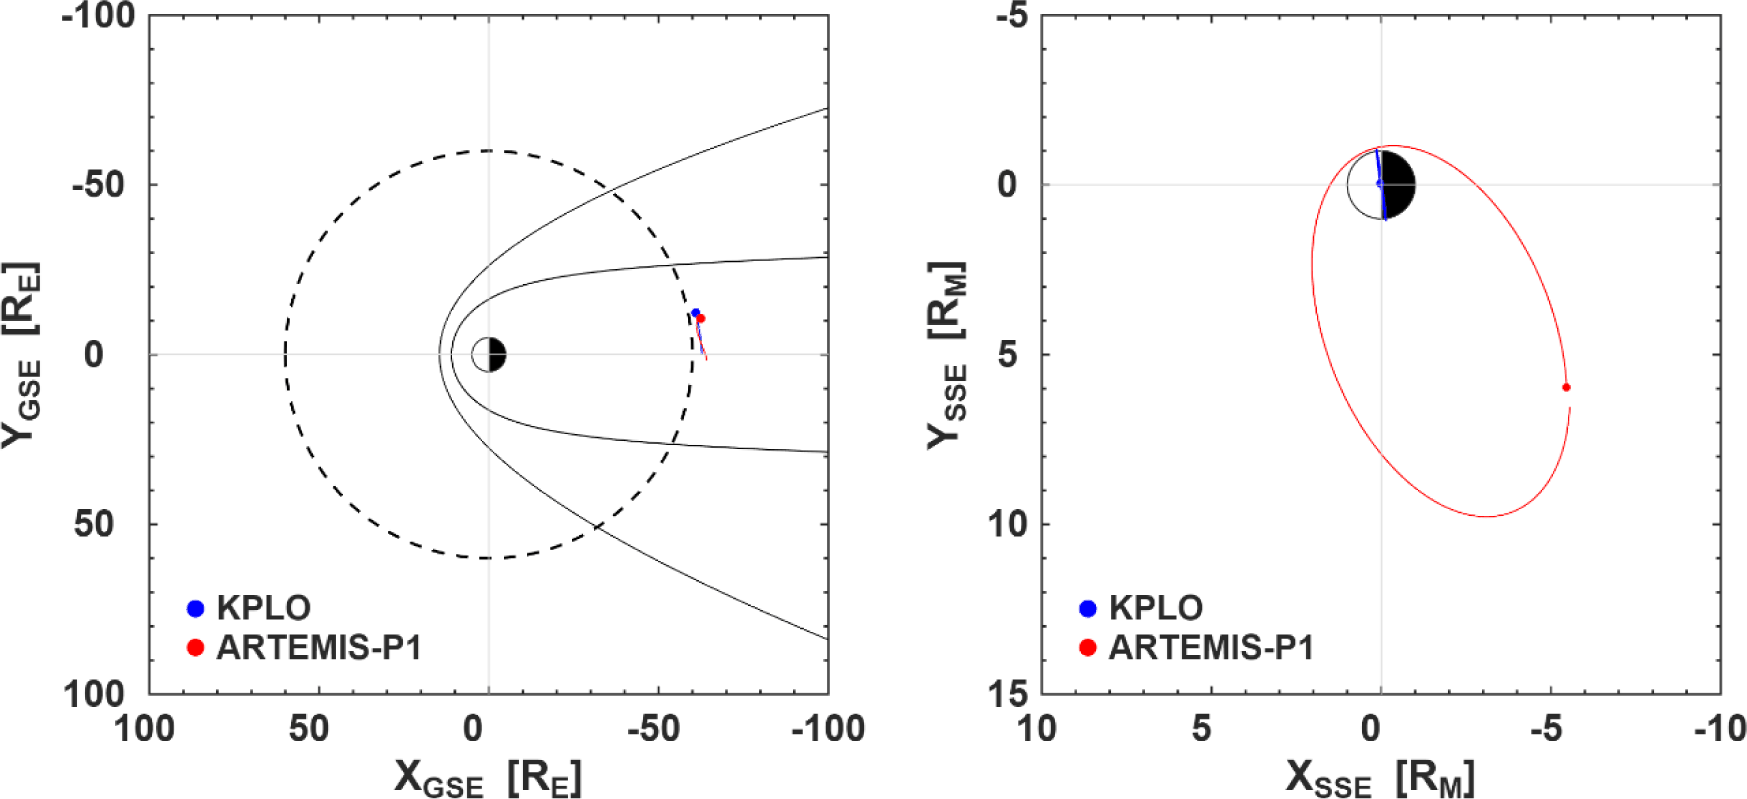
KMAG CAL and ARTEMIS-P1 data for April 24, 2024 are shown in Fig. 8. Both spacecraft were located inside the Earth’s magnetosphere (Fig. 9), thus, the amplitude of the measured signal was smaller than that in the previous case. Whenever ARTEMIS-P1 passes near the Moon, the P1 data shows large-scale magnetic field spikes. These are uncalibrated parts of the P1 data, as shown in Fig 8 between 19:00 and 20:00 UT.
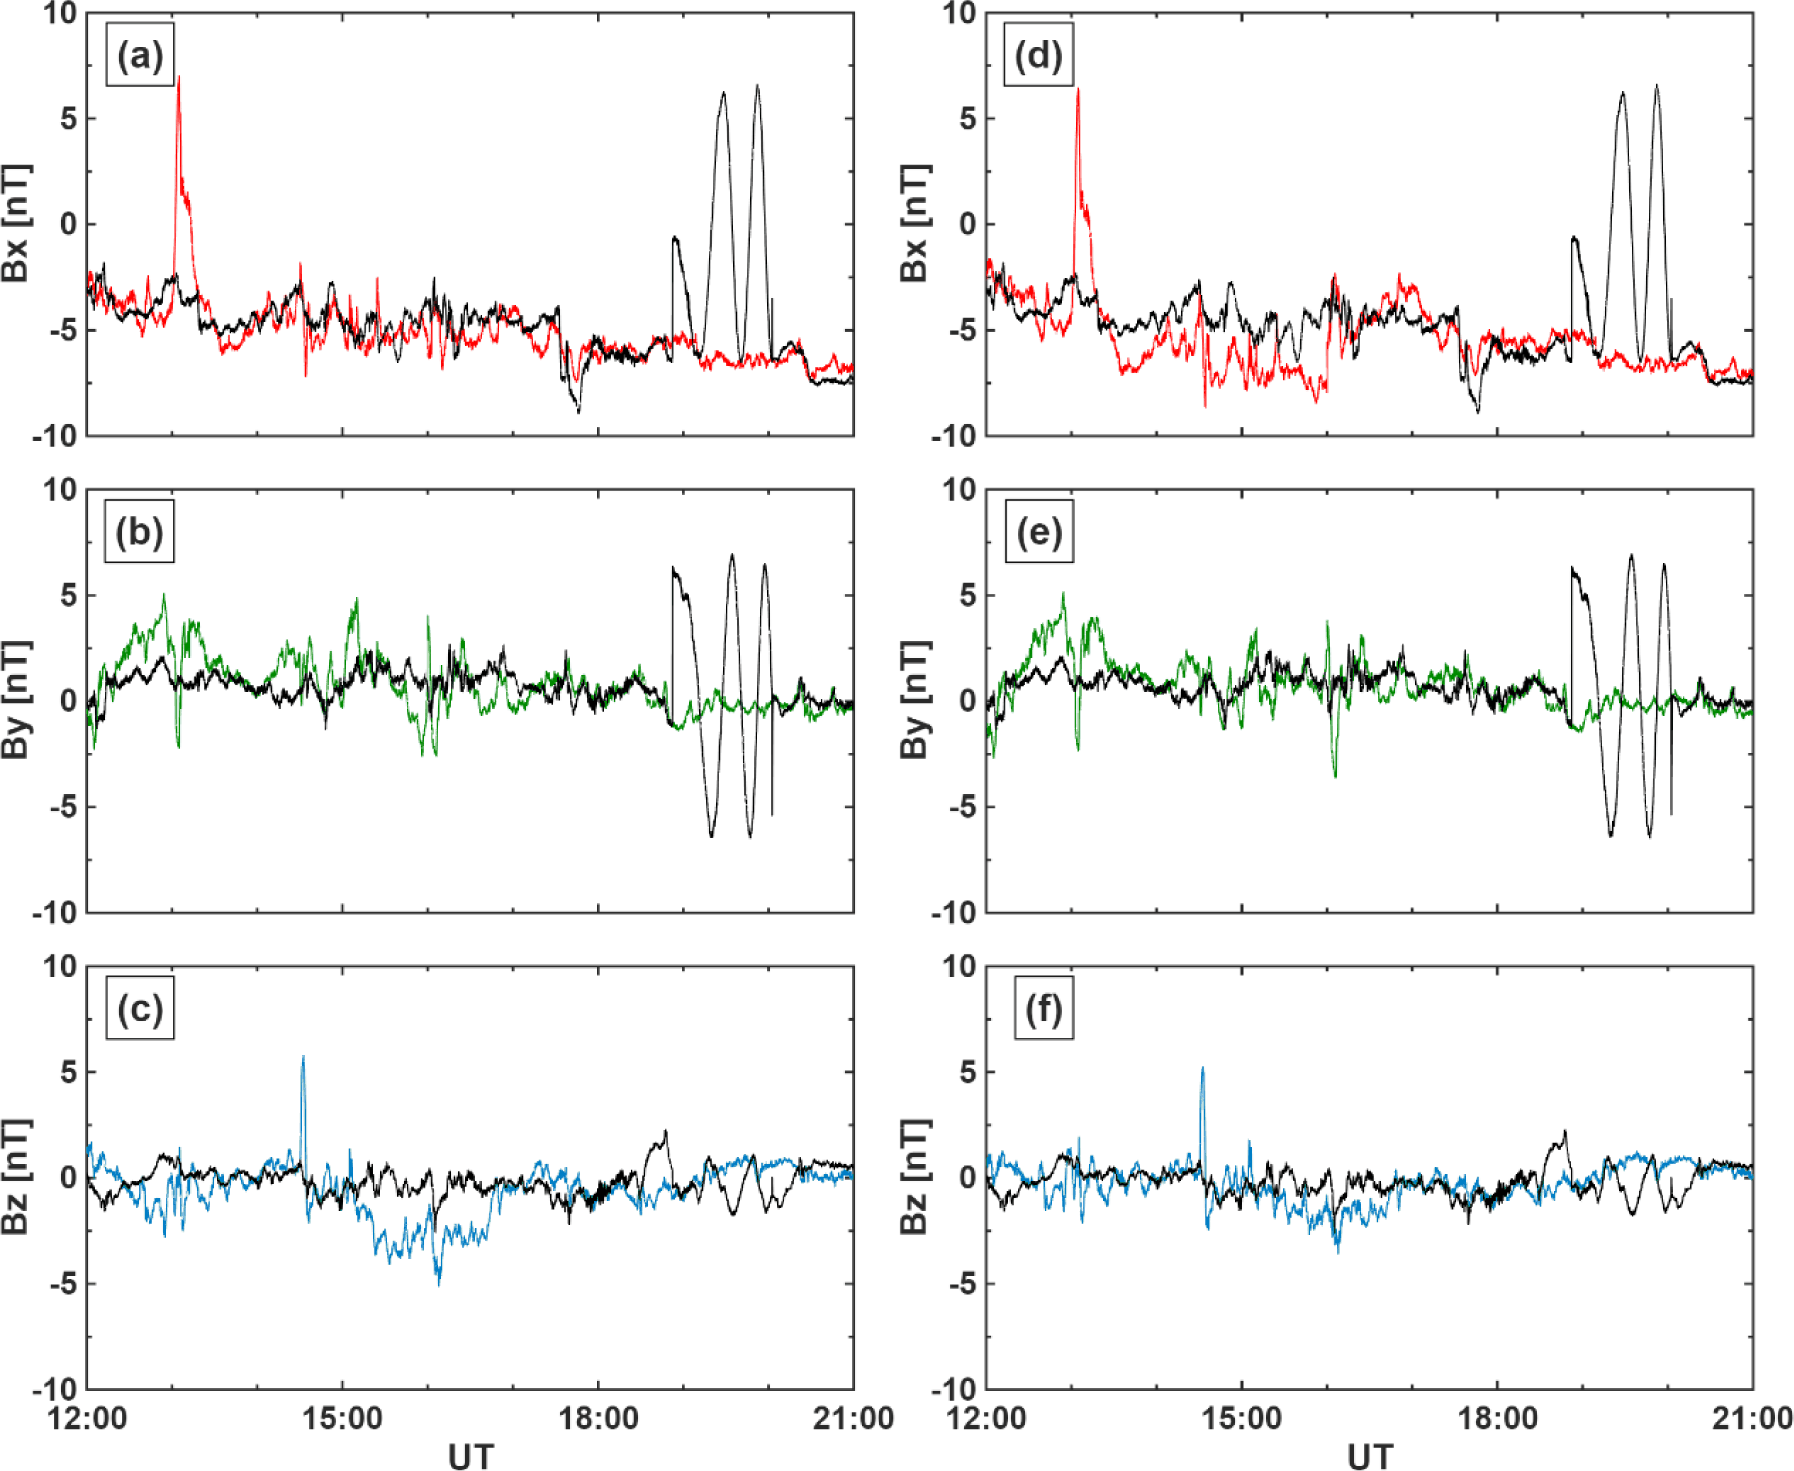
We applied temperature calibration to this case using method 3. As shown in Fig. 8, the amplitudes of the signals of the y- and z-components of the CAL were slightly reduced after temperature calibration. This change was also confirmed by the decrease in the RMSE values as shown in Table 3. However, the difference between Bx and that of ARTEMIS-P1 became more pronounced after temperature calibration. The rapid change of approximately 10 nT observed at approximately 13:00 did not appear in the ARTEMIS-P1 data but was present in the KMAG data both before and after temperature calibration. These field increases in Bx are likely to be due to the maneuver effect of the KPLO.
| Date | Calibrated (CAL) | Temperature calibrated (TCAL) | ∆ = TCAL – CAL | ||||||
|---|---|---|---|---|---|---|---|---|---|
| Bx | By | Bz | Bx | By | Bz | Bx | By | Bz | |
| Case 2 (April 24, 2024) | 3.38 | 1.86 | 1.65 | 3.75 | 1.74 | 1.41 | 0.37 | –0.12 | –0.24 |
In the previous sections, the temperature calibration was applied to two different dates, and its performance was validated. To confirm the applicability of this method to the entire KMAG dataset, we conducted a validation process using the residual between the ARTEMIS-P1 and calibrated KMAG data. We compared two residuals: the residual between ARTEMIS-P1 and KMAG CAL with only the WAIC-UP algorithm applied (BCAL– BP1), and the residual between ARTEMIS-P1 and temperature-calibrated KMAG CAL (BTCAL – BP1). Fig. 10 shows histograms of the residuals for February, May, and August 2023. Since temperature variations depend on the orbital inclination, three months with varying inclinations were selected. The colored curves represent residuals after the temperature calibration, and black curves represent residuals before the temperature calibration. If the histogram of the residual is narrower and more centered at zero, this indicates a good performance of the calibration method.
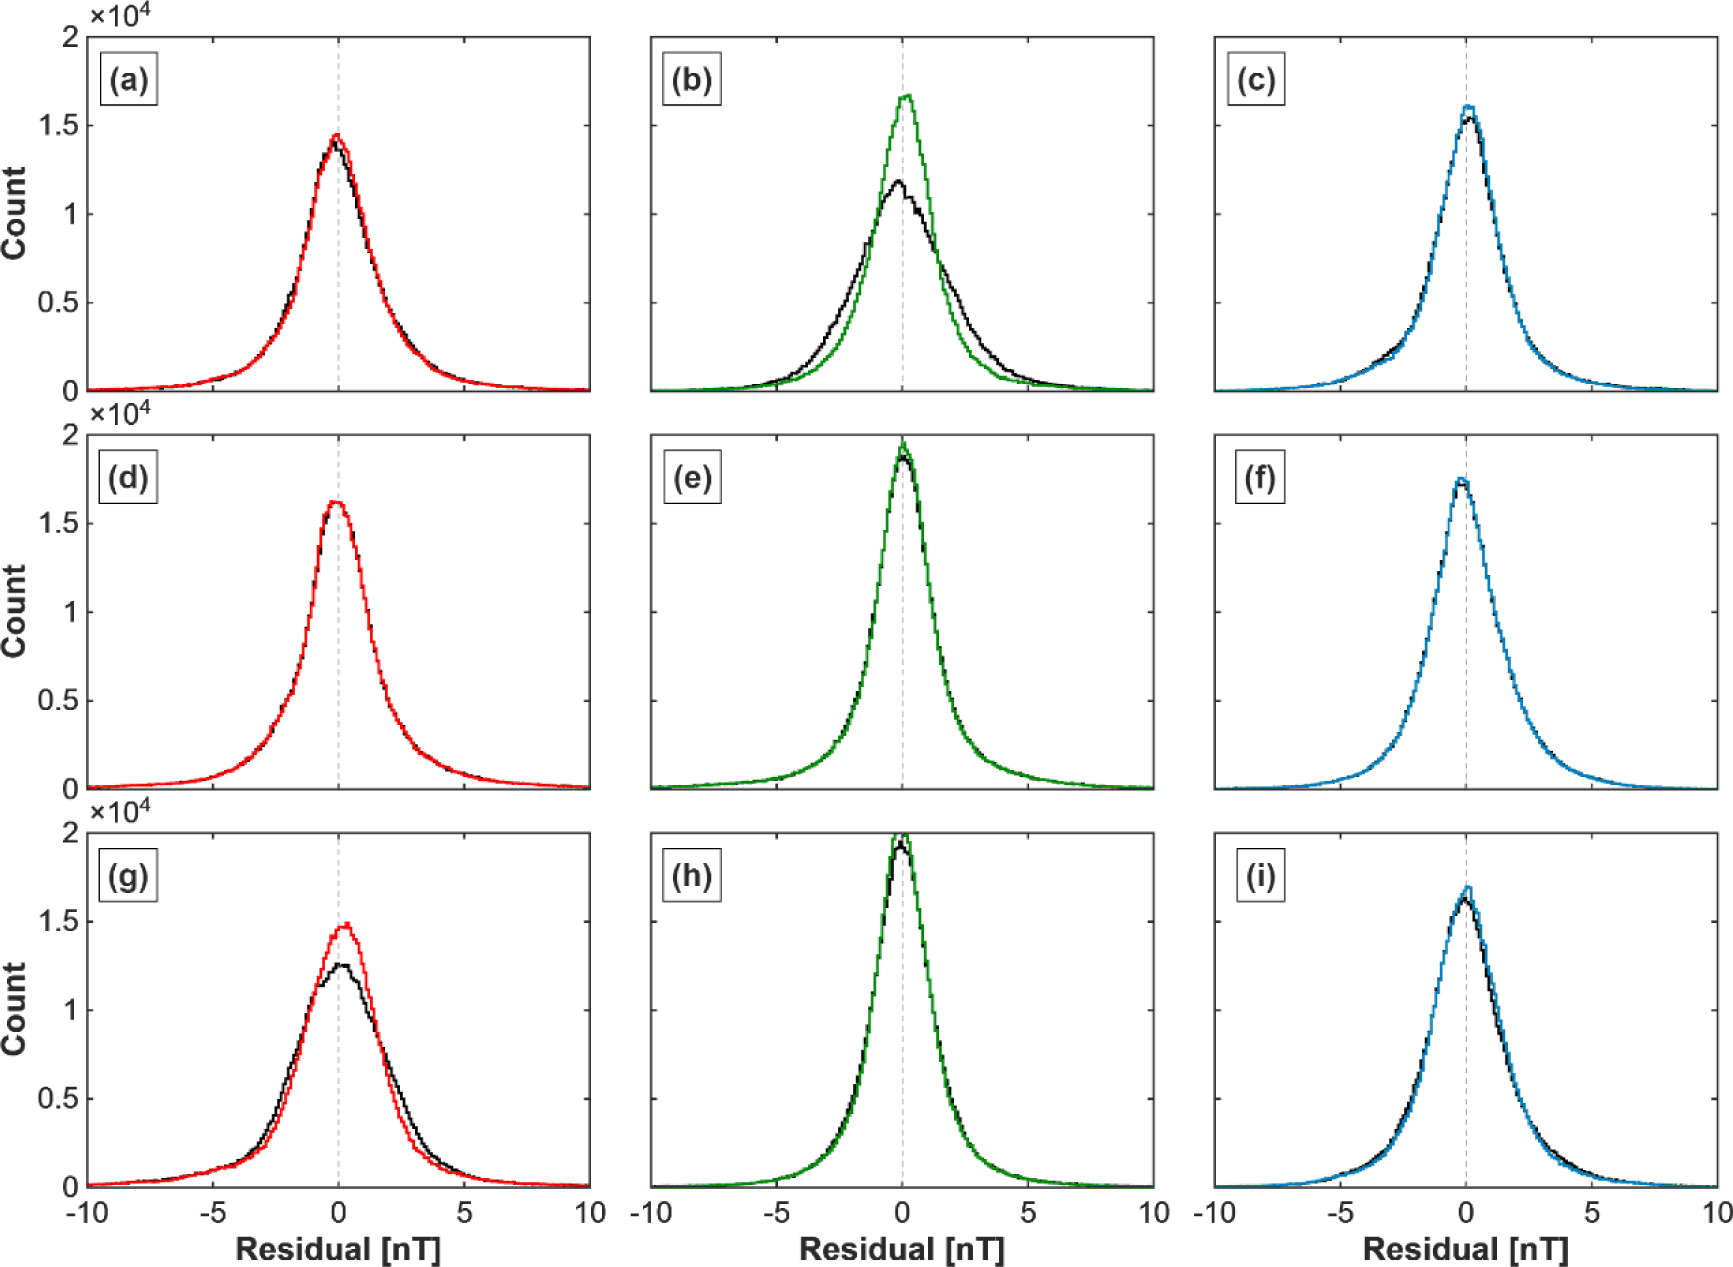
For 2023, the histograms for February (Fig. 10 (a)–(c)) and August (Fig. 10 (g)–(i)) show that the calibrated data were more consistent with ARTEMIS-P1 data. These periods correspond to orbital phases in which the KPLO transitions between the dayside and nightside of the Moon at a low inclination relative to the lunar equatorial plane, and these phases cause larger sensor temperature variations than other orbits. As the temperature-dependent offset is proportional to the temperature difference, as shown in Equation (6), it is reasonable that the calibration was more effective during these periods.
During periods with small sensor temperature variations, such as May (Fig. 10 (d)–(f)), the calibrated data using the conventional method were comparable to the temperature-calibrated data. However, as the KPLO changed its orbit to have larger temperature variations, the histograms showed that the residuals became centered near zero with a narrower distribution. In addition, as shown in Table 4, the RMSE values were reduced after temperature calibration. This indicates that the in-orbit temperature calibration could be effectively applied to eliminate the remaining noise.
5. SUMMARY AND DISCUSSION
We conducted a study on temperature calibration for in-orbit KMAG data. The theoretical temperature coefficient of the sensor and ground test results was approximately 0.2 nT/°C, but the necessity of confirming this coefficient arose from the trend analysis of the measured magnetic field and residuals after the spacecraft-generated noise elimination process. Therefore, various methods are applied to calculate the in-orbit temperature coefficients. We obtain in-orbit temperature coefficients of approximately 1.2 nT/°C, 0.1 nT/°C, and –0.02 nT/°C along the x-, y- and z-axes for MAG1, respectively. When applied in the calibration process, these values substantially reduced the signals that are likely to be related to temperature variations, although these coefficients are quite different from the estimated values.
This difference in the temperature coefficient obtained from the ground test and the in-orbit analysis may have been due to the following factors. If the KMAG measurements have an overall gain, the signals considered to be temperature effects increase in magnitude. The coefficients obtained in this study vary among the axes and sensors. The difference between these values, as well as the differences from the ground test results, may have resulted from the overall gain of KMAG sensors that affect each sensor and axis differently. Also, similar to the battery charging current, other disturbances occurring during the mission potentially affect the measurement and coefficient value derived in this study. These disturbances are likely to have different effects depending on the axes, which we should study further. In addition, through monthly analysis, we estimate that the temperature effect of KMAG exhibits an orbital and seasonal variation. Therefore, further studies of the characteristics of the KMAG measurements and case-by-case analyses can refine the temperature coefficient and calibration procedure derived in this study.
As the KPLO mission has been extended to early 2028, a large volume of KMAG data is expected to be accumulated through continued observations. As calibration procedures are developed and updated in further studies, these data can be expanded into highly reliable large-scale datasets. Therefore, they are expected to serve as a meaningful foundation for subsequent studies on the lunar interior structure and origin of the lunar magnetic field.


