
1. INTRODUCTION
Distinct regions of patterned regolith textures are typical of lunar slopes. This texture was characterized during the Ranger, Lunar Orbiter, and Apollo programs as a hummocky “grid patterned” ground—or “tree bark” texture—consisting of disconnected ridges and troughs forming lineaments of varying lengths (Fig. 1; Kuiper 1965; Shoemaker 1966; Crittenden 1967; Greeley 1971; Mattingly et al. 1972; Scott et al. 1972; Swann et al. 1972). High-resolution orbital data from Apollo missions 11–17, acquired with large incidence angles, revealed that the patterned texture varied on both sloped and flat surfaces (Schaber & Swann 1971; Parker et al. 1973). The direction of illumination further influenced the appearance of the lineaments: depending on lighting, they appeared either parallel to the slope or at approximately 30° to 50° to the slope (Howard & Larsen 1972; Mattingly et al. 1972; Parker et al. 1973), producing a cross-hatched pattern of discontinuous, rounded to subangular rhomboid shapes. To explain these observations, the leading hypothesis among Apollo scientists was that the patterned surface texture resulted from downslope movement of loose regolith triggered by impacts and periodic seismic shaking, especially in areas where pre-existing bedrock fractures were present (Swann et al. 1972).
Post-Apollo era studies, using high-resolution images, identified this patterned surface texture, now known as “elephant hide” texture (EHT), on both the Moon and Mercury (Plescia & Robinson 2010; Melosh 2011; Zharkova et al. 2020; Kreslavsky et al. 2021). EHT is found lunar-wide, including within mare and highland terrains, on young Copernican surfaces (Shoemaker 1966; Greeley 1971; Plescia & Robinson 2010; Lena & Fitzgerald 2014; Robinson et al. 2016; Kreslavsky et al. 2021; Bernhardt et al. 2022; Bondarenko et al. 2022) and inside permanently shadowed regions (PSRs) (Brown et al. 2024; Basilevsky et al. 2024; Williams et al. 2024). It has been further characterized by decameter- to ~100 meter-wide lobate segments (Fig. 1), which most commonly contour slopes 5° to 30° (Xiao et al. 2013; Kreslavsky et al. 2021; Bondarenko et al. 2022; Bondarenko 2023). However, EHT distribution is non-uniform, indicating that slope alone does not control its formation (Williams et al. 2024).
Periodic seismic shaking may explain why EHT persists on near-horizontal and concave surfaces, despite regolith gardening that would otherwise erase these small-scale features and smooth the topography over time (Ross 1968; Soderblom 1970; Antonenko 2012; Fassett & Thomson 2014; Zharkova et al. 2020; Kreslavsky et al. 2021). Nevertheless, the possible association between EHT and young tectonic features—such as whether EHT is enhanced, suppressed, or otherwise influenced near such tectonic activity—has yet to be investigated globally (Watters et al. 2015, 2019, 2024). Diurnal thermal cycling (Melosh 2011) and electrostatic dust levitation (Gold & Williams 1973) have been proposed as periodic EHT-forming processes that may contribute to regolith deposition over geologic timescales; however, these hypotheses remain a gap in the literature.
In terrestrial geomorphology, it is well understood how surface shape, slope position, regolith thickness, density, and rates of weathering influence granular material transport and deposition across the landscape (Culling 1960; Pelletier 2008; Anderson & Anderson 2010). However, how these factors contribute to forming small-scale features on airless bodies remains poorly understood. Previous workers have shown that terrestrial morphometric variables, such as curvature (surface shape) and catchment area (flow paths), generated from high-resolution terrain models aid in interpreting the lunar landscape (Mitusov et al. 2023); however, these techniques have yet to be applied to analyze EHT-bearing surfaces. Bondarenko (2023) generated a high-resolution terrain model using shape-from-shading techniques (Bondarenko et al. 2018) and Lunar Reconnaissance Orbiter Camera Narrow Angle Camera (LROC NAC; Robinson et al. 2010) images to map craters on an EHT-bearing surface. They observed a lack of craters 5 to 8 m in diameter, indicating that these craters may be regolith-filled (Bondarenko 2023). Given the estimated crater depths in that size range, it was hypothesized that EHT must be mobile up to a depth of 1 m (Bondarenko 2023). However, more mapping and analysis are needed of EHT-bearing surfaces globally to constrain these depth estimates.
Recent work investigated EHT occurrence in PSRs and how diffuse secondary lighting affects the interpretation of these small-scale surface features (Basilevsky et al. 2024; Williams et al. 2024; Brown et al. 2025). In images acquired under primary illumination, each pixel has one light source. However, under diffuse secondary lighting, each pixel receives illumination from multiple sources and angles (Haruyama et al. 2008; Brown et al. 2022; Mahanti et al. 2022, 2023, 2024; Robinson et al. 2023; Martin et al. 2024). In this work, we seek to understand better how our interpretation of EHT differs under varying lighting conditions by mapping EHT in and out of shadow near the south pole (90°S to 88°S; Fig. 2) under direct illumination with LROC NAC images and comparing results to co-located ShadowCam images (Robinson et al. 2023) of the same regions while temporarily shadowed. This direct vs. secondary illumination comparison guides our interpretation of landforms in PSRs.
We search for the presence or absence of EHT using a grid-mapping technique (Voelker et al. 2017) with cells of both 5 km by 5 km and 1 km by 1 km over a fixed geographic area. Our goal is to identify the locations of EHT occurrences and compare their morphology, including specific morphometric variables (slope angle, curvature, and slope position) with those in non-shadowed polar areas to test whether PSRs show unique regolith properties. Given the globally distributed occurrence of EHT, a classification of EHT is necessary to determine the physical properties that affect its formation, which is useful for informing aspects of future landed polar exploration, such as hazard avoidance and regolith stability.
2. DATA AND METHODS
We used the US Geological Survey (USGS) 1-meter/pixel LROC NAC controlled south pole average pixel value and subsolar longitude (time of day) mosaics (84°S to 90°S) to map EHT in illuminated terrain (Archinal et al. 2023). All images in the mosaics were aligned to the Lunar Orbiter Laser Altimeter (LOLA) reference frame using the ISIS jigsaw tool (Edmundson et al. 2012). USGS-controlled mosaic products can be downloaded from the LROC PDS archive (https://pds.lroc.im-ldi.com/data/LRO-L-LROC-5-RDR). Because lighting geometry affects the appearance of EHT (Schaber & Swann 1971; Kreslavsky et al. 2021; Bondarenko 2023; Brown et al. 2024) we primarily mapped EHT from the subsolar longitude mosaics (using images grouped in 10° bins of subsolar azimuth). The average mosaic is a composite of images from multiple lighting directions and was thus useful for identifying regions with any illumination.
For permanently shadowed terrain, which made up more than half of the map area, we selected uncontrolled ShadowCam images acquired at various times during the south pole summer. To understand the effect of diffuse secondary lighting on identification of regolith textures, we also included ShadowCam images of temporarily shadowed terrain for comparison with co-located NACs (Fig. 3; Supplementary Table S1). The ShadowCam images of temporarily shadowed terrain had 34% areal overlap with illuminated NACs, providing suitable lighting conditions to interpret the same terrains in both datasets. All ShadowCam images were map-projected in polar stereographic projection with a pixel scale of 2 m. We did not correct image-to-image offsets (up to 50 m; Wagner et al. 2024), as the scale of the offsets did not affect our mapping in the 5 km by 5 km or 1 km by 1 km cells.
In addition to mapping EHT with LROC NAC and ShadowCam images, we measured regional morphology using the LOLA south polar 20-meter/pixel digital elevation model (LDEM; Mazarico et al. 2011; Barker et al. 2021). We computed slope and curvature using the GDAL “gdaldem” tools (GDAL/OGR contributors 2025) and the SAGA “Morphometric features” tool (Conrad et al. 2015), using their default algorithms: Horn (1981) for slope and Zevenbergen & Thorne (1987) for curvature. Horn is sensitive to short-range variation and effective over ~2 pixels (40 m), while Zevenbergen & Thorne produces smoother derivatives across ~3 pixels (60 m), making it more suitable for curvature estimation (Horn 1981; Zevenbergen & Thorne 1987; Kienzle 2004). Last, we used regional geologic (Fortezzo et al. 2020) and polar illumination (Mazarico et al. 2011) maps to compare EHT to geologic terrains and overlap with PSR extents.
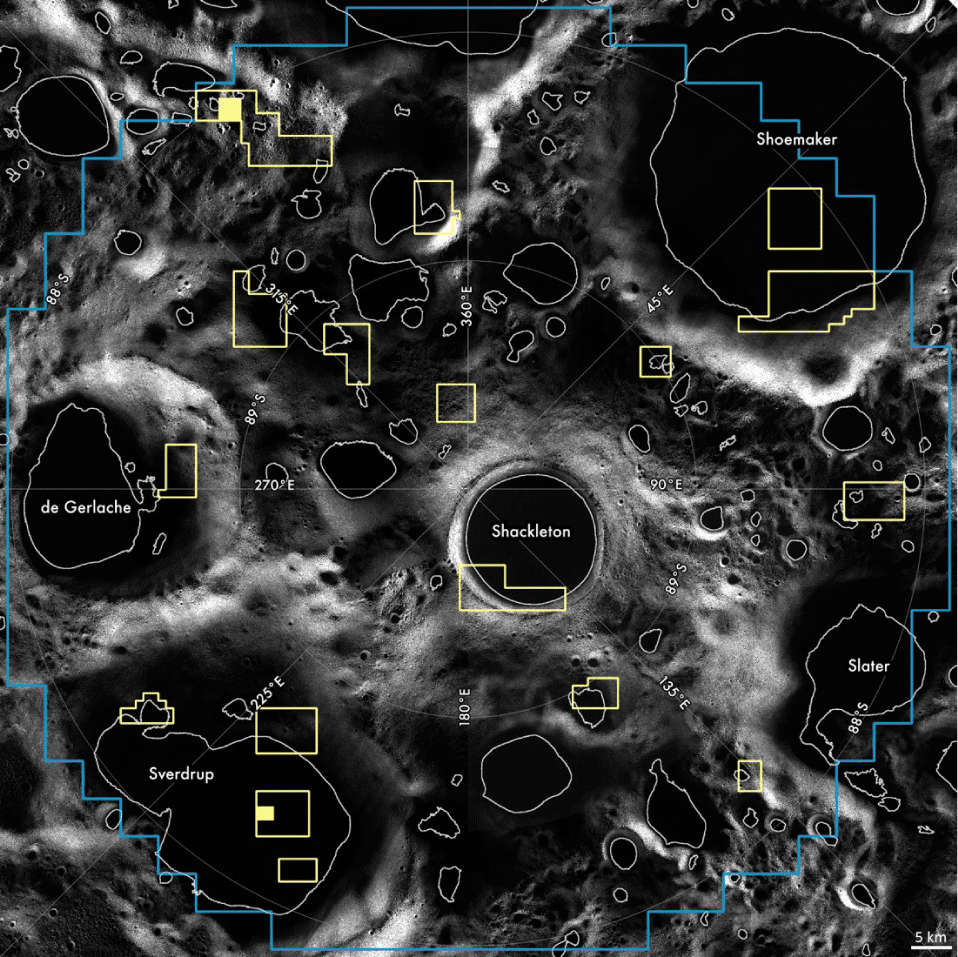
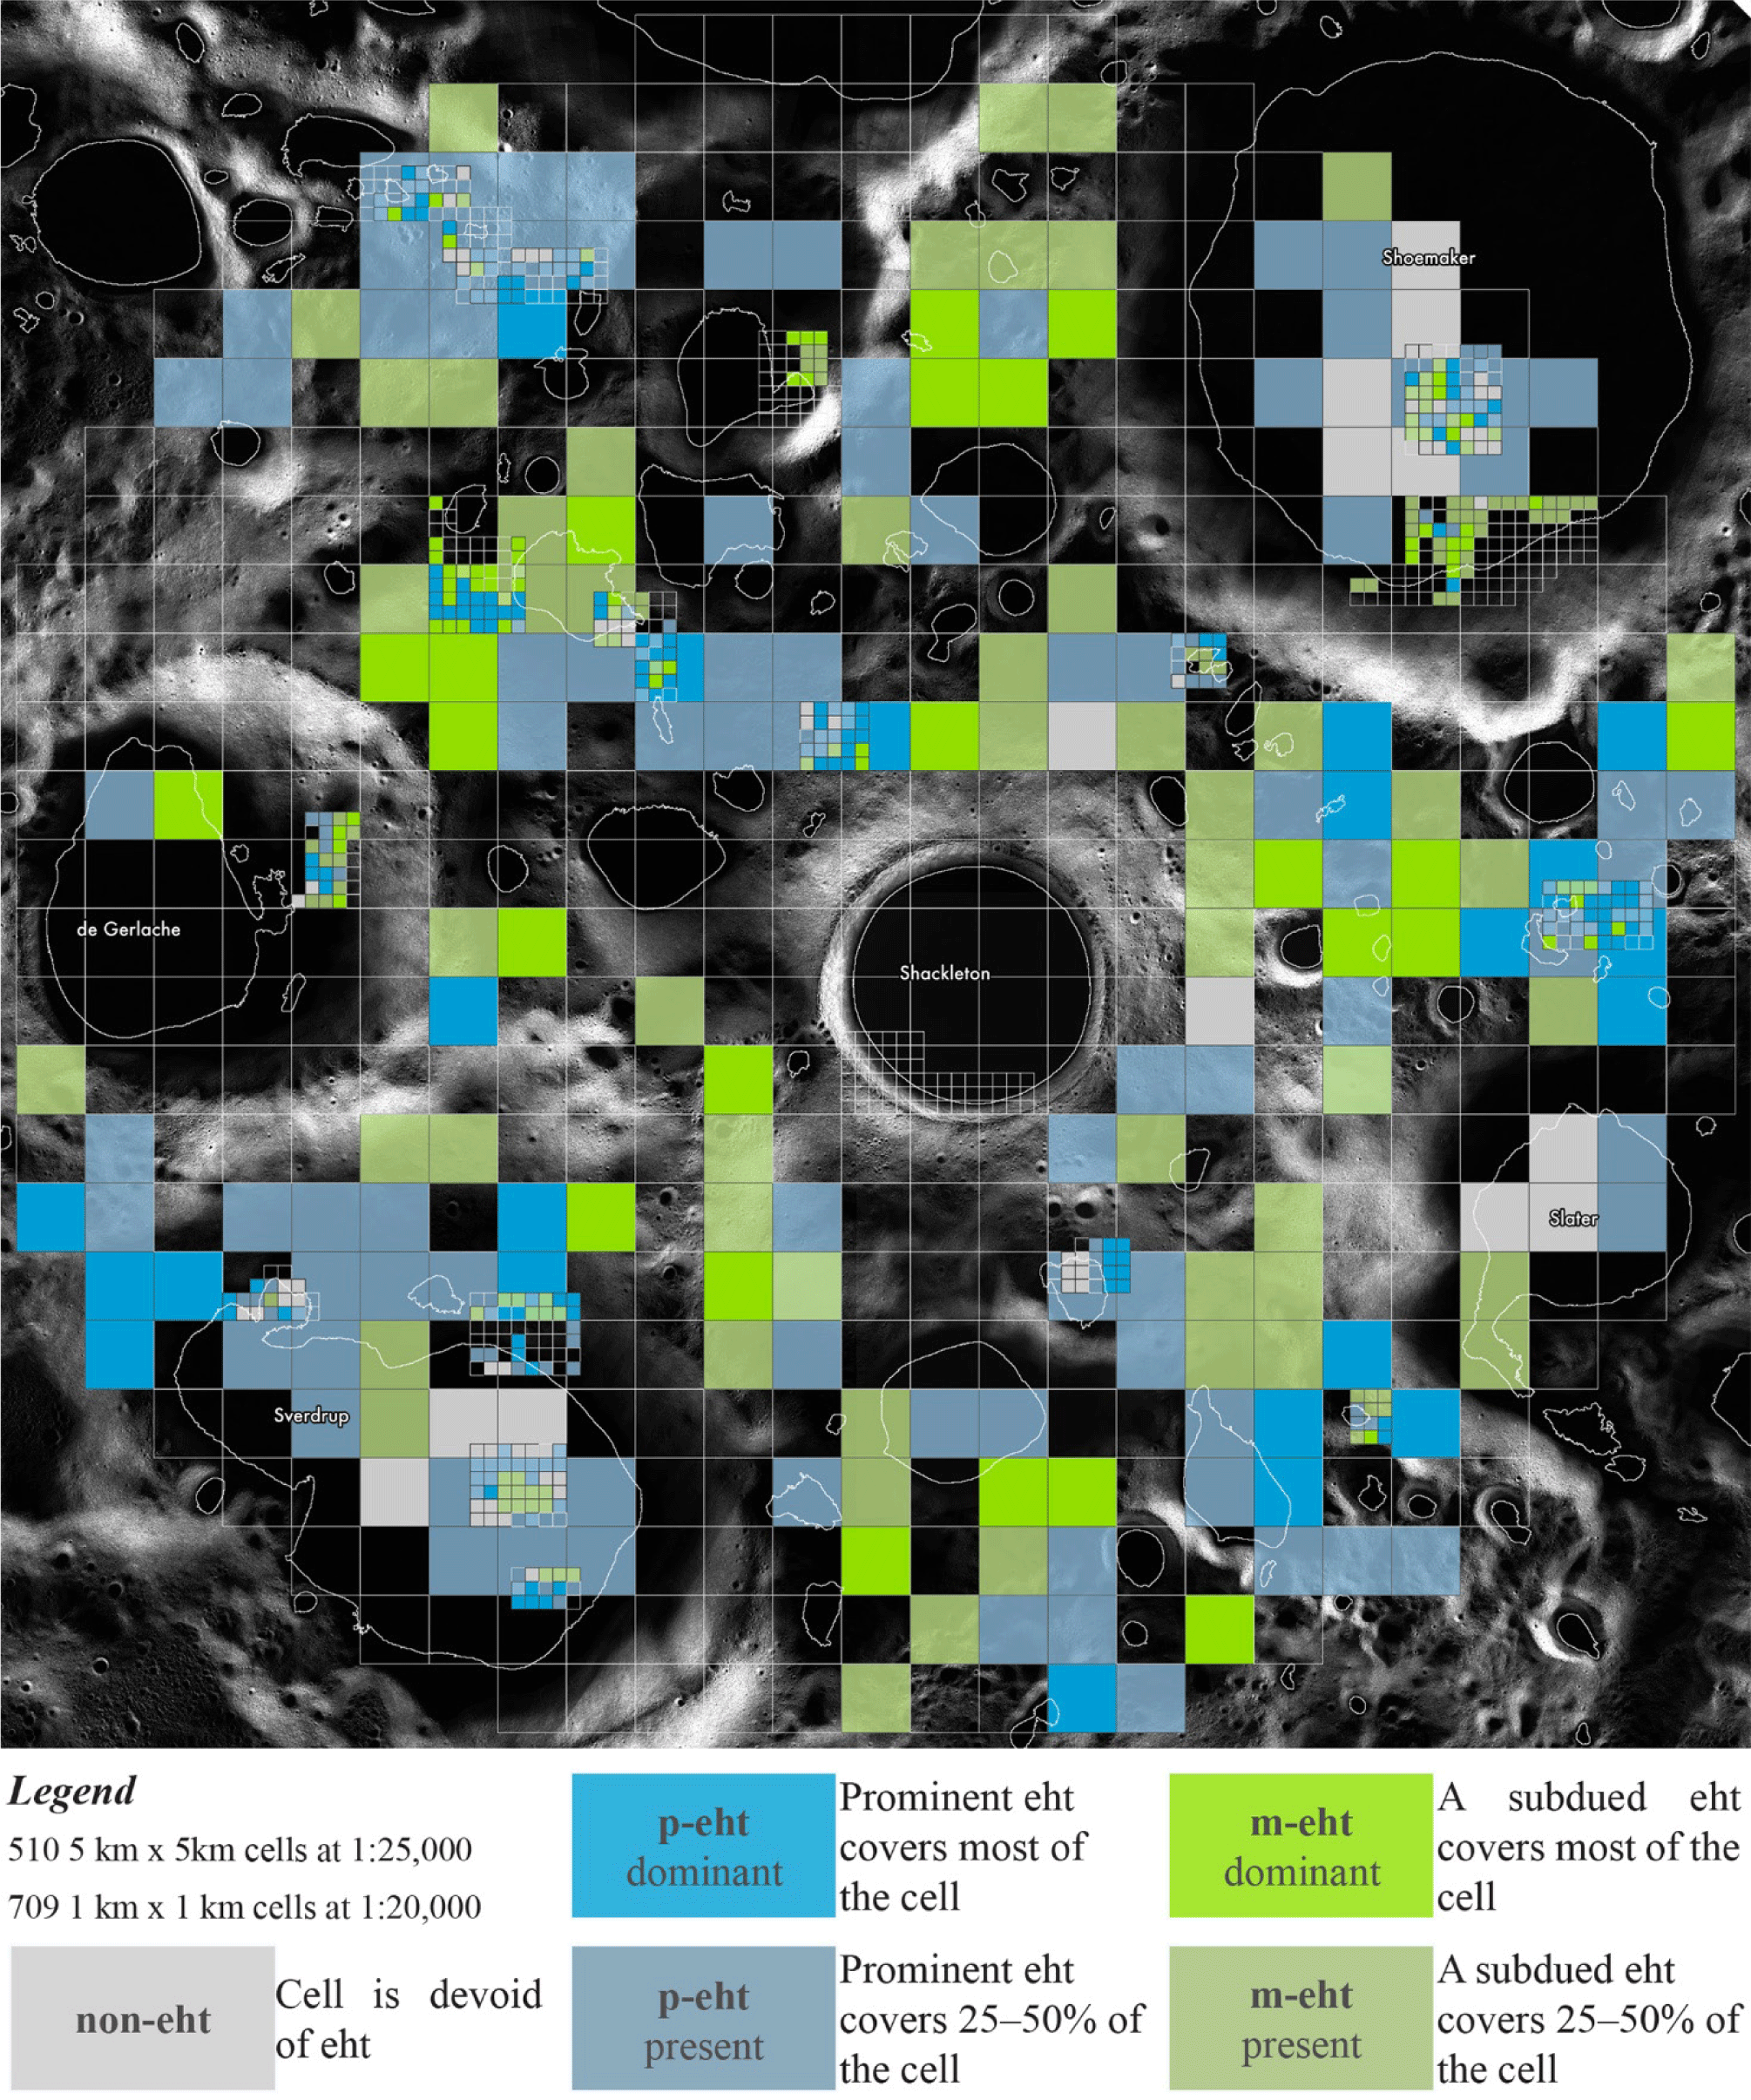
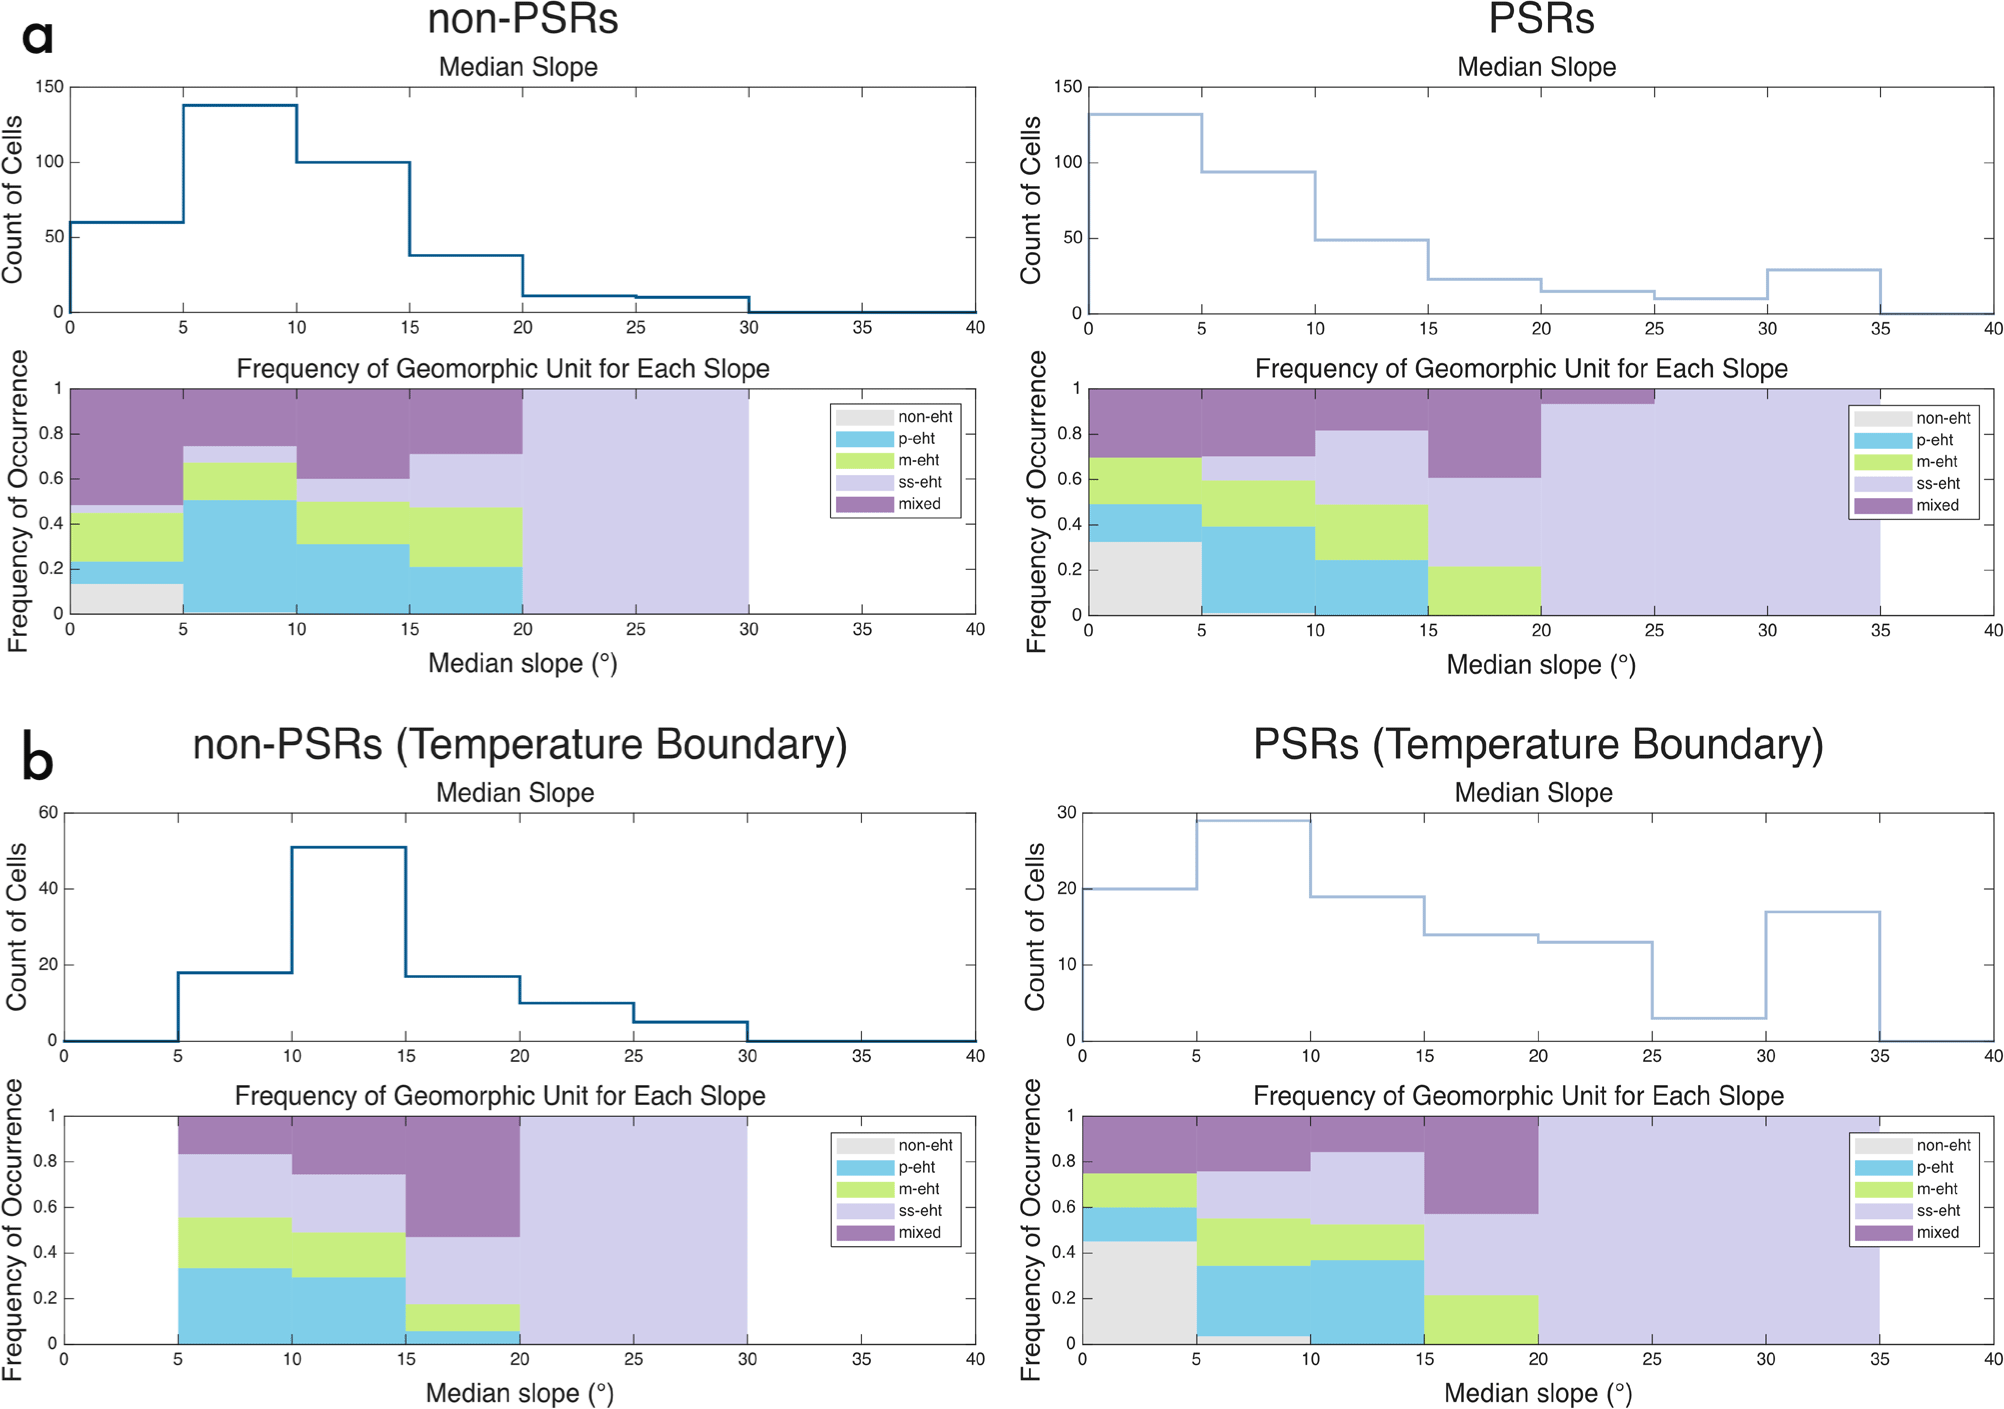
We divided our study area (90°S to 88°S; 12,750 km2) into 510 grid cells (5 km by 5 km) using the QGIS ‘Create grid’ algorithm (QGIS Development Team 2025). We chose a coarse map scale (1:25,000) and grid-mapping cell size that still allowed us to identify EHT lobate segments ≥ 10 meters-wide and cover a significant map area. We used a finer map scale (1:20,000; 1 km by 1 km cells) across PSR to non-PSR temperature boundaries and areas of interest (Fig. 2; Section 3.3) to investigate potential segment width variations correlated with temperature and slope morphometry. Temperature boundary regions of interest were chosen based on annual maximum temperatures using the Diviner maximum surface temperature maps (240 m/pixel; Williams et al. 2019) for reference. We chose areas where the maximum temperature difference between PSRs to non-PSRs differed by 90 K to 200 K. The temperature transition zones that we selected spanned two to six km along PSR boundaries. We also consulted the LOLA south polar PSR map (Mazarico et al. 2011) to ensure that all selected areas were within three km from a PSR boundary. Areas of interest for morphometric analysis were picked from the 5 km by 5 km grid-map observations in areas where EHT occurred on various landscape curvatures in PSRs and non-PSRs. To ensure we sampled a wide variety of slopes for the 1 km by 1 km map, we took the median slope in each cell, sorted them into 10° slope bins, and evenly sampled from those bins. In total, we mapped 709 km2 with the 1 km by 1 km cells (352 PSR and 357 non-PSR cells, respectively).
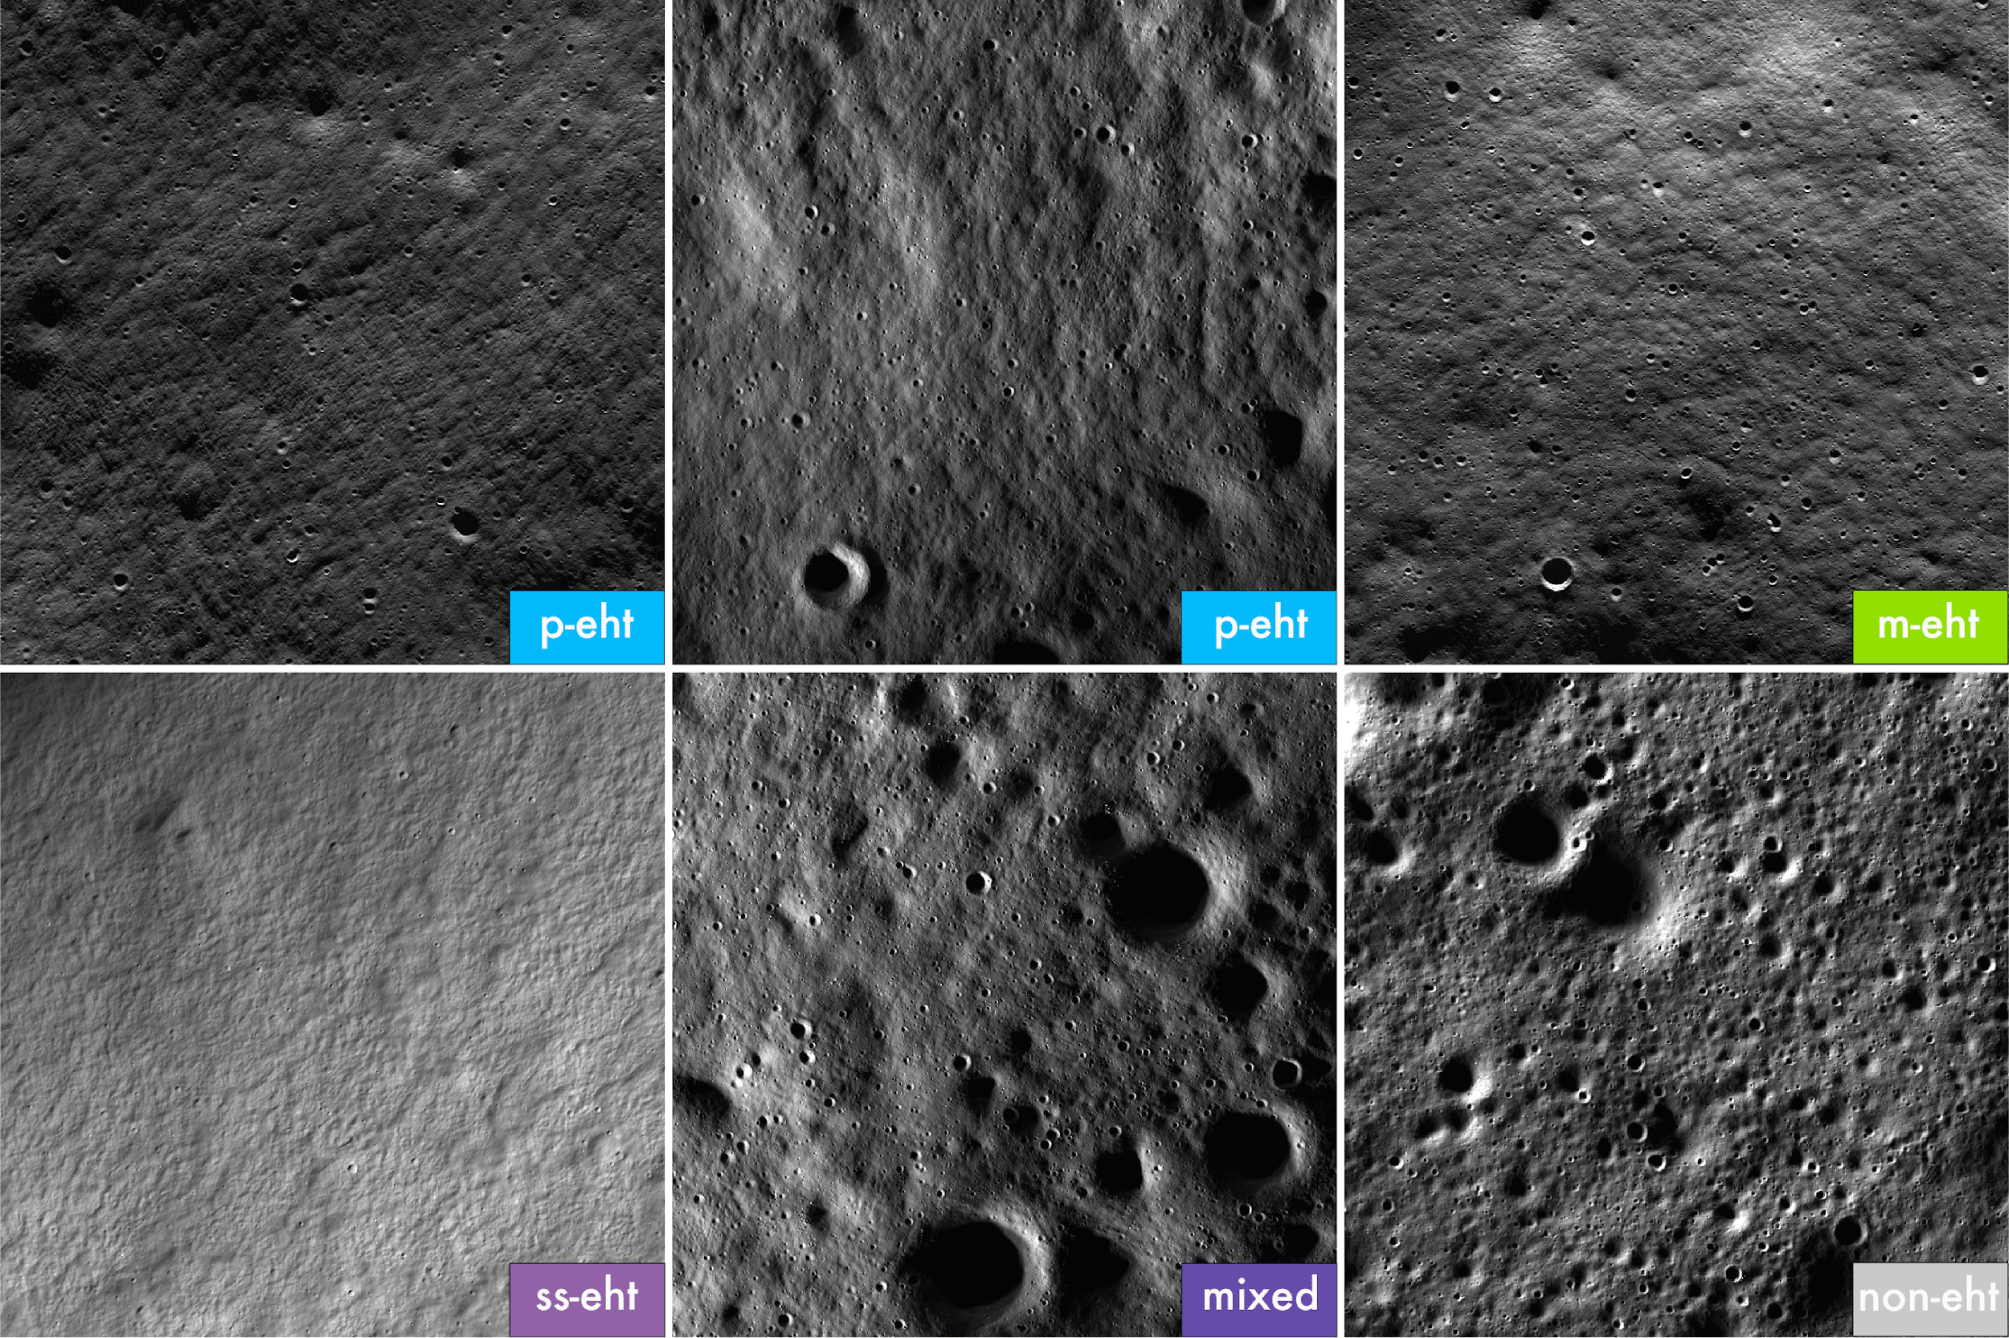
We recorded and classified the presence or absence of EHT in each cell following the work in Voelker et al. (2017). EHT was classified as dominant (covering 50% to 100% of the cell), present (covering 25% to 50% of the cell), or absent (0% of the cell; Fig. 4). EHT occurrences covering 1% to 25% of the cell were classified as having mixed morphology (Table 1). For cells containing ≥ 25% EHT, we characterized morphology based on variations of texture. These variations typically corresponded with EHT segment width, shape, and size (Figs. 5 and 6; Table 1; Section 3.2). To ensure consistent interpretation of textures during grid-mapping, mapping was conducted by one person who drew on prior experience digitizing EHT segments (Brown et al. 2024). EHT segment widths were manually measured using QGIS tools and/or visually compared to the polygonal grid cells as a scale reference. The same person then re-evaluated the grid-mapping units to ensure quality and accuracy in the results.
| Label | Texture name | Area (km2) | Description | Example location (Fig. 6) |
|---|---|---|---|---|
| p-eht | Prominent elephant hide texture | 594–2,750 | Decameter- to ~100 meter-wide hummocky “prominent” lobate to sinuous segments that are separated by meters-wide troughs and most commonly contour median slopes 5° to 15°, and less commonly appear on flat surfaces. Lineaments of varying lengths commonly cross p-eht, appearing either parallel to the slope or at a 30° to 50° cross-slope angle (depending on the lighting direction), creating a cross-hatch pattern of discontinuous rounded rhomboid shapes. |
–89.293°S, 315.575°E; –88.357°S, 336.492°E |
| m-eht | Moderate elephant hide texture | 627–1,925 | ~100- to 250-meter-wide patterns that form “moderate” or subdued lobate segments that are separated by meter- to decameter-wide troughs and contour median slopes up to 20°. Textures gradually become less pronounced as segment size increases in width (short axis). Lineaments are less distinct. | –88.915°S, 88.555°E |
| ss-eht | Stair-stepped elephant hide texture | 1,034–2,675 | Meter- to decameter-wide wavy to linear terraced segments that are separated by meter-wide benches on median slopes 15° to 35°. Wavy ss-eht resembles p-eht where terraced segments are discontinuous. Lineaments of varying lengths commonly cross ss-eht, typically appearing perpendicular to the slope. | –88.037°S, 196.547°E |
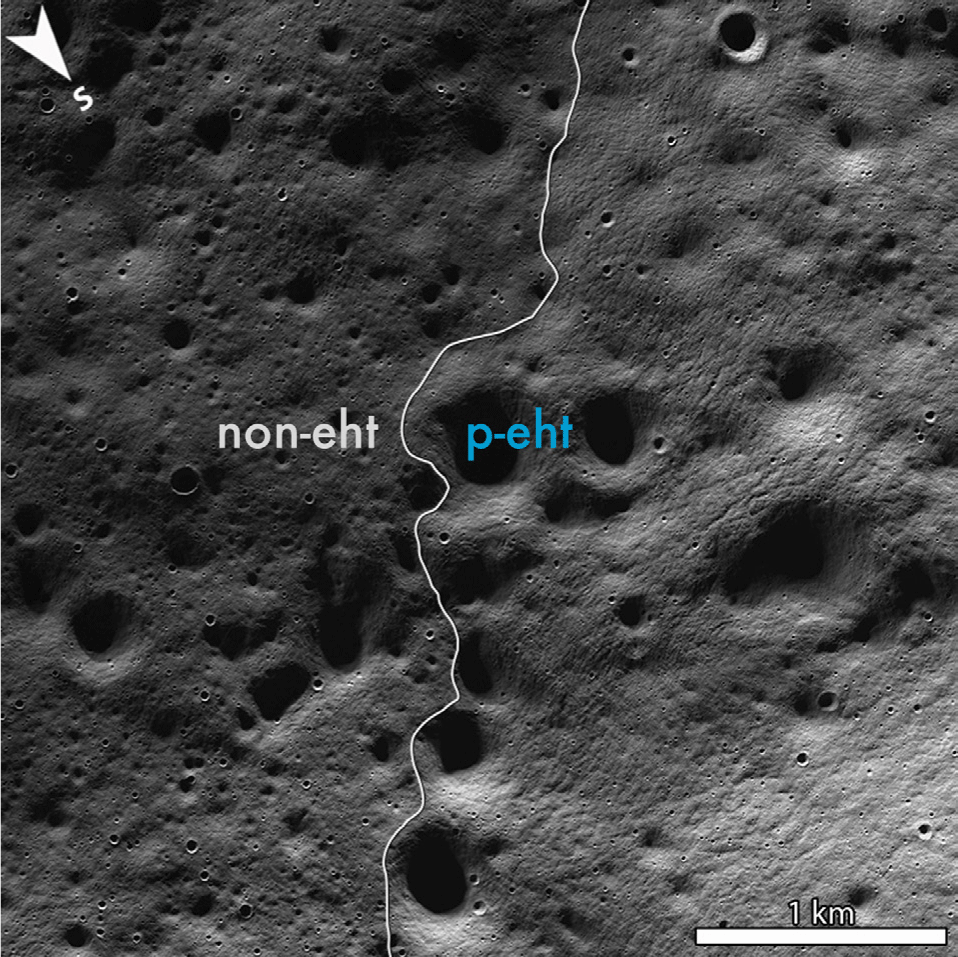
| non-eht | No observable elephant hide texture | 325 | Cratered highlands surface or smooth crater floors with no observable EHT. Median slopes ≤ 5°. | –88.162°S, 114.476°E |
| mixed | Mixture of textures | 5,075–10,170 | Unit ss-eht mixed with m-eht, p-eht, and/or non-eht. | –88.238°S, 331.477°E |
We calculated the areal coverage of textures by counting the number of cells where the texture was classified as dominant (covering most of the cell), present (covering less than half of the cell), or absent. To estimate the low end of areal coverage, we counted all dominant cells plus half the number of present cells. To calculate the upper limit, we counted both dominant and present cells as fully contributing to the areal coverage.
We used the ‘Zonal Statistics’ tool in QGIS to extract values for slope, curvature, and annual maximum surface temperature for each cell. Grid-mapped data (5 km by 5 km and 1 km by 1 km) were grouped as PSR, non-PSR, or a PSR boundary. We performed N-way analysis of variance (ANOVA; Sthle & Wold 1990; The Mathworks Inc. 2022) to test if a given variable in a cell (curvature and median slope) varied significantly (p < 0.05) among morphologic units in PSRs and non-PSRs. We performed an additional ANOVA of 1 km by 1 km cells across PSR to non-PSR boundaries to investigate the effect of temperature changes on segment width. Additionally, we tested how frequently each texture unit occurred at a given slope using all of our 1 km by 1 km cells.
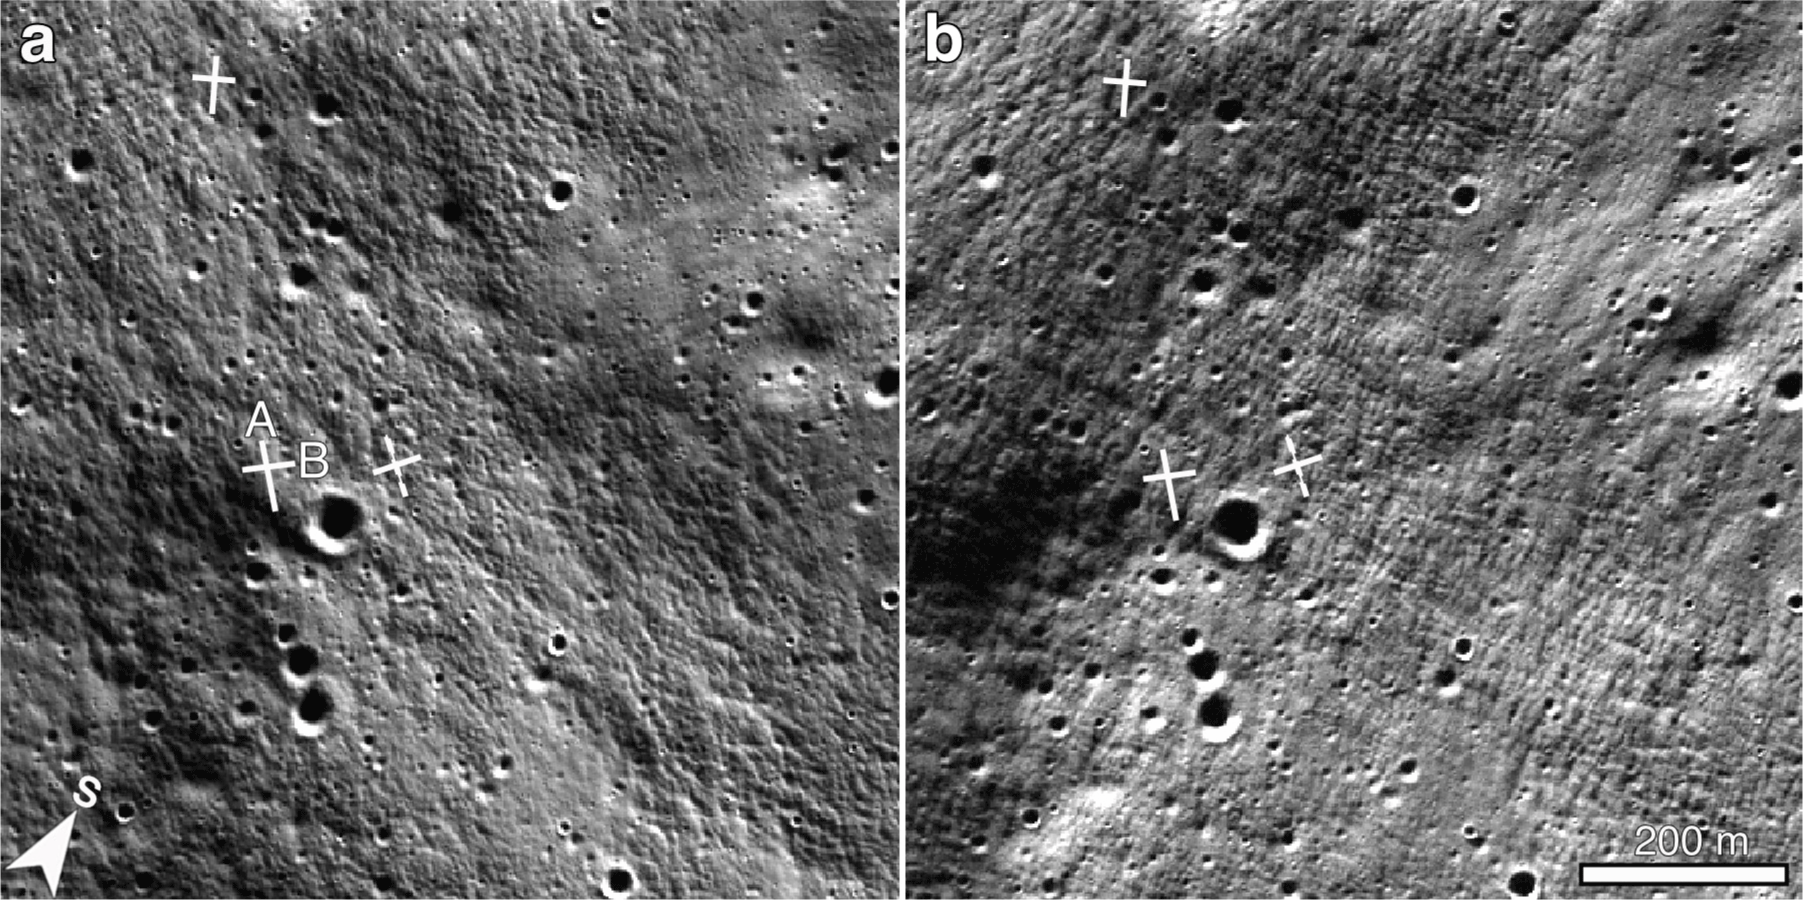
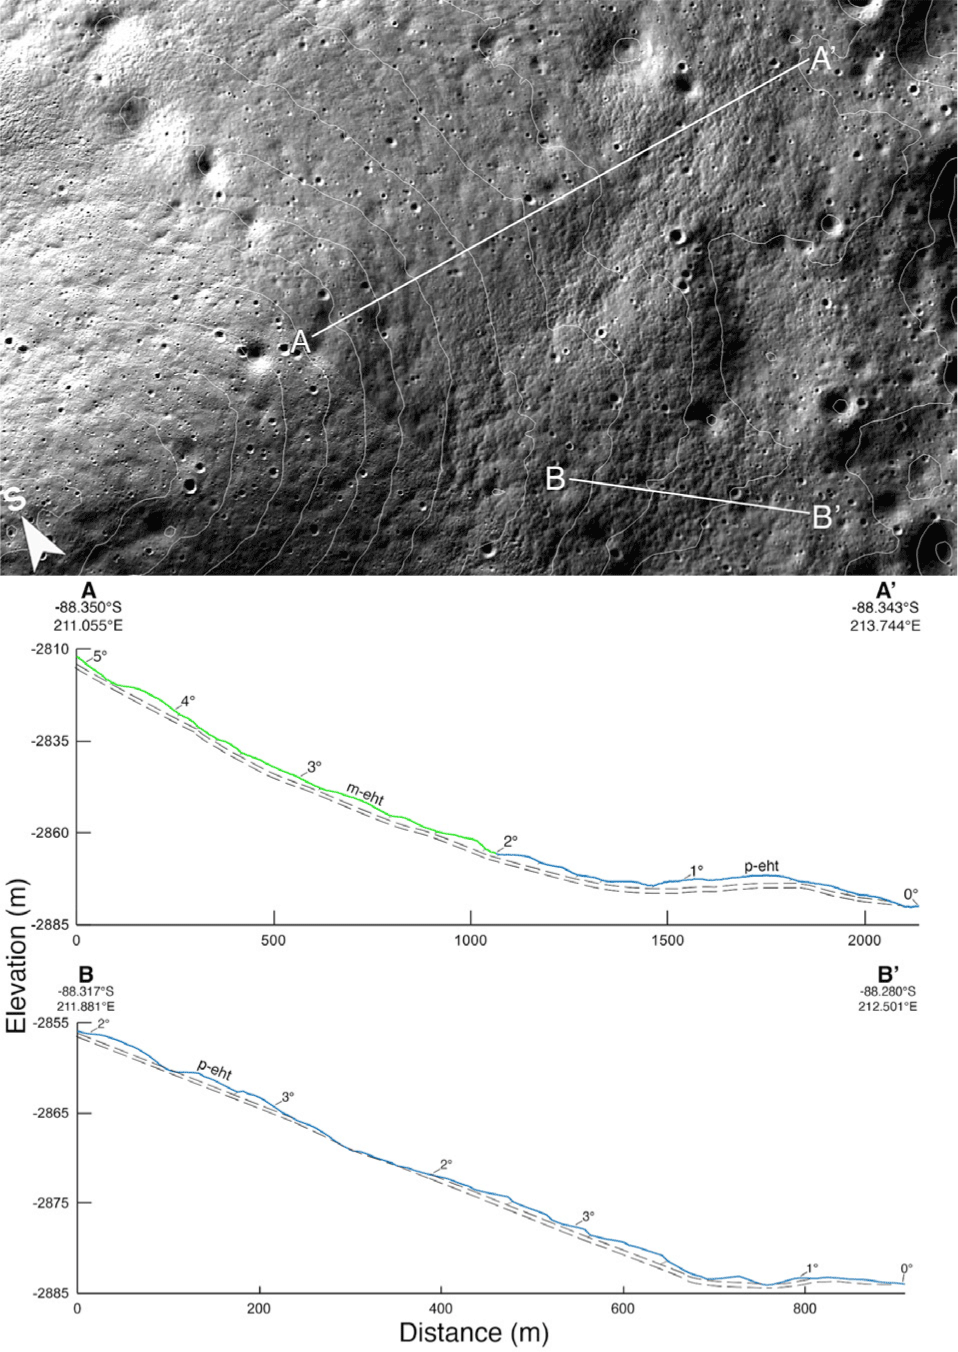
Lastly, we digitized and measured lobate EHT segments in two local areas, Sverdrup crater floor (–88.332°S, 211.907°E; Fig. 7 and Supplementary Table S2) and an unnamed illuminated area near -88.047°S, 327.892°E (Fig. 1), to (1) study how EHT morphology, or segment width, changes with respect to hillslope shape, position on hillslope, and slope gradient, and (2) derive and estimate the scale of EHT-associated topography. Our grid-mapping results of EHT locations informed our decision to target these locations for detailed morphometric analysis. In addition, we chose the mound on the floor of Sverdrup due to overlap with a high-resolution 6-meter/pixel ShadowCam DEM (Manheim et al. 2024), which allowed for rough estimates of EHT height. Since the direction of illumination can alter the perceived orientation of EHT segments (Fig. 5(a) and (b)), we used subsolar longitude mosaics with subsolar azimuths at 255° to 305° for the illuminated site and six ShadowCam images that varied by season (December to February) and sun direction (east and west) for the Sverdrup PSR. We only used EHT segment measurements that were consistent across multiple lighting directions. In total, we mapped ~4 square km at a 1:5,000 scale across both sites.
3. RESULTS
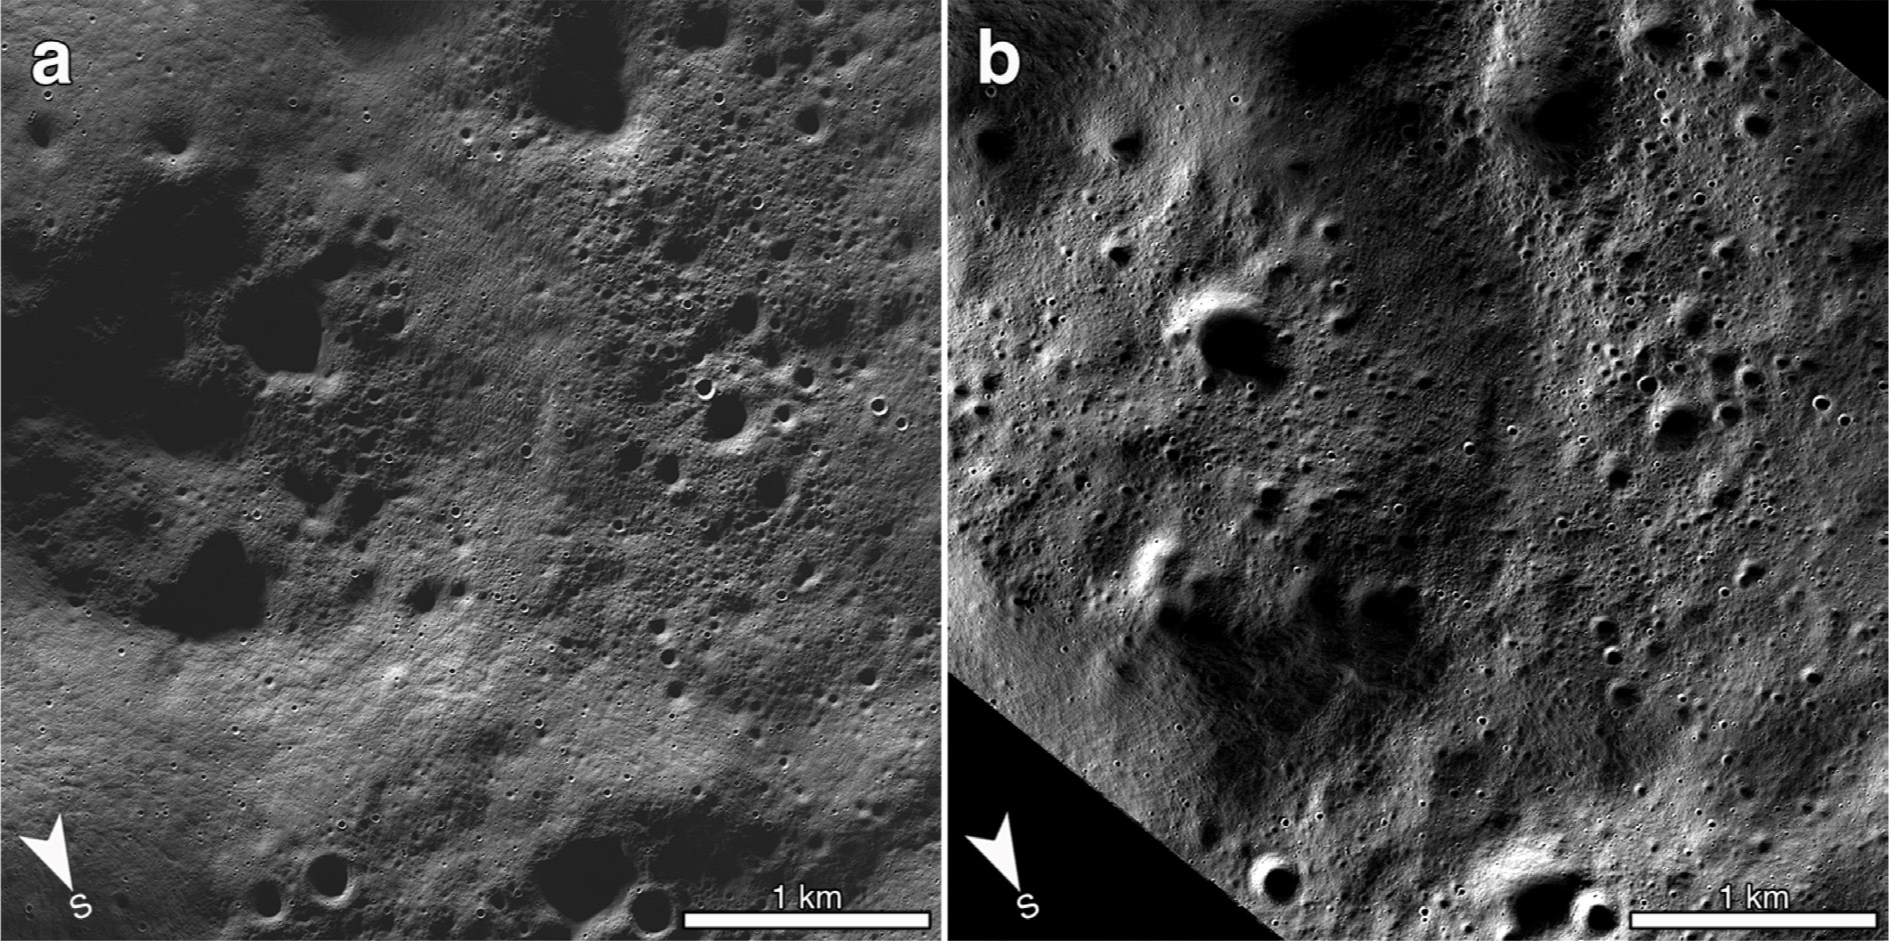
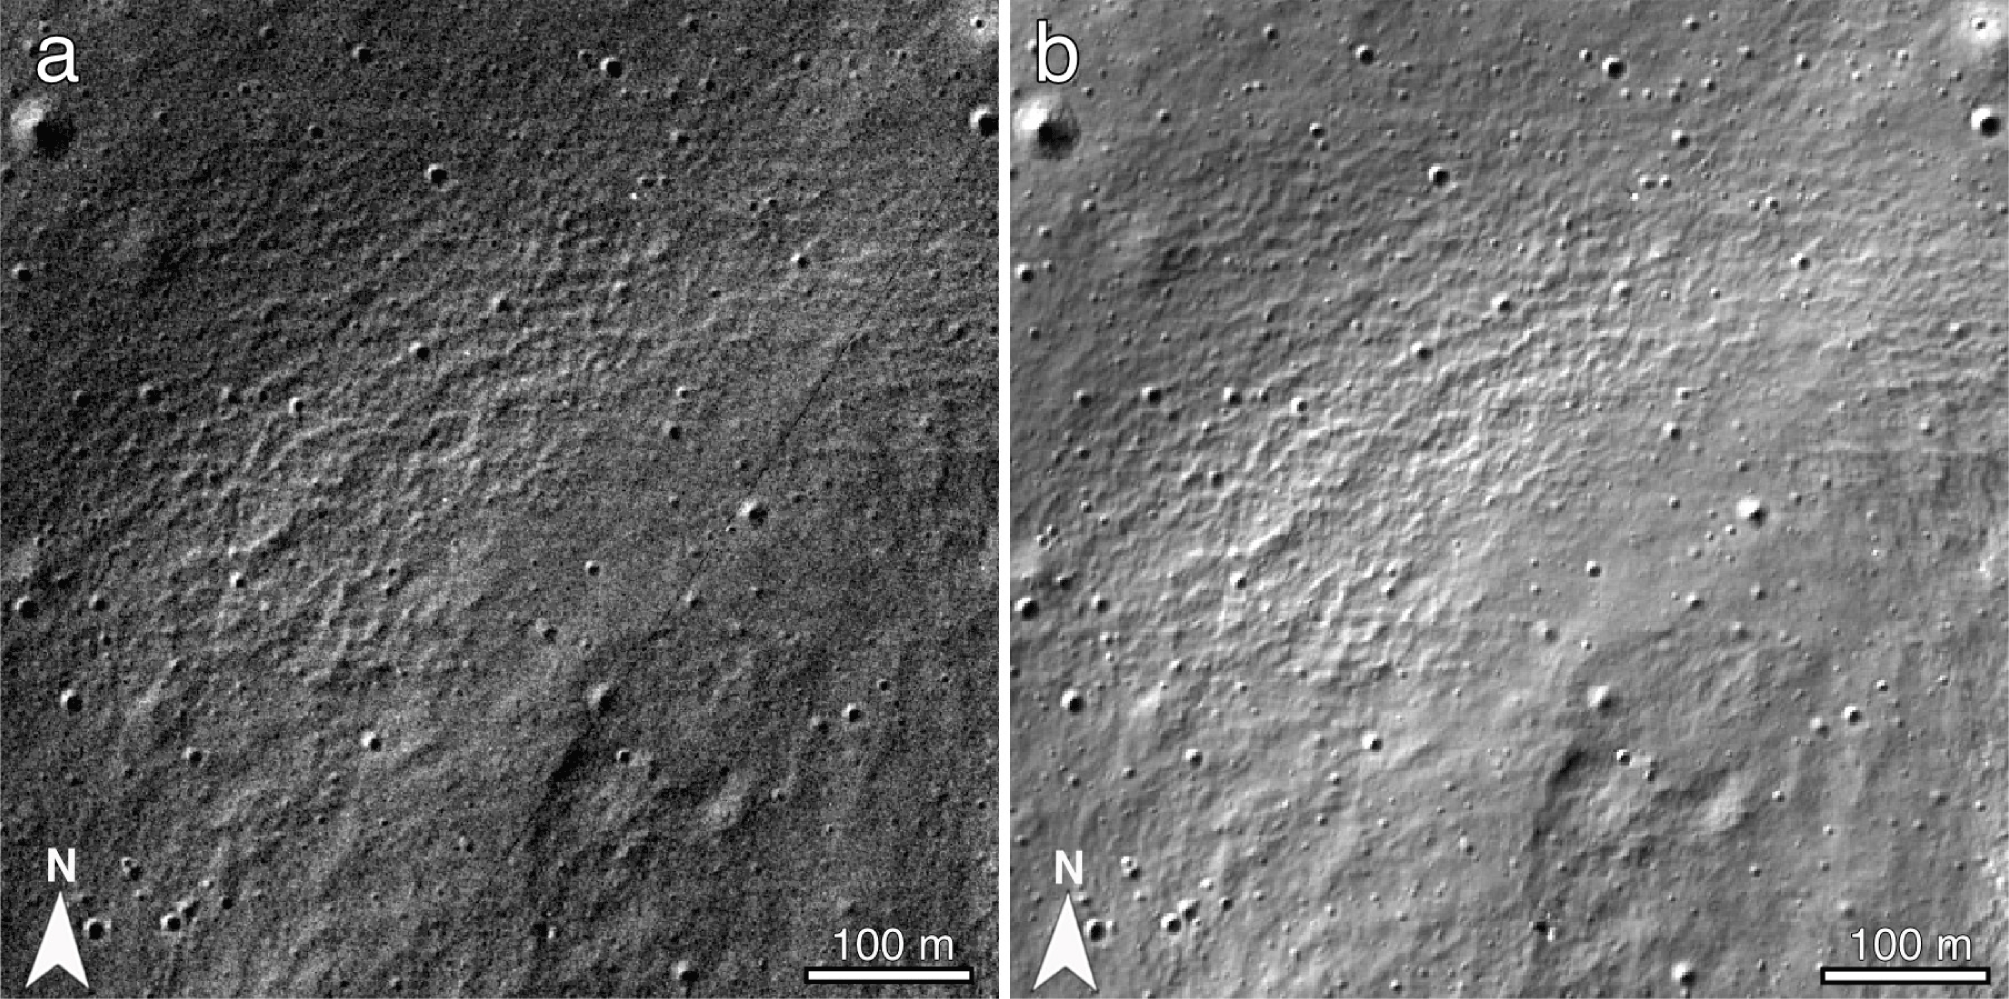
We find that diffuse lighting does not affect our ability to identify EHT. For example, on both sloped and flat surfaces, we identified EHT morphology in all of the co-located NAC (illuminated) and ShadowCam (temporarily shadowed) images using the 5 km by 5 km and 1 km by 1 km cells (127 and 178 cells, respectively). We only mapped different geomorphic units at ~3% of co-locations, which were near PSR boundaries. At these co-locations, we mapped prominent EHT (p-eht) in ShadowCam images vs. moderate EHT (m-eht) in NAC images. This may be due to poor lighting at the shadow edge in NAC images. For the co-located images where we identified the same texture, EHT typically varied in appearance due to perceived orientation (Fig. 5). Unit m-eht was sometimes easier to identify in ShadowCam images.
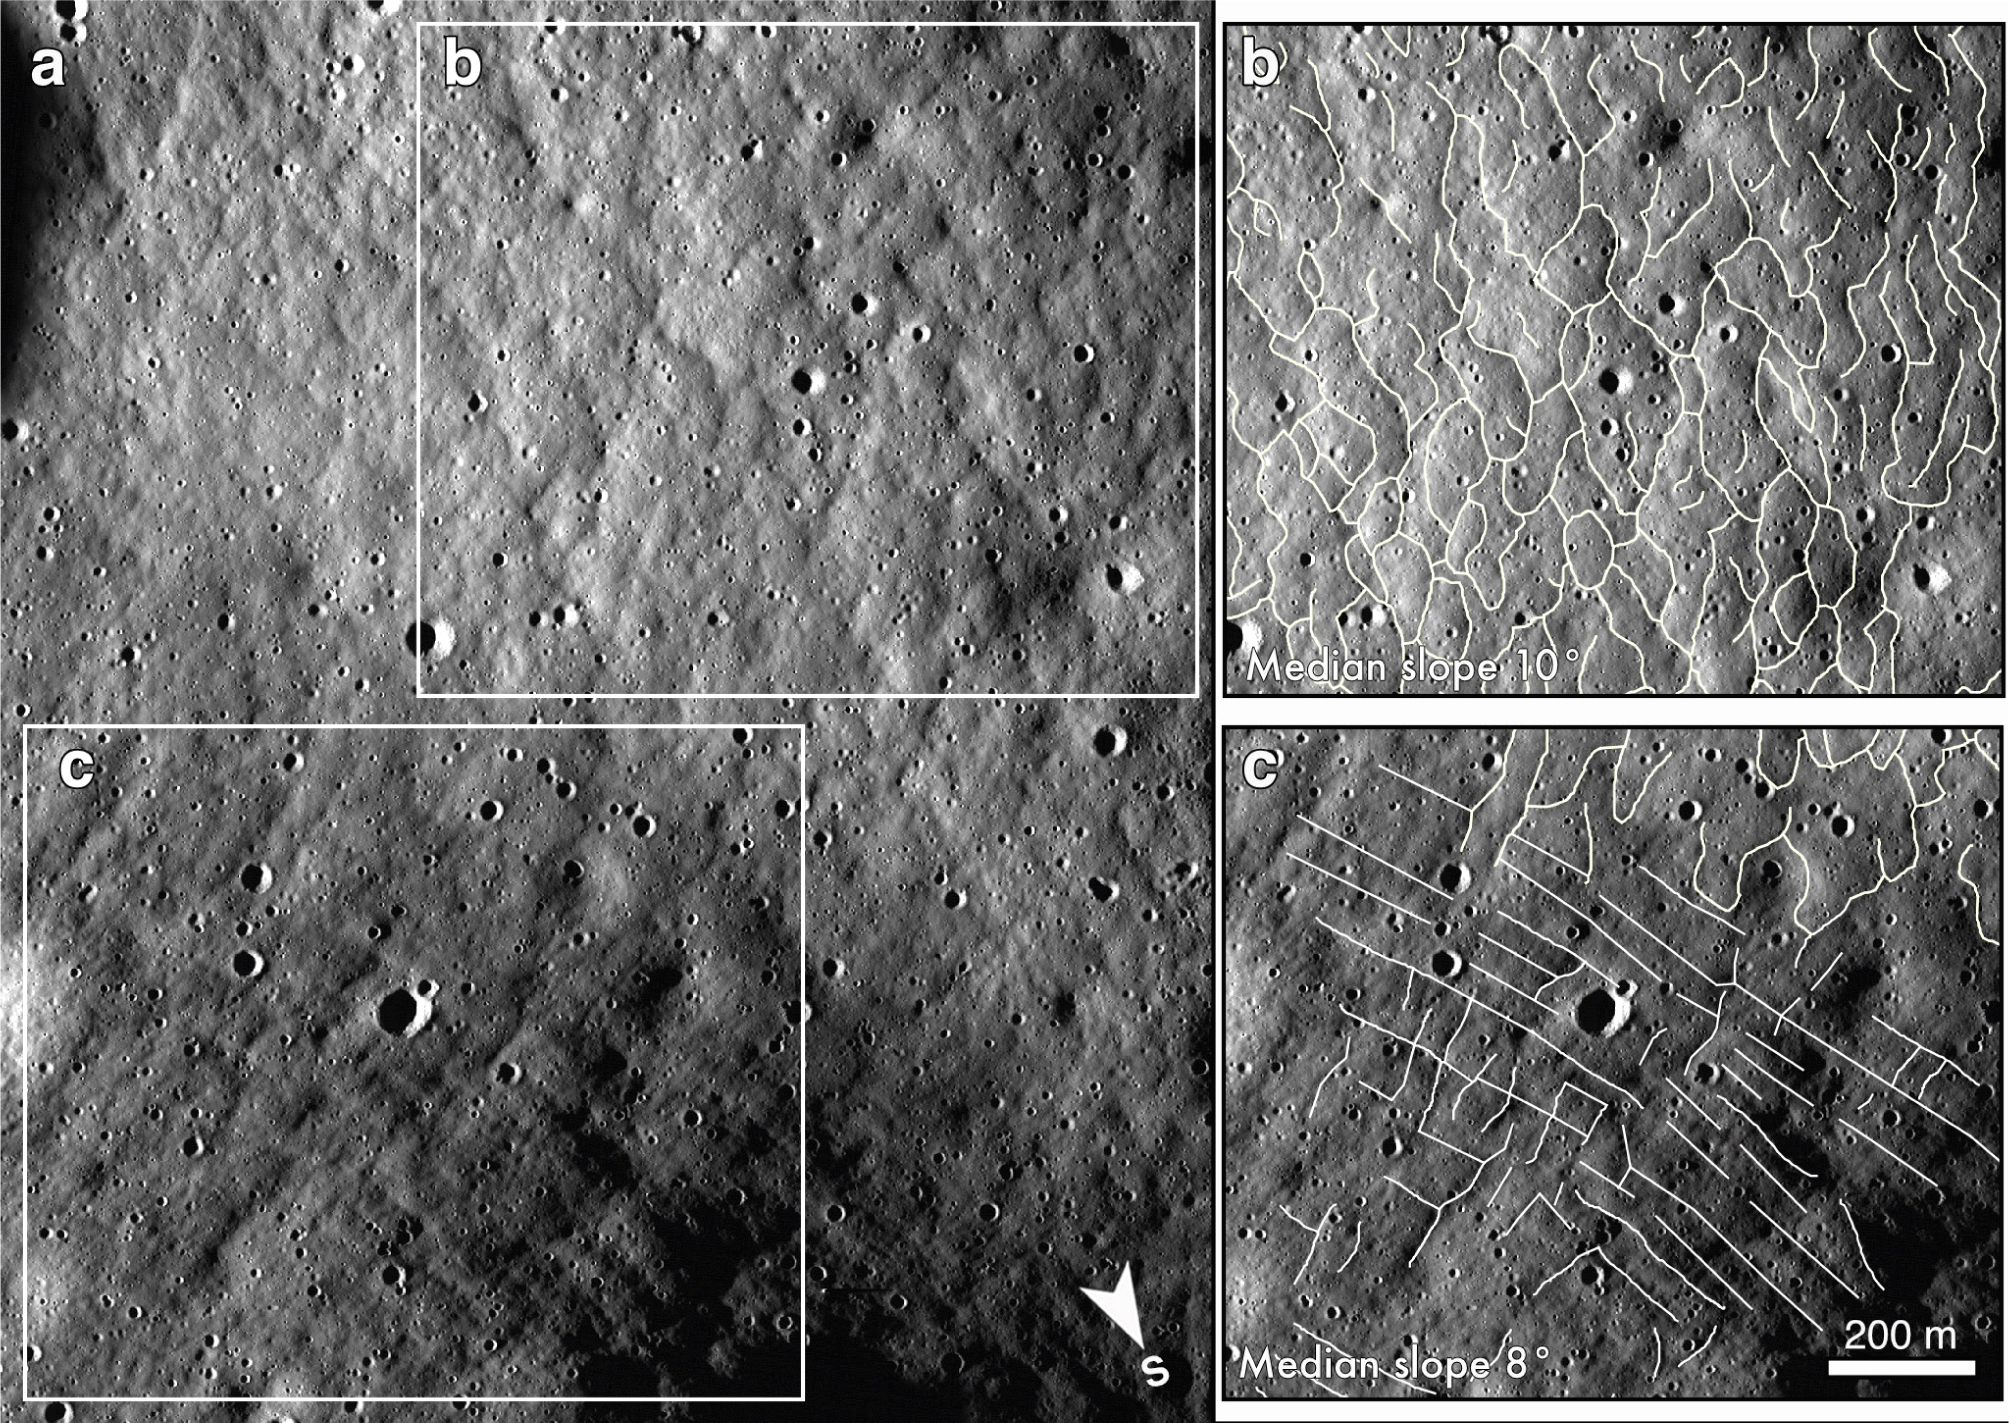
Within our map area (5 km by 5 km cells), five morphologic units were identified (Table 1; Figs. 6 and 8): three types of EHT that we differentiated by segment width and intensity (prominent vs. moderate), surfaces completely devoid of EHT, and mixed EHT morphology within a cell (EHT and non-EHT). Contacts between EHT units are gradational and contacts between EHT and non-EHT are distinct. When we compared EHT across multiple sun azimuths, we found that the segment width (short axis) of all EHT units parallels the down-slope direction. Lineaments of varying lengths commonly cross EHT units and appear perpendicular to the slope (Fig. 5). Cells with a mixture of EHT and non-EHT are the most extensive unit, covering 43.5% of the map area.
Prominent hummocky patterned regolith texture composed of decameter- to ~100 meter-wide lobate to sinuous segments separated by meters-wide troughs. Unit p-eht is observed on moderately gentle to steep talus slopes (5° to 15°), where transport is dominant, and on convex, concave, and (less commonly) flat-lying surfaces at the base of these slopes, where deposited material accumulates (Figs. 9 and 10). This texture is blanketed by meter-wide surficial lineaments of varying lengths that typically appear perpendicular to the slope (depending on the lighting direction) that together create a cross-hatched pattern of discontinuous, rounded rhomboid shapes (Figs. 1 and 6). Textures are most pronounced on the talus and toe of slopes, regardless of vertical or horizontal curvature in the landscape (Fig. 10).
A less pronounced or subdued version of p-eht, with ~100- to 250- meter-wide lobate segments separated by meter- to decameter-wide troughs that most commonly contour median slopes up to 20° (Fig. 9). The hummocky texture gradually becomes less pronounced as segment size increases in width (short axis). Cross-hatched patterns typical of p-eht are commonly absent. Unit m-eht typically occurs on convex surfaces along and cross-contour, and on broadly-sloping pediments of gentle hillslopes ≤ 10° (Fig. 7).
A variation of EHT that forms a stair-stepped pattern, with meter- to decameter-wide wavy to linear segments that are separated by meter- to decameter-wide benches on median slopes 15° to 35° (Fig. 9). Wavy meter-scale ss-eht resembles p-eht with discontinuous terraced segments. Lineaments of varying lengths commonly cross ss-eht, typically appearing perpendicular to the slope. On median slopes 20° to 35°, we commonly see p-eht interspersed with stair-step textures. Unit ss-eht most commonly occurs on inner crater walls, or on steep-sloped surfaces where regolith is thinned.
Cratered highlands surface or smooth crater floors with no observable EHT. Occurs on flat-lying to near-flat-lying areas (≤ 5°; Fig. 9) past the toe of a slope. Unit non-eht displays sharp contacts with p-eht and ss-eht.
Unit ss-eht mixed with m-eht, p-eht, and/or non-eht. We mapped this unit when no dominant texture was discernible within a cell.
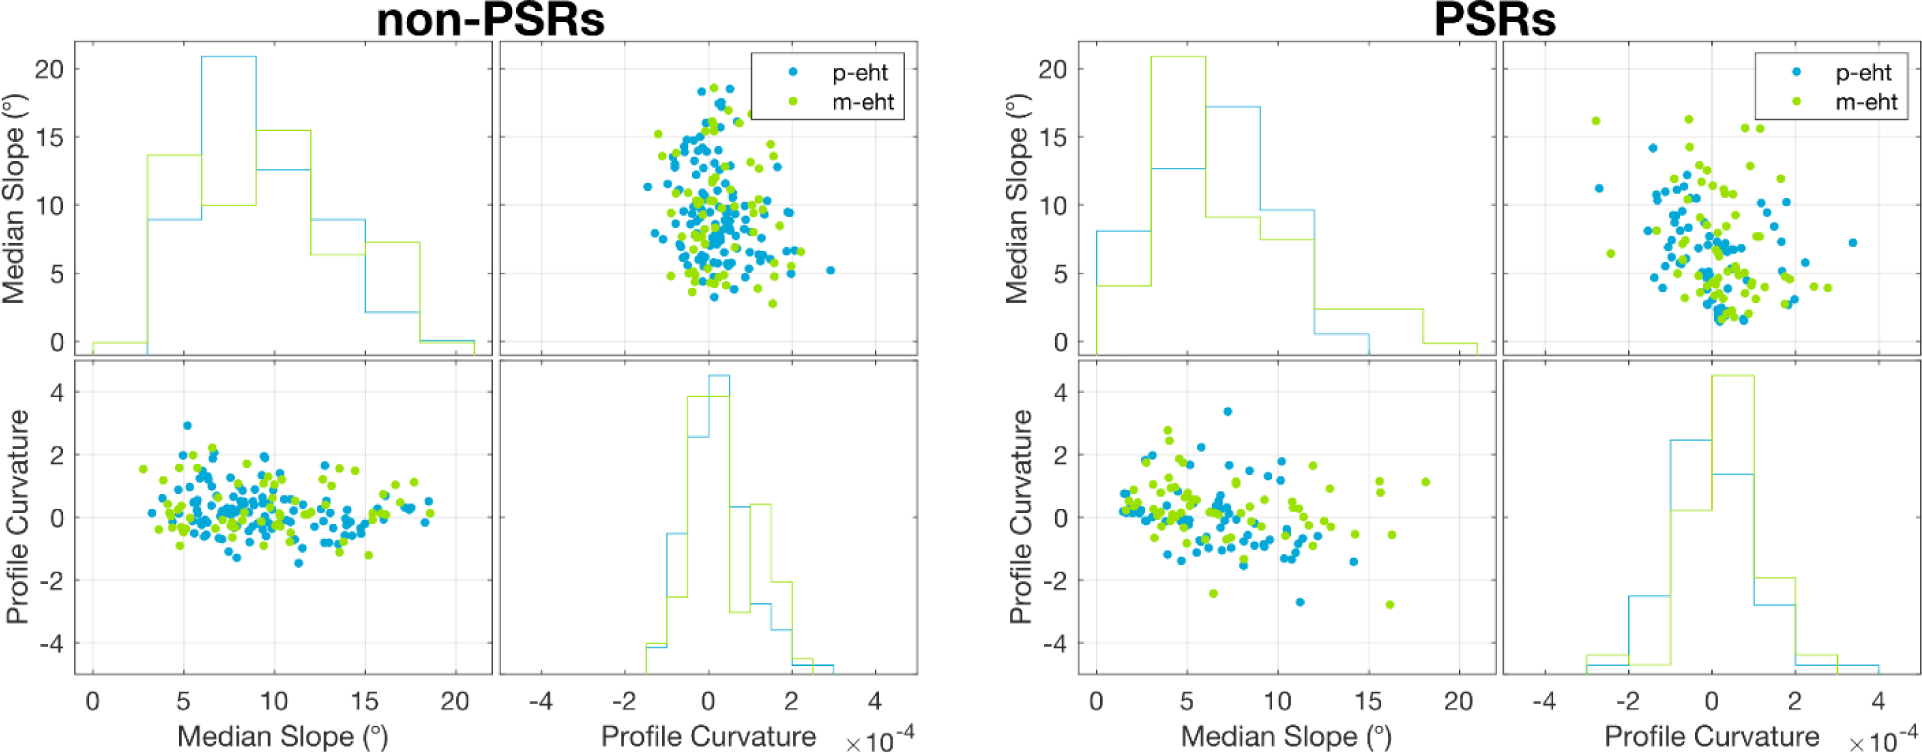
When comparing morphologies at 1:20:000 (1 km by 1 km) scale (Fig. 9), we found that both the landscape shape (curvature along and across contour lines) and slope position (distance from hillcrest) affect EHT morphology. Because unit m-eht is the most common morphology on convex surfaces at different positions along hillslopes, we interpret this unit to be regolith that diverged laterally downslope to create longer, or more subdued, EHT segments. In contrast, the higher-intensity EHT (p-eht) and associated cross-hatched pattern (Crittenden 1967; Greeley 1971; Mattingly et al. 1972; Swann et al. 1972) likely form in a loose regolith where diffuse transport and deposition of material is most efficient (Anderson & Anderson 2010). The wavy to linear “stair-step” EHT (ss-eht) likely forms in the active transport layer of steep slopes ≥ 20° where regolith mobility is high (Anderson & Anderson 2010). EHT on flat surfaces (≤ 3°) occurred less than ~500 m from the landform base. All of this suggests that as material moves downslope both vertically and laterally, it forms crested segments of EHT. In Section 4, we discuss the factors that most likely form and “preserve” EHT over time.
Illuminated and permanently shadowed terrain within the 5 km by 5 km map cells have similar areal coverage but differ slightly in surface age (88% of non-PSRs and 73% of PSRs are pre-Nectarian) and slope distribution (Fig. 9). When comparing EHT in Pre-Nectarian terrain only, we see that the frequency of EHT occurrence in PSRs is similar to that of the illuminated surface. EHT is present across all surface ages in the map area (Pre-Nectarian to Eratosthenian). We mapped more EHT in non-PSRs (81%) than in PSRs (53%). We posit that this difference is due to a higher distribution of near-horizontal surfaces on large permanently shadowed crater floors, as surfaces devoid of EHT are most likely to occur on slopes ≤ 5° (Fig. 9).
Using the ANOVA results, we found that median slope varies significantly between PSR and non-PSR cells only for unit p-eht (p-value = 0.006), while the median slope for the remaining geomorphic units showed no significant difference (p-value = 0.2 to 0.9) between PSRs and non-PSRs. An explanation as to why we do not see prominent EHT (p-eht) at slopes ≥ 15° in PSRs than at the same slopes in non-PSRs (Fig. 9) could be because wavy stair-step textures (unit ss-eht) can resemble unit p-eht at slopes ≥ 15° (Section 3.2; Fig. 9). It is possible that we mapped stair-step textures (unit ss-eht) instead of unit p-eht at slopes ≥ 15°, indicating that prominent EHT likely occurs at slopes of 15° to 20° in PSRs. Using the slope frequency results, we also found that units p-eht and m-eht occur on shallow slopes ≤ 5° and median slopes 6° to 14° in both non-PSRs and PSRs (10% frequency difference), which suggests that the regolith properties in PSRs that are relevant to EHT formation are not significantly different from those of the illuminated surface (Fig. 9(a)).
Additionally, we find that segment widths between units p-eht and m-eht did not significantly vary across PSR temperature boundaries (90° to 200° change in temperature) or from PSR to PSR (Fig. 9(b)), which we would expect if temperature was correlated with EHT morphology. We also did not observe a relationship between EHT occurrence and temperature gradients due to local shadowing, as EHT did not display a pole-facing or equator-facing distribution pattern. All this suggests that illuminated and permanently shadowed terrains have similar surface morphologies, consistent with the results of Bernhardt et al. (2022) and Basilevsky et al. (2024).
The EHT segments that we digitized ranged from 40 to 300 m in length (long axis) and 18 to 150 m in width (short axis) at our two areas of interest (Section 2.2). EHT at the unnamed illuminated area near –88.047°S, 327.892°E (Fig. 1) displayed larger lobate segments compared to EHT on Sverdrup mound (Fig. 7) with median L/W of 120/62 vs. 81/34 m. The mound on the floor of Sverdrup crater shows varying EHT morphologies as a function of slope position. For example, a subdued EHT occurs on convex surfaces of the mound (summit to shoulder; 3° to 5° slopes), and transitions into a higher intensity EHT on the slope pediment to near flat surfaces on the foot of the slope (Fig. 7). At the unnamed illuminated site, both linear and lobate prominent EHT segments occur on a degraded crater’s shoulder to inner wall (median slopes 8° to 9°). We posit that hillslope position and curvature affect the segment sizes of EHT at the two sites, given that we observed subdued EHT commonly on convex slopes (Fig. 10) and prominent EHT at the foot of slope pediments in and out of PSRs (Fig. 11(a)–11(c) and Fig. 12). As described earlier, diffuse lighting did not affect our ability to identify the textures (Fig. 11(c) and 11(d)).
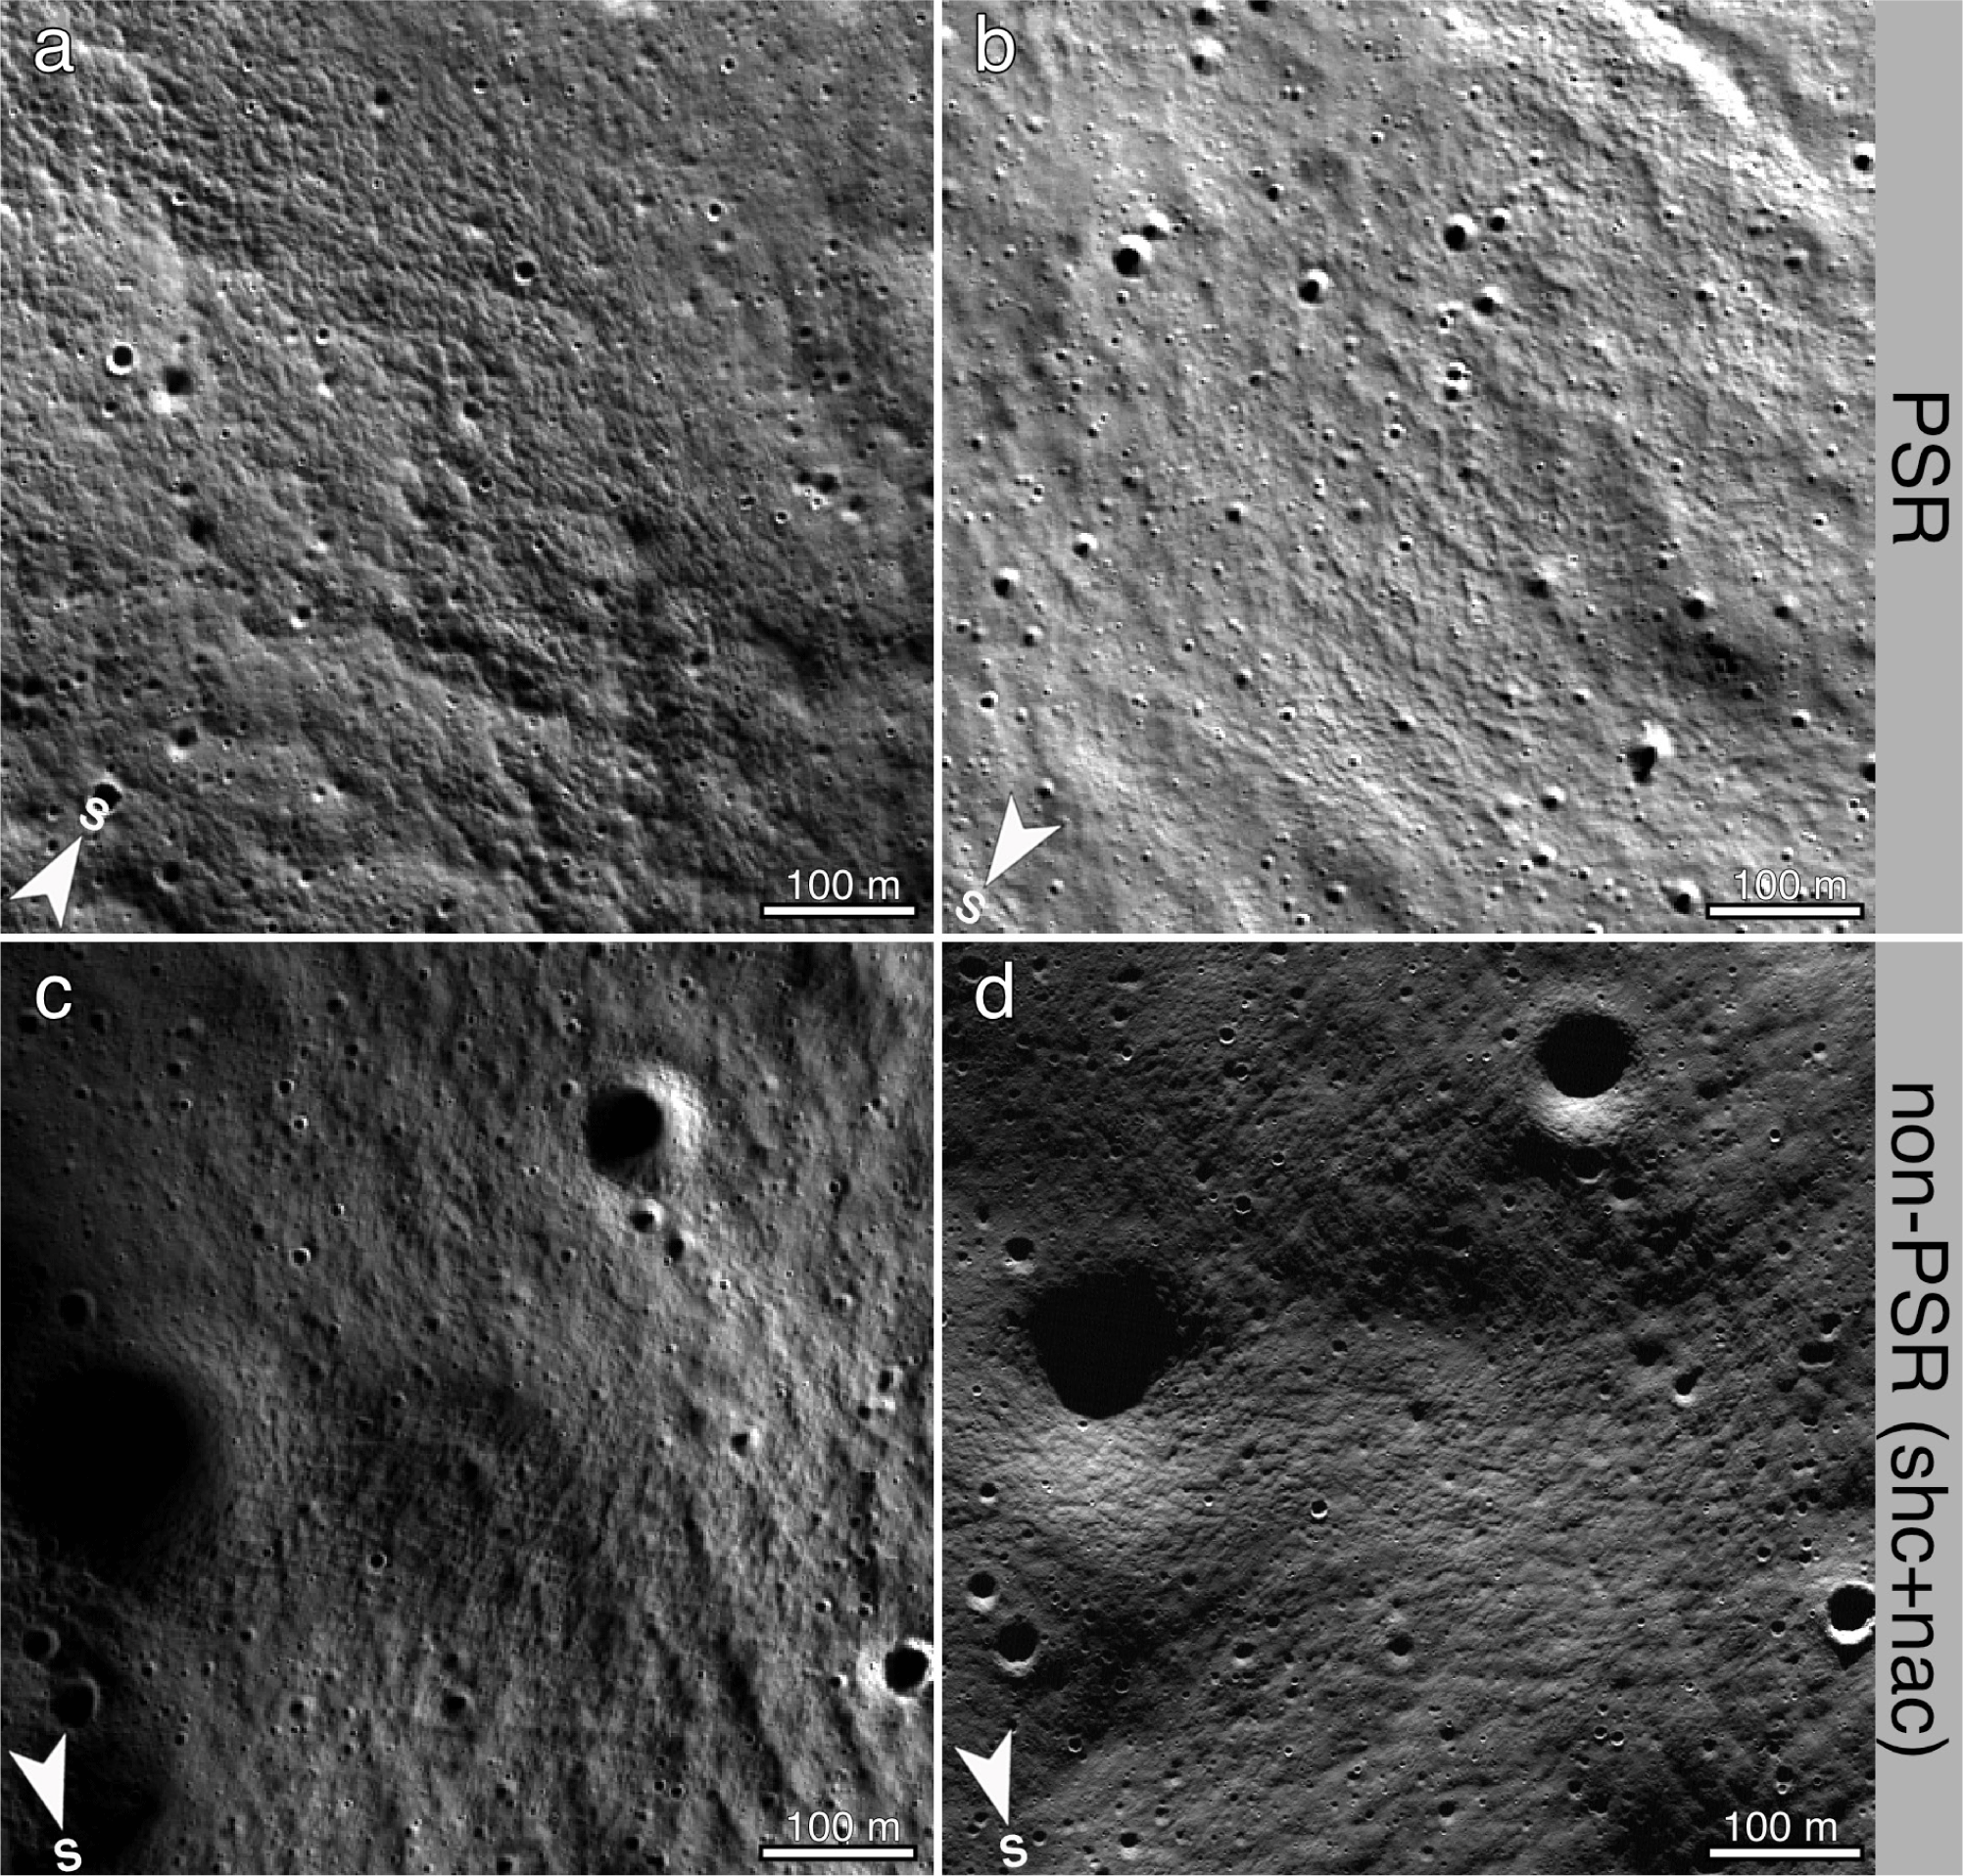
The high-intensity EHT segments on Sverdrup mound are unique in our grid-map area (the most similar EHT morphology in a non-PSR is shown in Fig. 11(c) and 11(d)). To find a non-PSR texture analog, we searched ShadowCam images of equatorial craters partially in shadow to simulate indirect lighting conditions. We selected the ShadowCam image of Weber crater (50.163°N, 236.017°E) that most closely matched the PSR lighting geometry based on Weber crater’s comparable geology with Sverdrup. When we compared the EHT in the ShadowCam image to co-located LROC NAC large-incidence angle images, we found no significant differences in morphology (Fig. 12). This suggests that EHT morphologies (L/W and slope) are similar across PSR to non-PSR terrain and across different latitudes.
To derive a lower-limit height of surficial EHT using the ShadowCam DEM (with 1 to 2 m of uncertainty), we assume a uniform bedding surface and a lobate profile to create a triangle in which to measure segment length and height (Fig. 13). To do this, we collected x, y, and z data points at three positions on each segment (the base and summit), given sharp EHT segments in the DEM orthophoto (M016822289S). Note that the EHT segment base measurements may not represent the whole extent of a deformable EHT-layer thickness. Next, we used the x, y, and z distances between the points to obtain the length of each segment side using the Euclidean distance formula. Then, we derived the height of the triangle for each surficial segment:
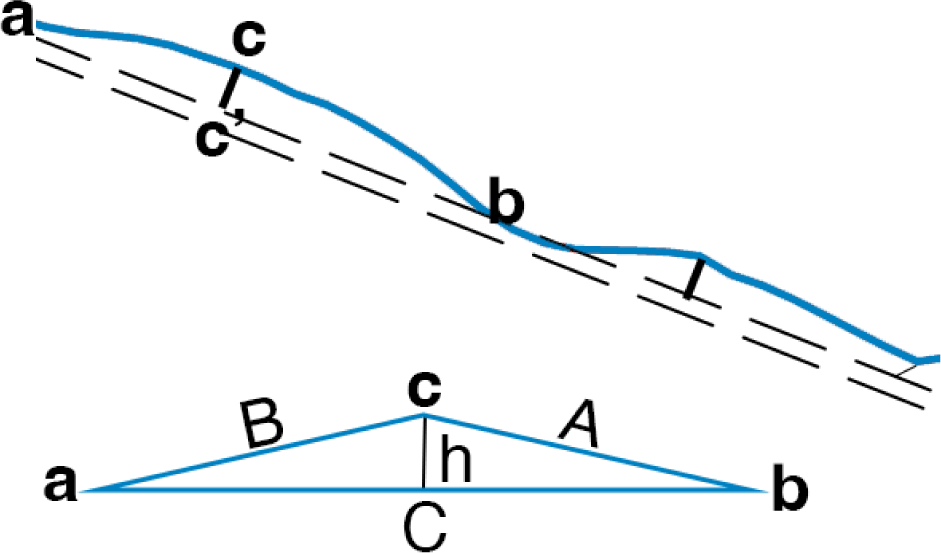
where s is:
The EHT segments that we derived to be roughly 2 to 5 m tall correspond with a lobate elevation profile in the ShadowCam 6-meter/pixel DEM (Figs. 7 and 13). Some EHT segments estimated to be < 2 m tall were resolvable in profile; however, we did not interpret them in cross section because these features are at the limit of the DEM uncertainty and were not identifiable in one of our ShadowCam images (Fig. 5(b)). To interpret the resolvable EHT segments in cross section, we assume a uniform bedding surface on a linear, diffusive hillslope, where the contact between two EHT segments represents the surface (Fig. 13). When we fit this shape in cross section to the resolvable EHT on Sverdrup mound, we find the lower limit of surficial EHT height to be 0.5 m (Fig. 7). Thus, we roughly estimate that the regolith layer deformed by EHT is at least 0.5 to 5 m thick (with 1 to 2 m of uncertainty on the upper limit). It is possible that the deformable EHT layer may extend below the mapped surface expression of the EHT segment base (Fig. 13 and Supplementary Fig. S1), potentially reaching depths of ~10 m, or up to the depth of the highland regolith column (Heiken et al. 1991). We did not derive EHT height estimates elsewhere in the map area due to the lack of meter-scale DEMs needed to resolve EHT topography.
4. DISCUSSION
Classic models of landscape evolution on airless bodies predict that small-scale topographic features like EHT are short-lived (10 to 100 Ma) due to small primary impacts that smooth surface topography over time (Culling 1960; Ross 1968; Soderblom 1970; Pelletier 2008; Fassett & Thomson 2014). Recent workers have shown that nonlinear diffusion (scale- and slope-dependent erosion and transport) more accurately models the observed equilibrium populations of lunar craters (Speyerer et al. 2016; Minton et al. 2019; Fassett et al. 2022; O’Brien & Byrne 2022). However, modern topographic diffusion models still do not explain the persistence of EHT (Gold & Williams 1973; Houston et al. 1973; Kreslavsky et al. 2021, 2023). It is possible that the diffusion parameter in these models (Minton et al. 2019; Fassett et al. 2022; O’Brien & Byrne 2022) may not adequately capture EHT-scale features or may misrepresent the dominant processes that form them (Houston et al. 1973; Kreslavsky et al. 2023).
The presence of both subdued and prominent EHT across similar slopes indicates that diffusion of material must vary nonlinearly, consistent with findings from Kreslavsky et al. (2023) and O’Brien & Byrne (2022). Modern diffusion models are limited to predictions of how material moves at the surface (Li & Mustard 2000). Multiple factors that could constrain the survivability of EHT on the surface remain unaccounted for, including movement of particles at depth, degree of compaction, cohesion, and particle sorting (O’Brien & Byrne 2022). As such, an explanation for the variation of EHT across slopes is that heterogeneous subsurface regolith properties influence transport and affect how the mobile segments of EHT form at the surface. It is also likely that regolith creep driven by periodic seismic shaking contribute to variations of EHT across the surface.
Thermal cycling contributes to regolith formation on airless bodies (Ross 1968; Delbo et al. 2014; Molaro et al. 2015, 2017) and drives subsequent creep (Duennebier 1976; Melosh 2011; Bovie et al. 2023). However, it is still unclear how long-term thermal cycling drives creep on the Moon. Thermal cycling at the diurnal timescale is strongest in the top few centimeters of regolith (Hayne et al. 2017; Bovie et al. 2023), and temperature variations over millions of years may penetrate to a depth of ~1.5 to 2 m (Langseth et al. 1972; Anderson & Anderson 2010). Across the lunar surface, diurnal temperature amplitude varies significantly with latitude, slope orientation, and topographic shadowing (Bandfield et al. 2011, 2015; Gläser et al. 2021). If thermal cycling drives EHT-related movement, we would expect to see differences in EHT near the equator relative to polar regions, in local equatorial slopes (with the highest temperature amplitude), and within seasonally shadowed regions near the poles. However, previous work has shown no significant difference in the global distribution of EHT (Xiao et al. 2013; Kreslavsky et al. 2021; Bondarenko et al. 2022).
Multiple studies postulate that PSRs have less compacted regolith (high porosity and/or reduced cohesion) (Hayne et al. 2017; Metzger et al. 2018; Bürger et al. 2024) in the upper few centimeters when compared to non-PSR terrain due to smaller thermal amplitudes (Williams et al. 2019). Given this, one would expect that loose regolith on shallow slopes in PSRs would be more easily mobilized. We did not observe evidence of this, however. Currently, thermal cycling experiments have only shown how terrestrial granular materials (Divoux 2010) and lunar regolith (Metzger et al. 2018) behave under a short-term laboratory environment. The delta temperature threshold required for long-term thermal erosion and deposition of ancient lunar soils is unknown. Since PSRs are thought to have lower regolith thermal expansion (due to minimal temperature variations) in comparison to non-PSRs, we mapped the frequency of occurrence of EHT across PSR to non-PSR temperature boundaries (90° to 200° change in temperature; Fig. 9) to search for a change in EHT. We found that geomorphic units occur at all temperatures across these boundaries (Supplementary Fig. S2), indicating that thermal cycling does not play a key role in EHT formation.
Periodic seismic shaking induced by secondary impacts, tidal stresses, and global contraction due to interior cooling likely contribute to variations of EHT across the surface. Experiments show that vibrations both compact and re-loosen regolith depending on vibration amplitude (amplitudes as low as ~0.02° g could cause regolith disturbance) (Divoux 2010; Gamsky & Metzger 2010; Metzger et al. 2018; Watters et al. 2024, Schmerr et al. 2025). We can infer that seismic shaking could both form and degrade EHT, especially on steep slopes and areas with low cohesion (Antonenko 2012; Watters & Schmerr 2025). Heterogeneity in the subsurface geology could also influence seismic wave propagation (Schmerr et al. 2025). This may be another explanation for the variation of EHT across slopes. If seismic shaking due to tectonic stresses periodically drives EHT formation, we might expect to see morphologic evidence of disturbed regolith near the thousands of globally distributed fault scarps (Watters et al. 2015; Watters et al. 2024), perhaps even up to 30 km from a young surface quake epicenter (Kumar et al. 2019; Watters et al. 2019). We did not observe evidence of this in our map area, however. More research is needed to understand how lunar seismic shaking disturbs regolith on flat surfaces to create EHT.
EHT has been observed on one other airless body, Mercury. Using Mercury Dual Imaging System (MDIS) (Hawkins et al. 2007) images at < 2.5 m/pixel, Zharkova et al. (2020) found that EHT segments on Mercury are less abundant and up to ~8 times shorter than on the Moon. The authors posit that this may be due to increased rates of topographic diffusion in comparison to the Moon (Cintala 1992; Braden & Robinson 2013; Fassett et al. 2017) and, therefore, small-scale features degrade faster than they are produced or are in equilibrium (Zharkova et al. 2020). Mercury has a higher daytime temperature and thermal amplitude than the Moon (Morrison 1970), which could potentially affect the development of EHT (Zharkova et al. 2020). Also, differences in mineral composition and physical particle properties between the regolith of the Moon and Mercury are unknown and might cause significant variations. A global Mercury dataset of images with sufficient resolution to reveal EHT is needed to test these hypotheses (Zharkova et al. 2020).
The potential occurrence of EHT on the dwarf planet Ceres and on numerous asteroids has yet to be thoroughly investigated. Images taken by the Dawn spacecraft during low altitude orbit (35-meter/pixel scale) reveal landscapes likely shaped by impact, tectonic, and cryogenic processes (Buczkowski et al. 2016; Roatsch et al. 2016). Several studies show evidence for loose regolith on Ceres (Schmidt et al. 2017; Palmer et al. 2021), perhaps even 15% more porous than regolith on the Moon (Palmer et al. 2021). Similarly, centimeters-to-meters-scale images of asteroids Bennu, Ryugu, Eros, and Vesta reveal evidence of mass wasting of loose material likely driven by similar (anhydrous) processes to the Moon (Heiken et al. 1991; Robinson et al. 2002; Buczkowski et al. 2014; Lauretta et al. 2019; Sugita et al. 2019; Walsh et al. 2022). A loosely packed and less cohesive regolith likely plays a role in EHT formation, so observations of textures analogous to EHT on these bodies would be fruitful to understanding its formation. Another reason why EHT has not been documented on asteroids and comets could be because of the young surface age (~100 to ~200 million years). However, more work is needed to understand how EHT varies with surface age on the Moon.
5. CONCLUSIONS
Our grid-mapping near the lunar south pole (90°S to 88°S) constrain where patterned regolith textures are most likely to form. Mapping and spatial analysis presented here show that:
-
Diffuse lighting does not interfere with our ability to identify EHT. This finding helps guide the interpretation of PSR landforms in terms of regolith strength properties, which could be affected by the presence of water ice.
-
Regolith properties in PSRs that are relevant to EHT formation are not significantly different from those of the illuminated surface. We mapped EHT morphology across PSR to non-PSR temperature boundaries (90° to 200° change in temperature) and found that EHT units have a similar likelihood to occur across polar terrains (up to 10% frequency difference) regardless of median slope and temperature. Thermal amplitudes as low as 1° to ~20° can induce regolith creep through short-term thermal cycling (Divoux 2010; Metzger et al. 2018), however, our results suggest that thermal cycling is not a key driver of EHT movement.
-
Distance from a hillcrest and landscape curvature affect EHT morphology. For example, EHT is most pronounced on the talus and toe of slopes, and subdued EHT typically form on convex surfaces. We found EHT on nearly-horizontal surfaces (slopes ≤ 3°) only less than ~500 m from the landform base. These observations show that EHT formation is in part controlled by slope, consistent with previous work (Swann et al. 1972; Plescia & Robinson 2010; Xiao et al. 2013; Kreslavsky et al. 2021; Bernhardt et al. 2022; Bondarenko et al. 2022; Brown et al. 2025).
-
The upper 0.5 to 1 m of regolith may act like a blanket that creeps downhill continuing onto horizontal surfaces to form crested and cohesive segments. We observed variation of EHT morphology across the same slopes; this suggests that EHT is both formed and degraded by periodic, vibration- amplitude-dependent disturbances such as tidal stresses and global contraction due to interior cooling.
A global map of EHT would help to further constrain locations of EHT occurrences and understand how it varies with surface age, geologic terrain, and proximity to young tectonic features and impacts. The geomorphic units we mapped (within cells 1 km by 1 km; 5 km by 5 km) could serve as a test dataset to train a feature classification machine learning model. This future work will add to our current understanding of EHT, but the mapping presented here offers valuable parameters to improve EHT formation models, which in turn inform aspects of future landed exploration, like hazard avoidance and regolith stability.