1. INTRODUCTION
It has been well known that the dynamics and global atmospheric circulations in the mesosphere and lower thermosphere (MLT) region are significantly influenced by the momentum and energy transported through vertically propagating atmospheric gravity waves (GWs) from the lower atmosphere. Hence, GWs, which are generated by orography, wind shear, jet streams, and convection in the lower atmosphere, have been regarded as an essential factor for understanding the physical variations in the upper atmosphere (Lindzen 1981; Fritts & Alexander 2003).
GWs can also influence the atmospheric density and temperature variations during their propagation through the atmosphere, which are reflected as changes in atmospheric airglow emission intensity (Noxon 1978). In addition, recent study by Kam et al. (2024) shows that there is a hemispheric asymmetry of annual and semi-annual oscillations in mesospheric wind and pressure by analyzing long-term meteor radar and Microwave Limb Sounder data onboard the Aura satellite (Aura/MLS). They summarized that this asymmetry also might be induced by different atmospheric GW forcings in high latitude regions of both hemispheres. Hydroxyl (OH) emissions at around 87 km have been proven to be particularly useful for studying the characteristics of GWs in the MLT region (Meinel 1950). Variations in the brightness of OH airglow emissions can be used for the study on the interactions between the atmospheric status and GWs. These variations in atmospheric density and temperature correspond to the amplitude, period, and propagation direction of GWs. Therefore, observations of OH airglow emissions enable the estimation of key physical characteristics of GWs (Taylor et al. 1997; Swenson et al. 2000; Hecht et al. 2001; Ejiri et al. 2003; Matsuda et al. 2017).
There have been continuous efforts to study GWs through airglow observations using instruments such as interferometers, photometers, and all-sky imagers (Taylor et al. 1995; Nakamura et al. 1999, 2003; Reid et al. 2005; Shiokawa et al. 2007; Nyassor et al. 2018; Lee et al. 2021). However, these observations are often limited to specific regions or directions, leaving challenges in fully capturing the dynamic nature of GWs. As GWs propagate both vertically and horizontally, they interact with background flows, leading to changes in their period and wavelength. Thus, more comprehensive spatial and temporal observations are essential to better understand the physical properties of GWs and their interactions with the background atmosphere.
In the 1990s, the Mesospheric Temperature Mapper (MTM) was developed at Utah State University (USU) to produce two-dimensional maps of OH rotational temperature, which enables the study of various properties of GWs (Taylor et al. 2001). This innovative optical instrument comprises a Charge Coupled Device (CCD), telecentric lens, and broad-spectrum filter to observe the OH airglow emission within a 120-degree field of view covering an area of approximately 300 km at an altitude of 87 km. The temperature estimation from the measured airglow emissions is based on the ratio of intensities of two or more emission lines in the OH Meinel band (Meriwether 1975). The observed intensity of atmospheric emission and the calculated rotational temperature are represented as a two-dimensional image, corresponding to the sensor's pixel field of view, which allows us to investigate the wave structures in the mesosphere with improved temporal resolution. It also shows intensity changes with small-scale features known as ripples that indicate the propagation and dissipation of GWs in the region.
In the early stages of the MTM, observations were conducted using the OH(6-2) band emissions in the visible spectrum. However, the CCD-based MTM was severely affected by moonlight, leading to a substantial reduction in the observation period, depending on the lunar elevation and phase. At high latitudes, the OH(6-2) band was significantly contaminated by auroral emissions, particularly from N₂ Meinel and 1PG bands, introducing spectral distortions and hindering the accuracy of observational data, especially in rotational temperature measurements (Greet et al. 1998). To overcome these challenges, the CCD sensor was replaced with an InGaAs sensor, transforming the MTM into a Short-Wave Infrared (SWIR) detection system (Pautet et al. 2014). This transition allowed for the observation of the OH(3-1) band in the infrared spectrum, which offered higher intensity and reduced auroral interference. As a result of these advancements, the system was renamed the Advanced MTM (AMTM).
The AMTM at King Sejong Station (referred to as KSS-AMTM) is a newly developed short-wave infrared OH imager, designed and manufactured by Keo Scientific Ltd., Canada. This instrument is a more compact version of the Utah State University instrument, utilizing the same fundamental observation principles (Dalin et al. 2024; Trondsen et al. 2024). Prior to its deployment at the Antarctic base, initial test operations were conducted at the Bohyeonsan Observatory in Yeongcheon, South Korea, to ensure the instrument's stability and functionality. The KSS-AMTM was installed at the Space Weather Optical Observatory at King Sejong Station during the austral summer of 2022–2023, as shown in Fig. 1. Full-fledged observations commenced on January 30, 2023.
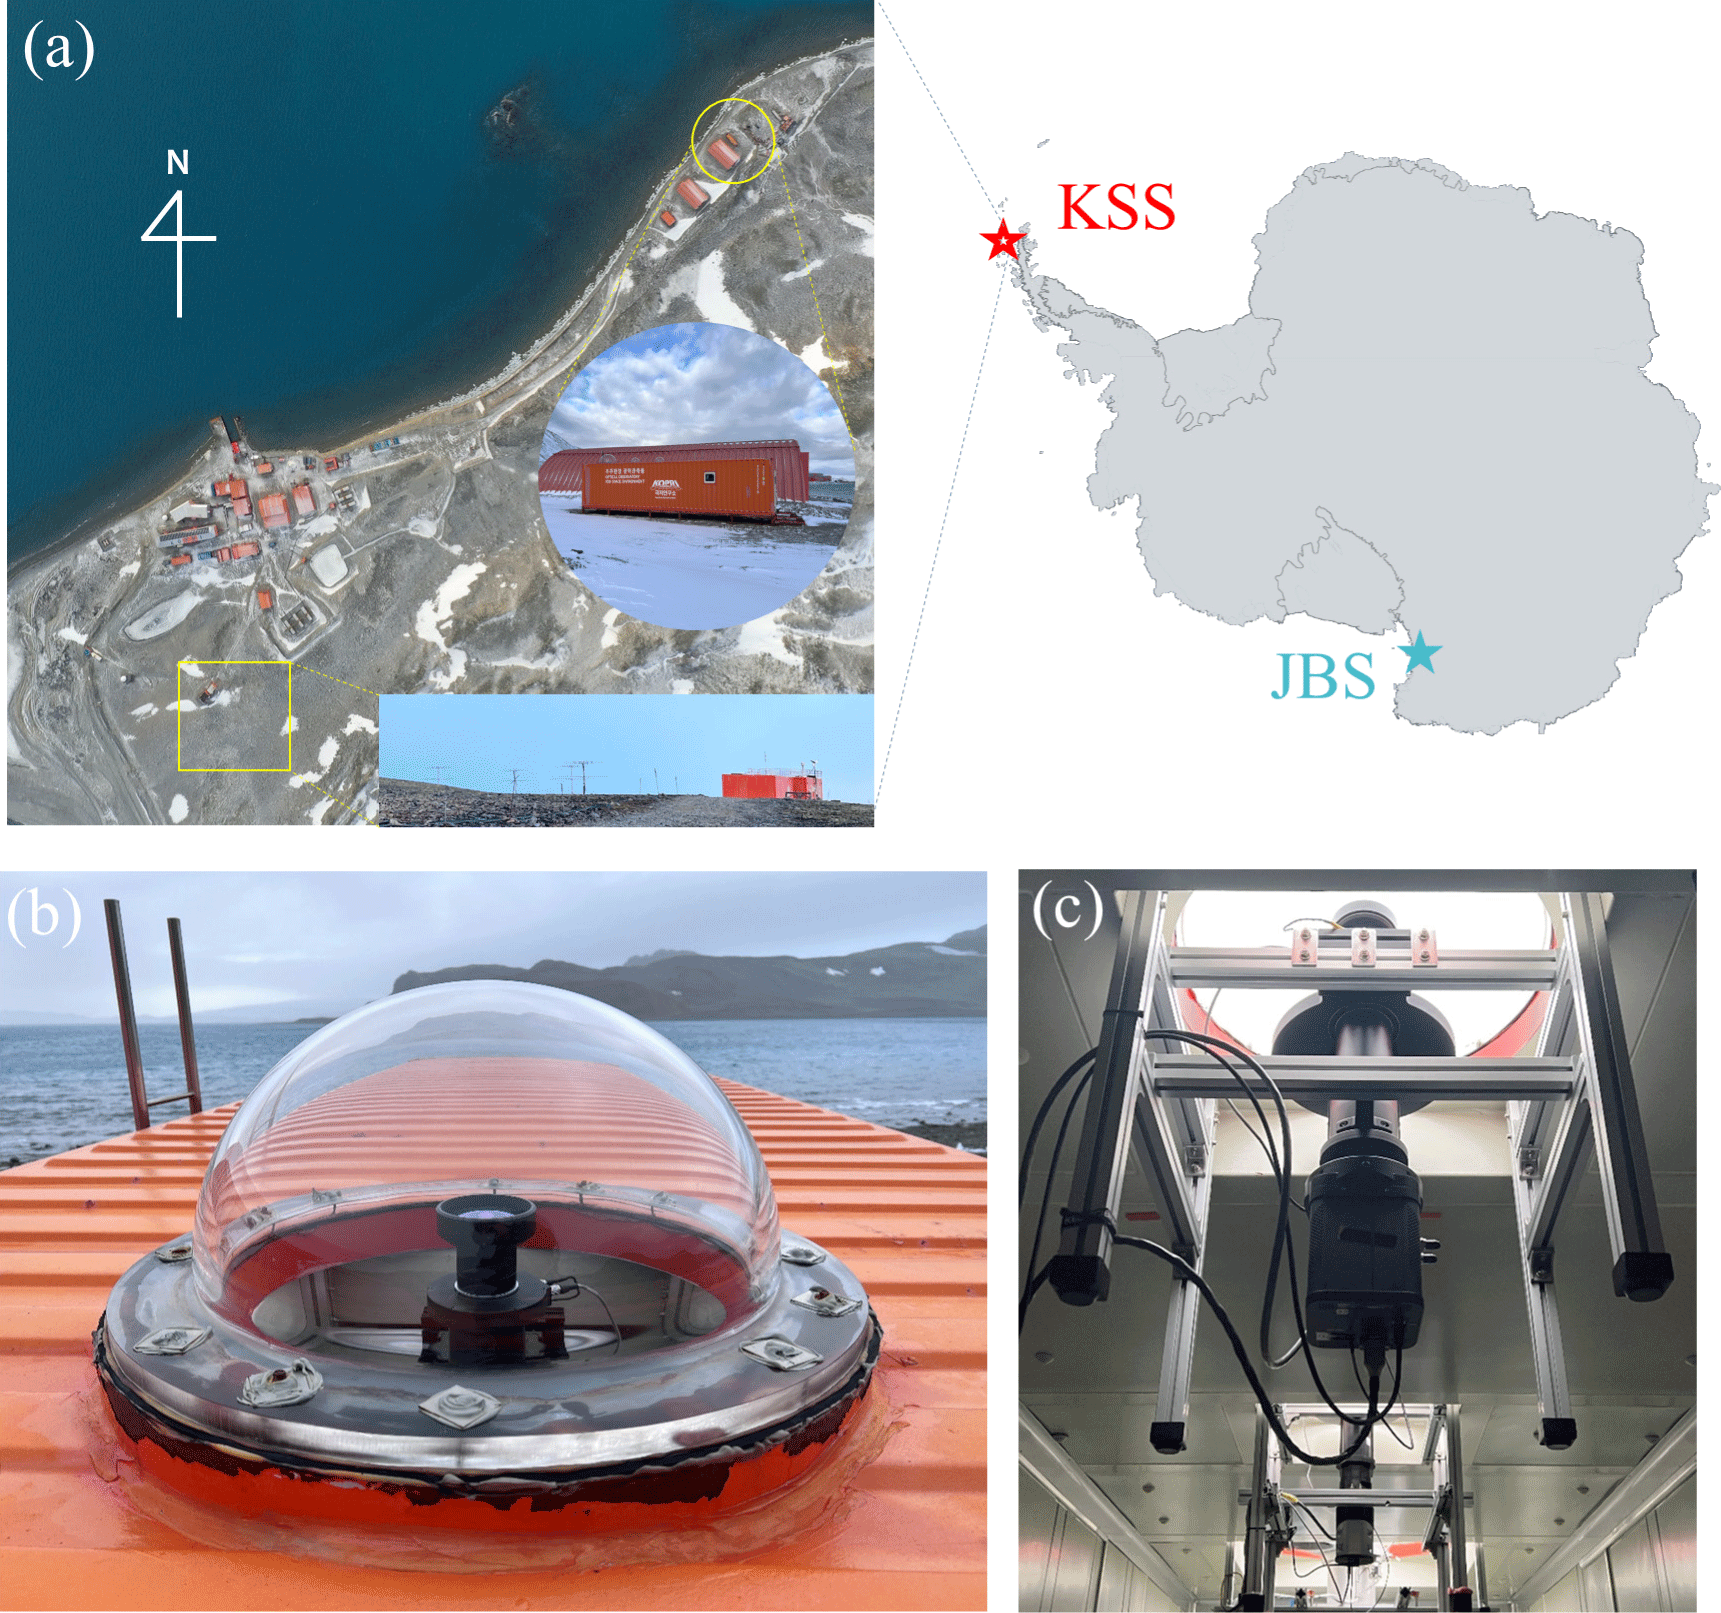
The KSS, situated at the tip of Antarctic Peninsula (62.22°S, 58.78°W), is renowned for significant GW activity (Kam et al. 2017; Lee et al. 2018b; Song et al. 2021). Since the establishment of KSS, a number of studies have been conducted on the characteristics of the MLT region and GWs using various instruments, including the Spectral Airglow Temperature Imager (2002–2013) and the All Sky Camera (since 2008). Notably, the very high frequency (VHF) Meteor Radar, installed in 2007, has been continuously measuring neutral wind and temperature in the MLT region (~70 to 110 km altitude), for 24 hours a day, regardless of weather conditions (Jee et al. 2014). The newly installed KSS-AMTM is expected to further enhance our observational capability for the characteristics of the MLT region and GWs over the KSS.
In this paper, we introduce the KSS-AMTM instrument and the principle of rotational temperature estimation based on measurements of OH airglow emissions. The estimated temperatures are validated through comparisons with independent measurements. In Section 2, we describe the specifications of the instrument and the data used in this study. Section 3 details the data processing method for the raw images from KSS-AMTM observations and explains the temperature estimation using the processed images. Section 4 presents the preliminary results of the KSS-AMTM observations, including comparisons with independent measurements from the Aura/MLS and the co-located KSS-MR. Finally, conclusions are presented in Section 5.
2. INSTRUMENT AND DATA
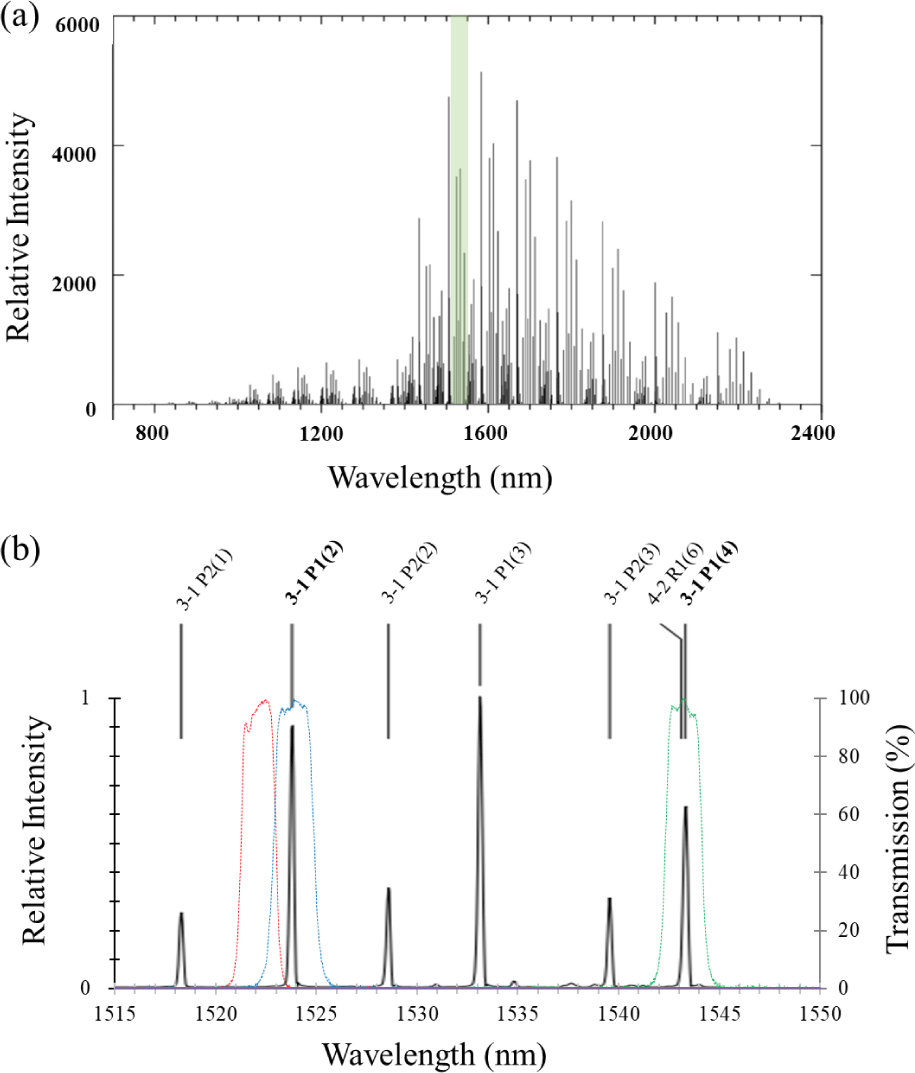
Recent advancements in imaging technology have enabled the InGaAs sensor to explore a significantly expanded spectral range in the short-wave infrared (SWIR) compared to typical silicon (Si) CCDs, which are effective only in the visible to near-infrared (NIR) range. In particular, the intensity of the OH Meinel band is notably stronger in the SWIR range than the visible to NIR range, as illustrated in Fig. 2(a), making observations of OH nightglow in this range highly advantageous (Rousselot et al. 2000; Moreels et al. 2008). Moreover, optical measurements in the SWIR range are less affected by moonlight, allowing for more data collection irrespective of lunar phase or elevation angle, thereby extending the duration of observations.
The KSS-AMTM system comprises three main components: the optical part with an on-board InGaAs camera, a controller, and a control computer. More detailed characteristics of the instrument are provided in Table 1. The InGaAs camera, manufactured by Princeton Instruments shows a reliable quantum efficiency greater than 85% in the wavelength range of 0.9 μm to 1.7 μm, making it well-suited for SWIR observations. In this range, InGaAs detectors outperform CCDs due to lower dark current and reduced read noise when properly cooled. The NIRvana 640 model used in KSS-AMTM is thermoelectrically cooled to –80°C, effectively minimizing thermal noise and maximizing the signal-to-noise ratio. Trondsen et al. (2024) provides further information on the instrument as well as its potential applications for research on the geospace environment.
The optical part of the KSS-AMTM includes a primary lens that forms a wide-angle telecentric image near the filter plane and an objective lens that focuses this image onto the InGaAs camera as shown in Fig. 3(a). The primary lens, a medium-format f/3.5 lens for SWIR, provides a 120-degree field of view, with an internal aperture set to f/5.6 to match the 2.0 nm bandwidth of the filters. Light passing through these lenses forms a circular image that covers a 12.8 × 10.24 mm sensor, with darkened edges. A mechanical shutter between the primary lens and the filter wheel adjusts the exposure time. The objective lens, optimized for SWIR, features an f/0.95 aperture and allows for adjustable focus through a dedicated focus port to ensure image clarity.
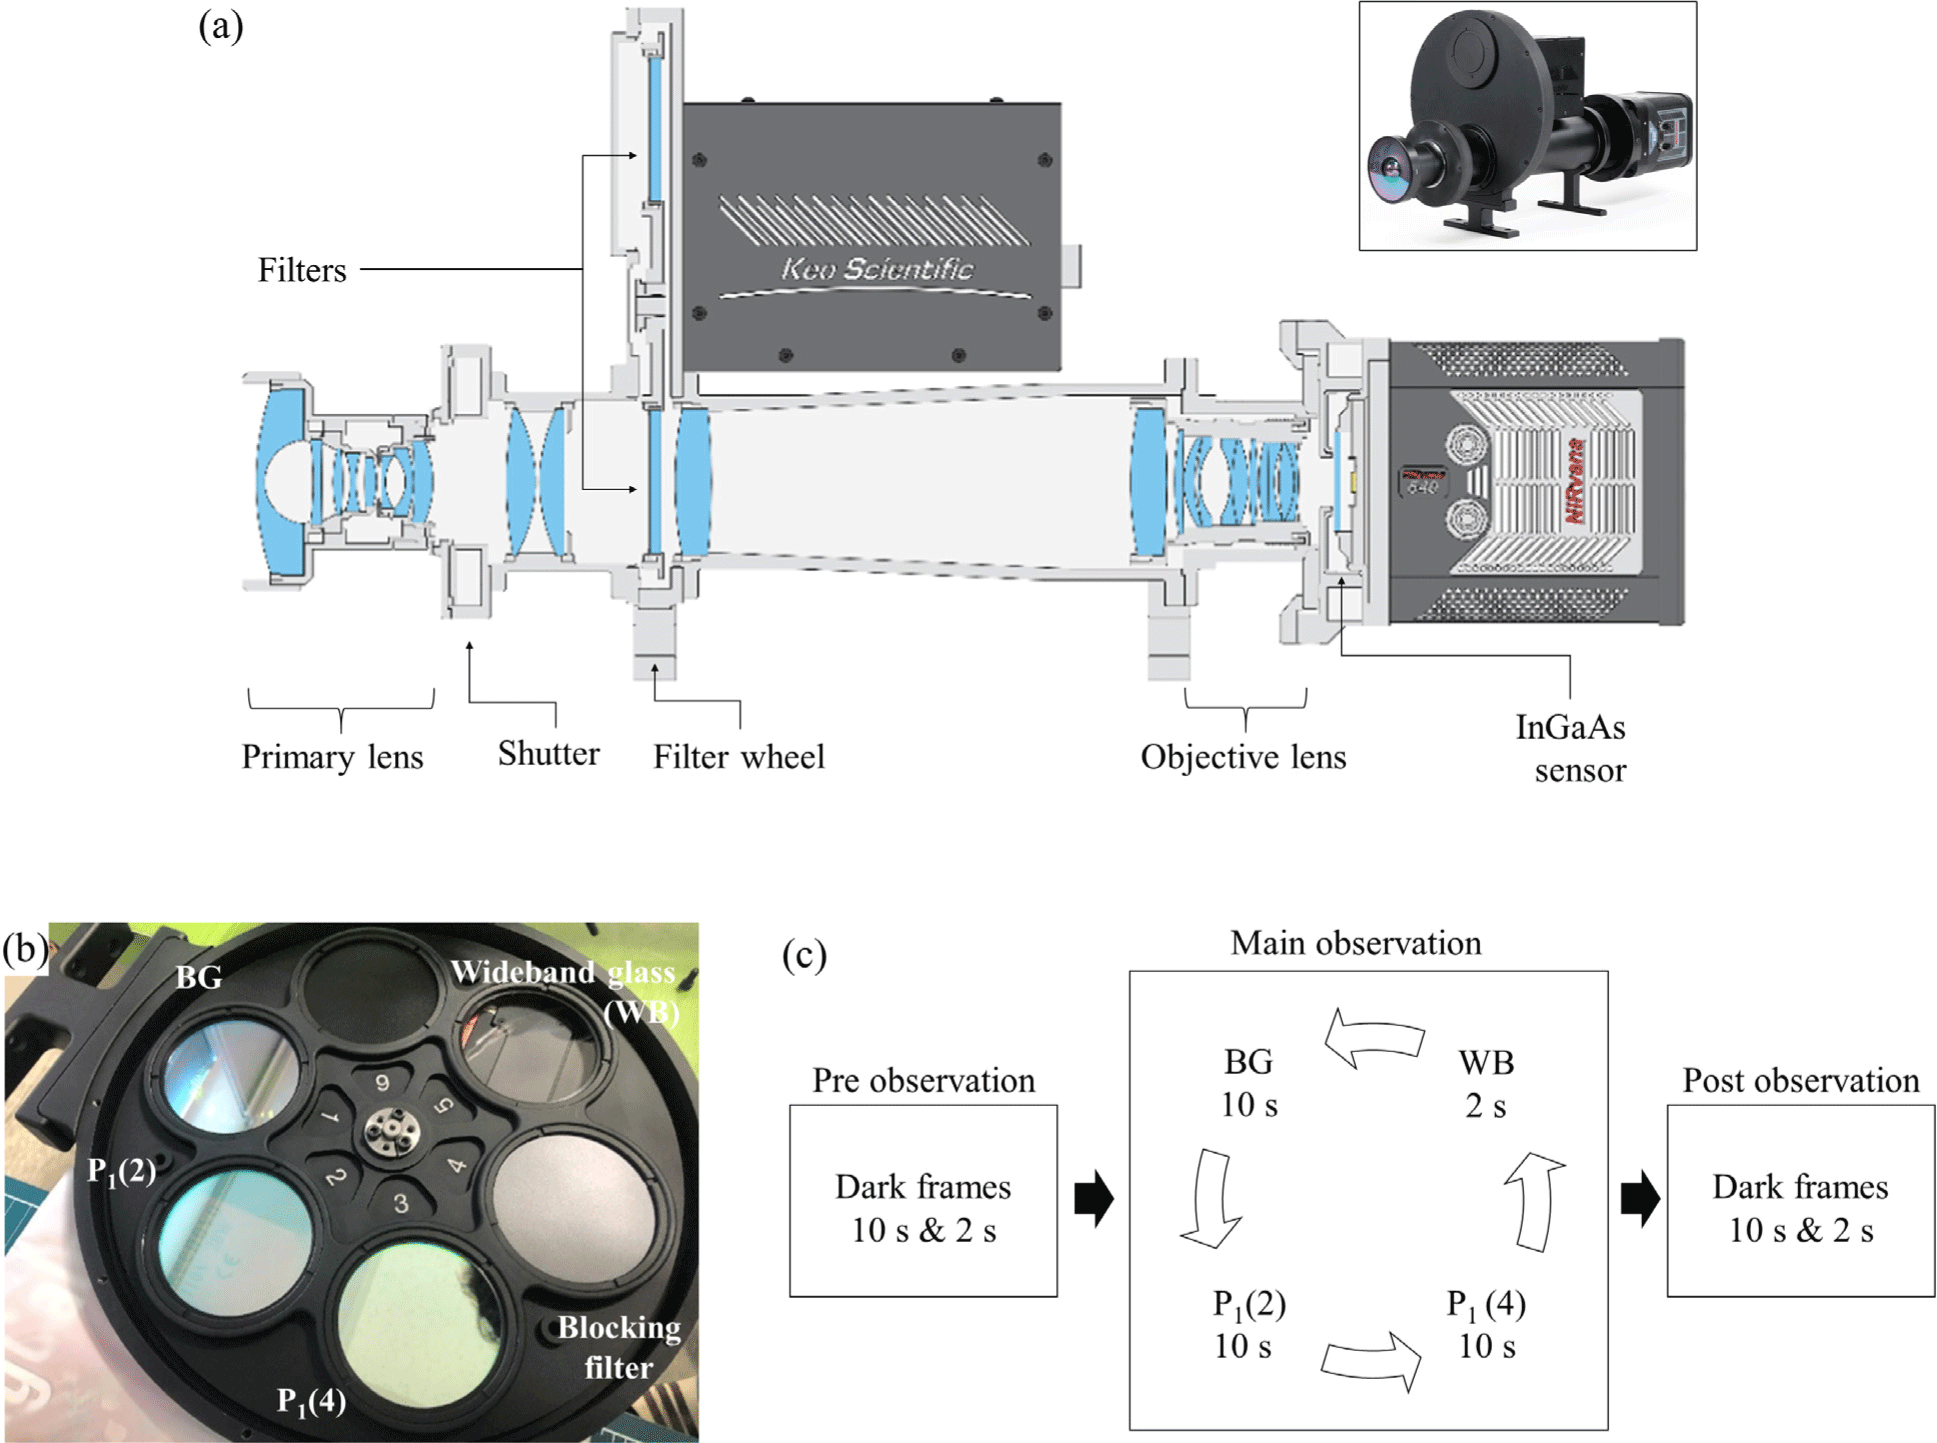
The instrument uses 3-inch narrow bandpass filters to observe the background (BG) and two OH(3-1) emission lines: 1,522.0 nm for BG, 1,523.7 nm for P1(2), and 1,542.8 nm for P1(4). Fig. 2(b) shows the transmission characteristics of each filter for the synthetic spectra of OH emission lines. The central wavelengths of the P1(2) and P1(4) filters are slightly different from the OH emission lines, but both fall within the full width at half maximum (FWHM), ensuring that the filters effectively cover the wavelength range of the OH emission lines. Additionally, the KSS-AMTM is equipped with both a blocking filter and a wideband glass. The shutter of the KSS-AMTM is situated above the filter wheel, allowing for the use of the blocking filter to further block stray light during the capture of dark frames. The wideband glass enhances the observation of clouds and stars compared to other filters, thereby aiding the evaluation of sky conditions. All filters are mounted in a filter wheel which has six slots and rotated sequentially in accordance with the observation schedule. The positions of each filter within the filter wheel are depicted in Fig. 3(b).
The controller connects the filter wheel, the shutter, and the InGaAs sensor to the operating computer, automatically conducting the observations according to the settings configured in the Synopticx software provided by the manufacturer. Crucially, the InGaAs sensor is maintained at –80°C, while the thermally stabilized filter wheel keeps filters at their optimal operating temperature of 23°C. Observations are initiated when the solar depression angle exceeds 8 degrees, regardless of the lunar elevation angle. The sequence of this observation cycle for one night is illustrated in Fig. 3(c). To monitor the variations in the thermal noise of sensor over time, dark frames are captured by closing the shutter both before (pre) and after (post) the observation. The 10-second dark frames are used for temperature calibration, while the 2-second dark frames are taken to subtract the background from wideband glass images. In the main observation, the three bandpass filters rotate sequentially, BG, P1(2), and P1(4), observing each emission for 10 sec. Afterward, the wideband glass in the filter wheel slot 5 captures images with 2-second exposure every cycle to monitor sky conditions. Thus, each temperature measurement is performed at every 32-second cycle until the observation is completed during the nighttime.
Aura satellite orbiting at an altitude of 705 km was launched into a sun-synchronous orbit on July 15, 2004 to measure trace gases in the atmosphere. The Aura/MLS has been observing the faint thermal microwave emissions from atmospheric constituents at 55 pressure levels ranging from 316 hPa (upper troposphere) up to 0.001 hPa (near mesopause) to measure atmospheric composition, temperature, humidity and cloud ice. With an orbital inclination of 98.2°, the MLS observations cover latitudes from 82°S to 82°N. The MLS temperature is retrieved from O2 spectral lines at 118 and 239 GHz. Details on the retrieval procedure can be found in Waters et al. (2006) and Schwartz et al. (2008). In order to make a comparison between MTM and MLS temperatures, we used the mean nighttime temperatures at the pressure level of 0.00464 hPa corresponding to 88.5 km altitude after selecting MLS v04 temperature profiles within ± 5° centered on KSS location both in the latitude and longitude.
KSS-MR, supplied by ATRAD, has been continuously measuring neutral winds and temperatures since its installation in March 2007 to study wave activities and dynamics in the polar MLT region. The KSS-MR using a frequency of 33.2 MHz has been initially operated at the peak power of 8 kW until 2011 and then upgraded to 12 kW in 2012 and 20 kW in 2023. Currently, the echo detection rate of the KSS-MR is about 30,000 to 50,000 per day, showing a clear seasonal variation of the minimum and maximum during winter and summer, respectively. More detailed information about the KSS-MR can be found in Kim et al. (2010) and Kam et al. (2019). The MR temperatures, estimated using the FWHM method introduced by Lee et al. (2016), are used to compare with results from KSS-AMTM observations.
3. ADVANCED MESOSPHERIC TEMPERATURE MAPPER AT KING SEJONG STATION (KSS-AMTM) IMAGE ANALYSIS
The data processing procedure is largely divided into three steps as shown in Fig. 4. The first step is a general optical image preprocessing, which includes dark subtraction, flat correction, and conversion from digital number to absolute light intensity.
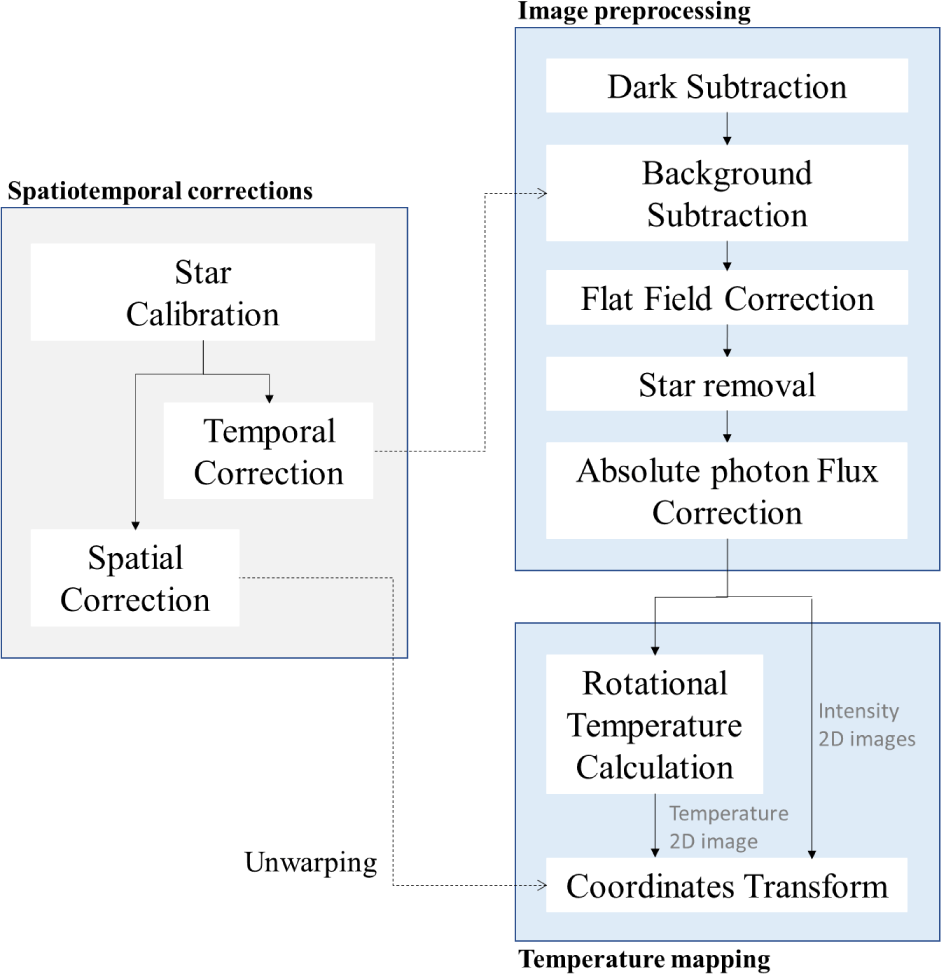
The InGaAs sensor raw image shows a fixed stripe pattern caused by pixel-to-pixel variations and the use of a single amplifier for each column, which reads out sequentially. Since this stripe pattern is an unnecessary noise in the image analysis, it needs to be removed by subtracting the dark frame from the three filtered images. The dark frame also includes thermal noise inherent to the sensor as well as optical noises. Notably, the pixel values of the dark images vary with temperature in the vicinity of the filter wheel. To obtain an accurate OH temperature, therefore, the filter wheel temperature is maintained constant and dark frames are captured before and after the main observation to monitor the changes in the dark noise of the sensor. As a result, it is ensured that the sky images captured through BG, P1(2), and P1(4) filters have the same exposure time during one rotation cycle of the filter wheel, and that the temperatures of the sensor and filter are kept almost the same.
The dark-subtracted images are then converted to spectral density by multiplying each image by the absolute sensitivity of the respective filter. The absolute sensitivities of each filter, provided by the manufacturer, represent the filter’s efficiency in detecting light at specific wavelengths. These values convert the image data into spectral density, ensuring proper calibration according to the filter's characteristics. Following this, pixel-wise subtraction is performed to remove the BG spectral density from the P1(2) and P1(4) spectral densities, leaving only the OH emissions’ brightness. The resulting images are converted back to the digital number (DN) domain by dividing them by the absolute sensitivity of the filters.
The flat field correction is a crucial step in optical data analysis, addressing irregularities in the optics and uneven illumination across the field of view. Initial observations using KSS-AMTM revealed temperature inaccuracies, where certain regions consistently showed higher or lower temperatures regardless of environmental changes. This suggests that, unlike general optical observation methods that rely on the brightness of the image, temperature estimation in MTM observations depends on the brightness ratio of images. As a result, even slight non-uniformity in the optical system can cause significant differences in the estimated temperature. Therefore, accurate acquisition of the flat field is paramount in MTM analysis.
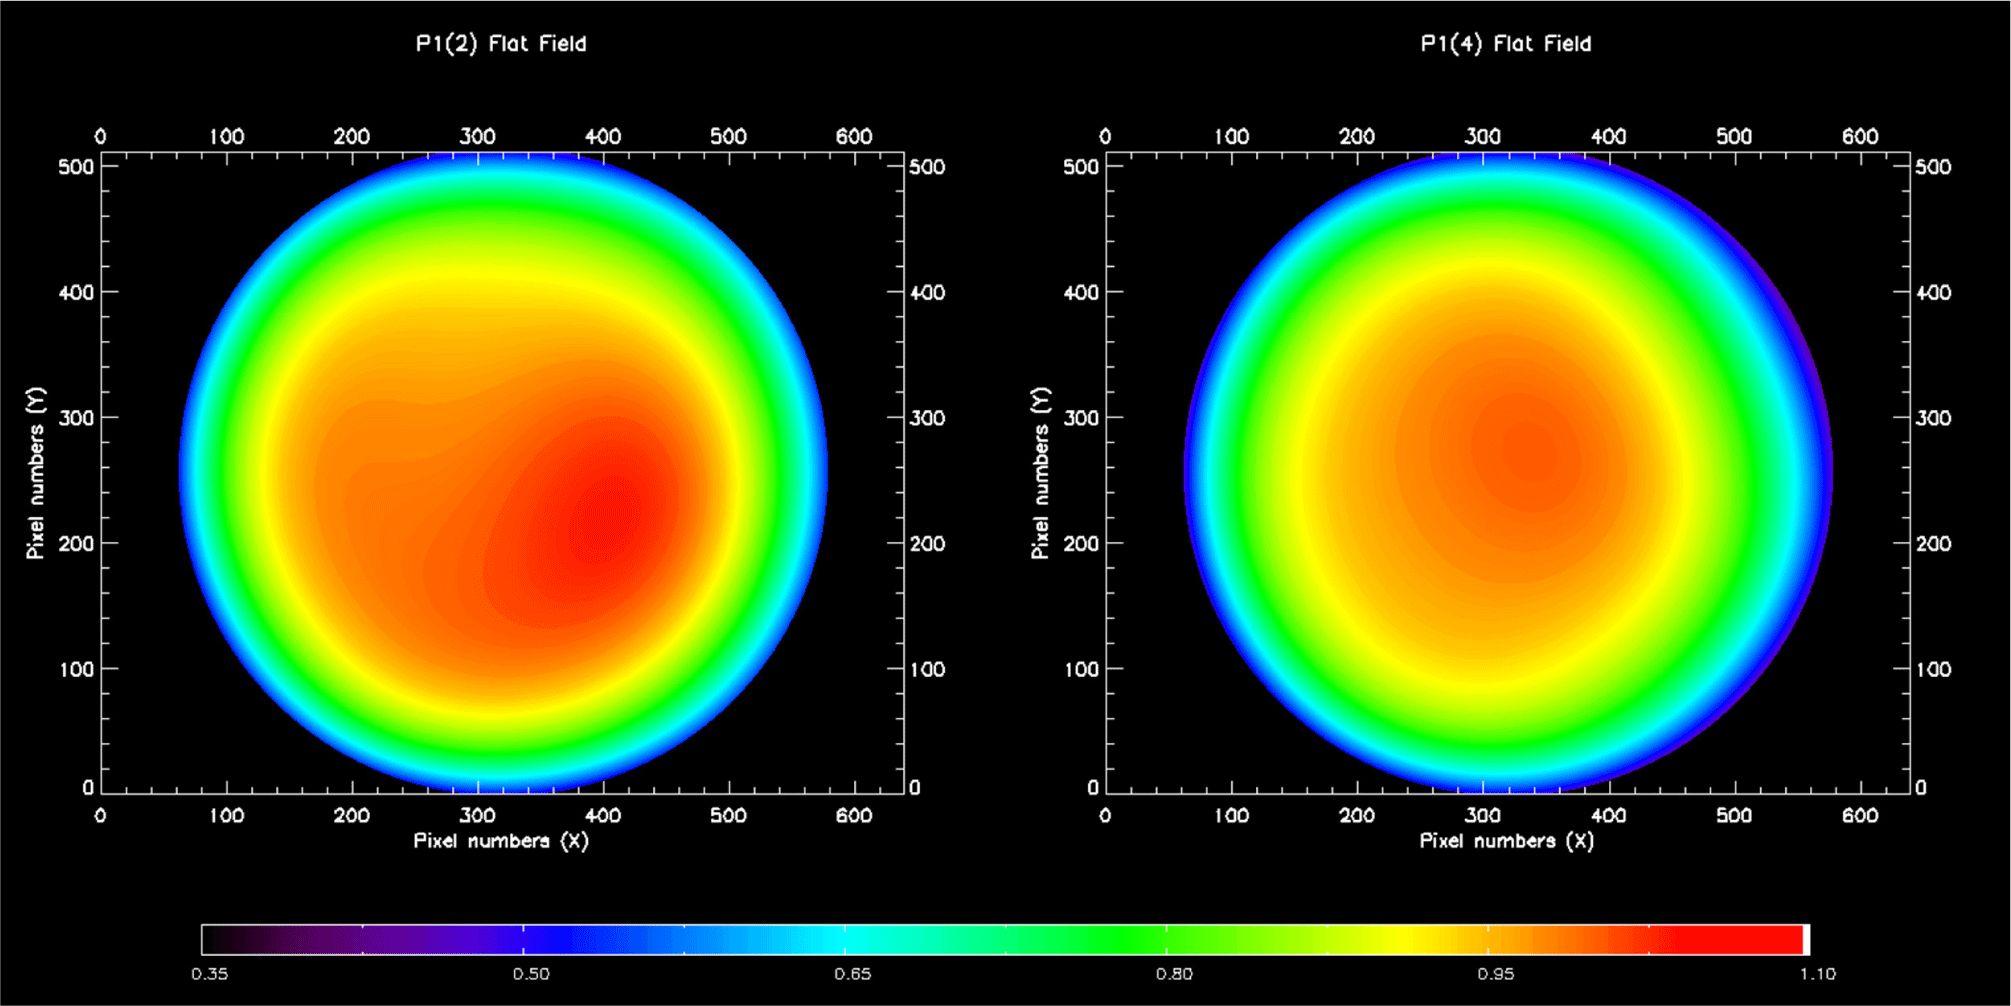
The initial experiments employed an integrating sphere to capture flat field images, using a tunable laser with a wavelength precision of ± 0.3 nm based on the peak emission line's central wavelength. However, the flat field correction was insufficient, leading to errors in temperature estimation. This indicated that the wavelength precision of ± 0.3 nm was insufficient for capturing accurate flat field images of the filter. With the manufacturer's assistance, we replaced the laser with a precision of ± 0.07 nm, which enabled us to achieve uniform temperature calculations across the entire image. Fig. 5 displays the flat field images obtained for both filters using the ± 0.07 nm precision laser. The flat field arrays are normalized to 1.0 at the image center in order to account for vignetting and filter non-uniformities.
In the image processing for temperature extraction, stars are considered noise that must be removed, even though they help determine the exact observational range and clear-sky conditions. To eliminate stars while preserving the background structure, a median filter is applied to estimate the background intensity, and pixels exceeding a predefined threshold (e.g., ± 3σ) are identified as stars. Small stars are detected and removed using pixel shift operations to analyze localized intensity variations. Large stars are detected using multi-directional pixel shifts, including diagonal expansions, to account for their extended bright regions. The detected star pixels are then masked as missing data and restored using a 3 × 3 median filter to interpolate the missing values. Finally, a smoothing filter is applied to maintain background continuity.
The absolute photon flux correction is performed using absolute intensity coefficients obtained through laser measurements at the image center during the acquisition of the flat field image. These coefficients are combined with the normalization of the flat field data, propagating the absolute calibration to the entire image and enabling their application to every pixel. Specifically, the coefficients for the P1(2) and P1(4) are 4.041 photons/DN and 3.744 photons/DN, respectively. These coefficients convert DN values into photon numbers, which are proportional to Rayleigh emission rates. One Rayleigh (1 R) corresponds to a column emission rate of 10¹⁰ photons per square meter per column per second. It is important to note that the Rayleigh represents an apparent emission rate, as no corrections are made for scattering or absorption. The conversion from photon to Rayleigh unit can be achieved using the following equation:
where R represents the brightness in Rayleigh, N is the number of photons (converted from DN), and T is the exposure time in seconds. The factor arises from the definition of a Rayleigh, while the solid angle (0.6633 sr) is calculated for the F/1.0 cone of rays at the image sensor. The geometric etendue is then determined by multiplying this solid angle by the pixel area (4 × 10⁻⁶ cm2).
In optical images captured with a fisheye lens such as the MTM, the pixel field of view expands towards the edges of the image, causing linear wave structures to appear curved. To address this issue, spatial correction is applied by mapping these distortions onto a linear grid. Additionally, as temperature maps are generated from three images [BG, P1(2), P1(4)] taken at different times, temporal correction is also necessary to align these images to a common temporal reference. These processes were performed to determine the coefficients and functions for the corrections.
For both the spatial and temporal correction procedures, star calibration is required as a prerequisite, which involves the analysis of the positions of over 60 stars within the images captured by wideband glass. The celestial coordinates (right ascension and declination) from the Smithsonian Astrophysical Observatory star catalog are matched with their corresponding positions in the x and y pixel coordinates of the images. Following star calibration, quantitative analysis of the image data and mapping of pixel arrays to physical distances in the airglow layer are carried out using multiple coordinate transformations proposed by Garcia et al. (1997). These include transformations from pixel coordinates to standard coordinates, standard coordinates to horizontal coordinates, and horizontal coordinates to distance coordinates.
First, the pixel coordinates (x, y) serve as indices in the sensor's data array without specific geographic orientation. These coordinates are then transformed into standard coordinates (f, g) through a linear transformation, which scales the horizon circle at 0° elevation to a unit radius with the zenith at the circle’s center. This transformation is defined by the equations:
where the coefficients a and b are determined by a least-squares fit between the star positions in the pixel coordinates and their corresponding celestial coordinates. Once these coefficients are determined, they can be applied to all images in the dataset, assuming the instrument remains stationary.
Next, the azimuth-elevation (az, el) coordinate system is used to link the standard coordinates (f, g) with geographic coordinate (x, y). The relationship between (f, g) and (az, el) is expressed as:
where G(el) is a function that relates the elevation angle to the distance from the image center, derived from the characteristics of the fisheye lens using the Newton-Raphson method to determine the elevation angle for each pixel. Finally, these coordinates are transformed into geographic coordinates (x, y) on a 2-D grid at the height of the airglow layer where the original image is projected for 2D FFT analysis. In this coordinate system, the zenith serves as the origin, with the top and right sides oriented towards the north and east, respectively.
Since the images are captured sequentially using a filter wheel with each filter exposed for 10 sec, there are inherent temporal differences between them. Therefore, a temporal correction was performed concurrently with the spatial correction. To accurately determine the brightness ratios of each pixel for a pair of images, the background and P1(2) images were rotated to align temporally with the P1(4) image. This alignment was achieved by using the x and y pixel values corresponding to a declination of 90 degrees (i.e., the position of the Earth’s rotation of axis in the sky), identified during star calibration, as the reference point. The rotation angle was adjusted based on the time differences between the images to ensure they appear as if they were captured simultaneously. It is noted that while the change due to Earth's rotation over the integration time (~32 sec) is smaller than the average pixel field of view of the device, positional shifts have been verified to be limited to 1–2 pixels during this process. Thus, this effect can be considered negligible when using shorter exposure times or employing higher-resolution sensors in future applications.
The final step of the data analysis is to produce the 2D maps of the emission intensities and the rotational temperature. The rotational temperature is estimated from the ratio of the intensities of two emission lines, P1(2) and P1(4), by utilizing the line pair ratio method proposed by Meriwether (1975). The brightness values obtained from the previous step are substituted into the equation (Phillips et al. 2004):
where h denotes Planck's constant, c is the speed of light, k is the Boltzmann constant, Fa and Fb are the OH (X, υ’ = 3) rotational term values defined in Abrams et al. (1994), Ia and Ib represent the emission intensities, Aa and Ab are Einstein A coefficients, and Ja and Jb are the quantum numbers of the lowest rotational states for the two emission lines. The parameters and A coefficients corresponding to the energy levels for P1(2) and P1(4) are summarized in Table 2.
The Einstein A coefficients representing the probability of spontaneous transition between energy levels also play a source of uncertainty in determining OH rotational temperature. Even small differences in these coefficients can lead to notable differences in the estimated temperature, as they are used in a logarithmic function for temperature retrieval. Therefore, Many studies have been continuously refined these coefficients to reduce the uncertainty of temperature estimation through both theoretical and experimental methods based on the advancements in experimental techniques, quantum mechanical models, and computational methods [Mies 1974; Langhoff et al. 1986 (LWR); Turnbull & Lowe 1989, (TL); Nelson et al. 1990 (NSNOB); Holtzclaw et al. 1993 (HPG); van der Loo & Groenenboom 2008 (vdLG); Brooke et al. 2016]. In this study, we utilized the most recently updated coefficients from Brooke et al. (2016) to simplify the Eq. (4) as follows:
where all the numerical coefficients in Table 2 are utilized and R represents the brightness ratio of the P1(2) line to the P1(4) line.
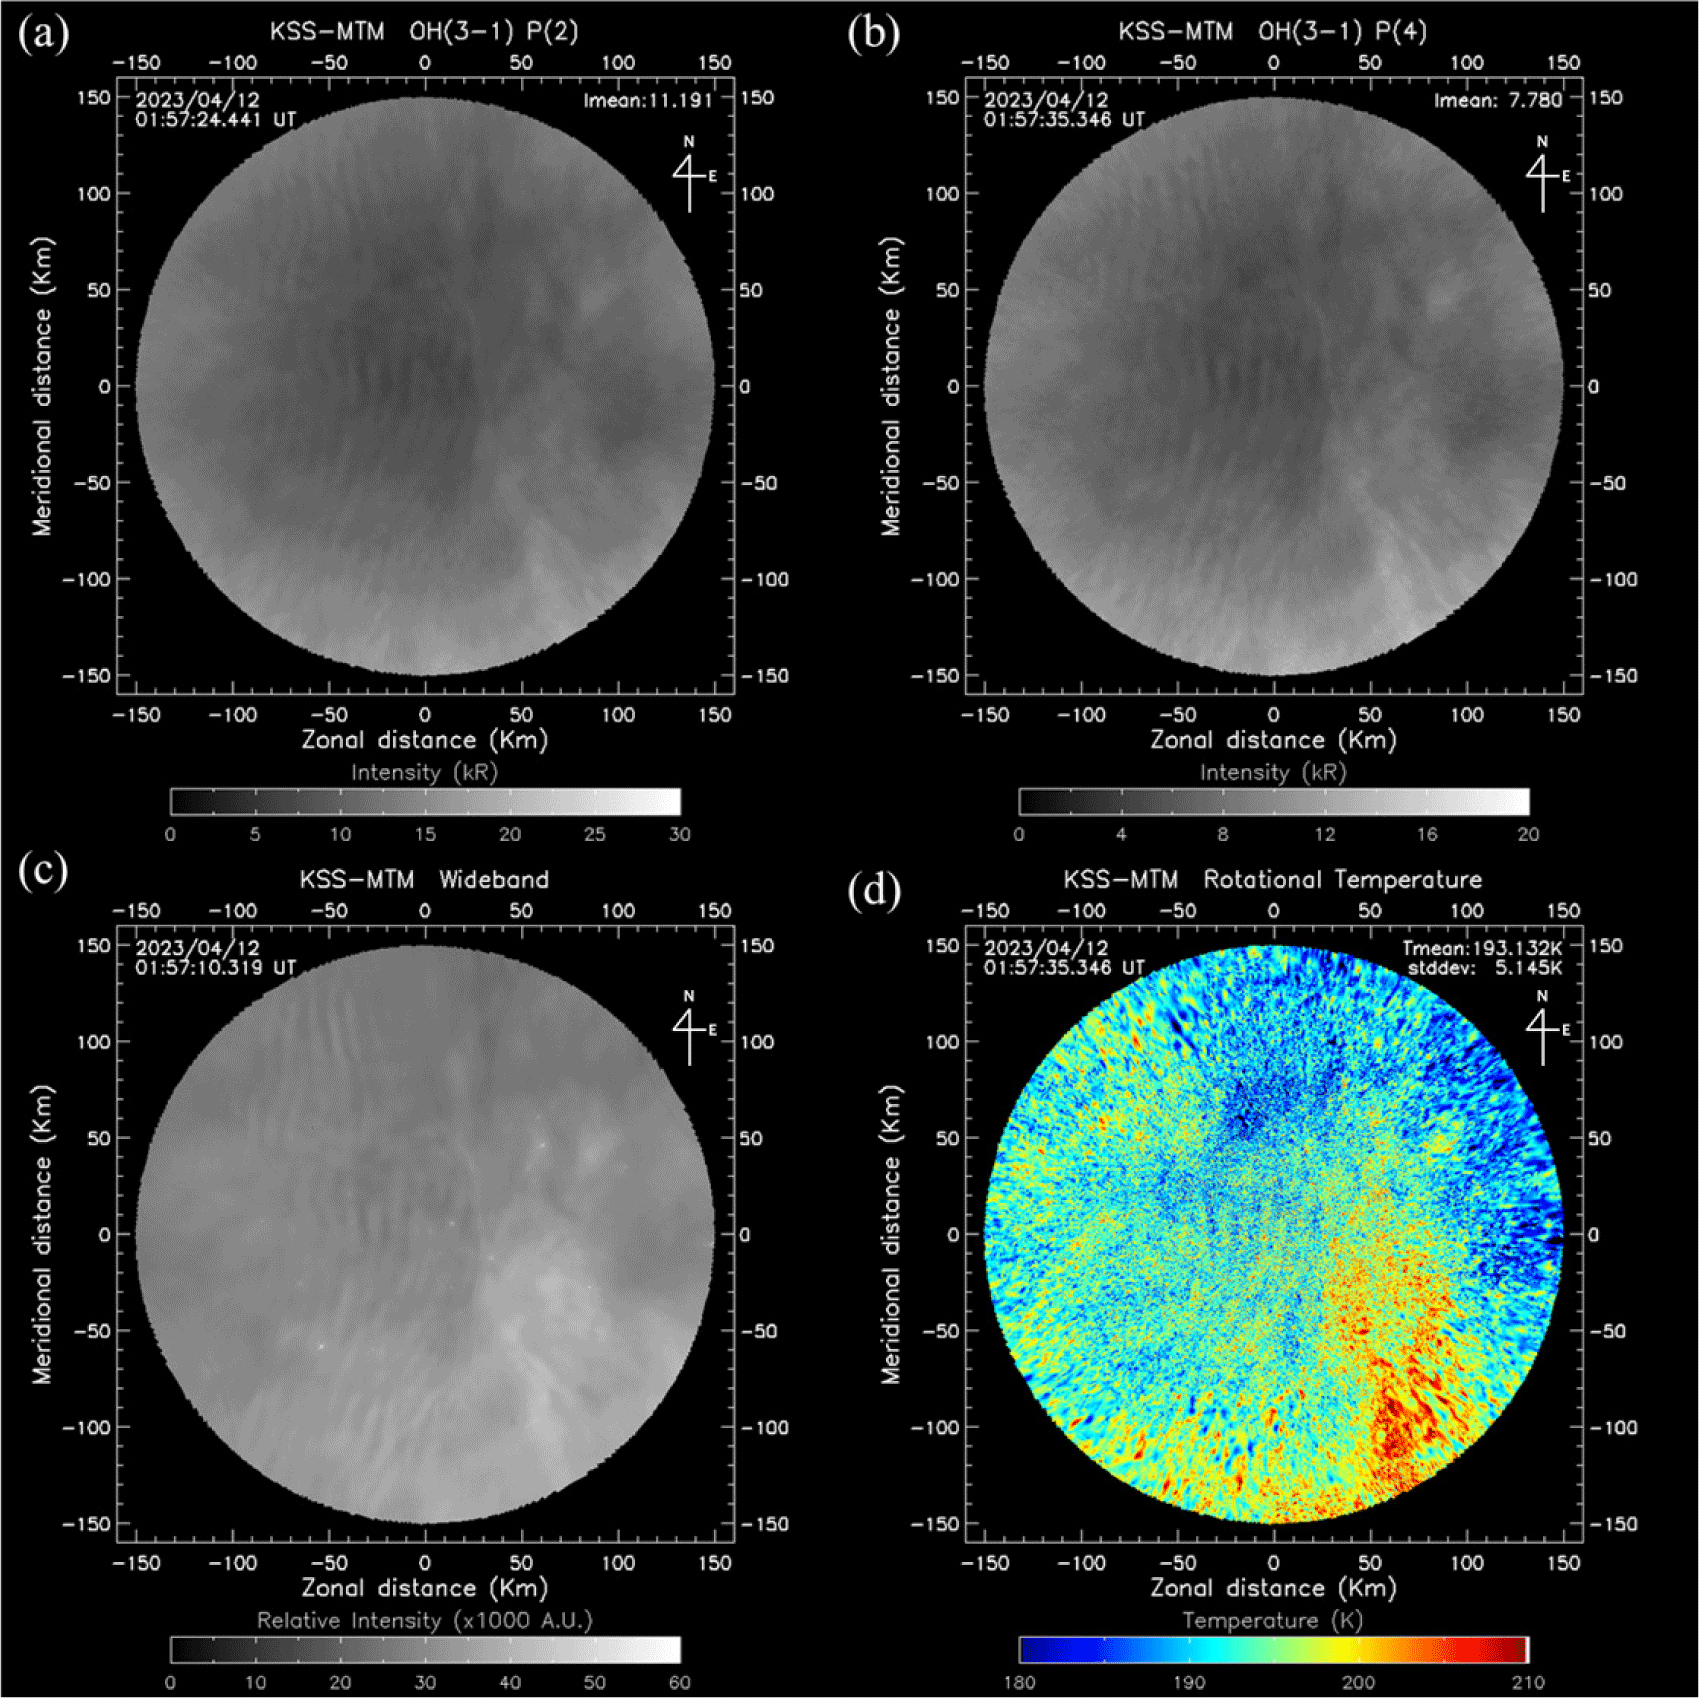
Once the 2D rotational temperature is estimated, the temperature map as well as the emission intensity maps are converted to a distance grid (i.e., mapping) according to the unwarping transformation as described in Section 3.2. Each pixel's position is adjusted based on the inverse distortion, resulting in unwarped images without the original distortions as shown in Fig. 6.
4. RESULTS AND DISCUSSIONS
One significant advantage of the AMTM is its ability to estimate temperature for individual image pixels, enabling the generation of high-resolution temperature maps in both spatial and temporal windows. This capability facilitates the study of large-scale dynamical features, such as tides or planetary waves, as well as more localized time-varying phenomena, including short-period GWs and instabilities. Fig. 6(a)–6(d) are sample images observed by KSS-AMTM at 1:57 UT on April 12, 2023. These include the intensity maps for P1(2) and P1(4) filters, wideband image, and the estimated OH(3-1) rotational temperature. All the images are spatially corrected and projected onto a 300 × 300 km distance grid, assuming a nominal altitude of 87 km for the OH emission layer to account for lens format distortions. The atmospheric perturbations due to short-period GWs propagating through the OH layer are clearly visible in all the images.
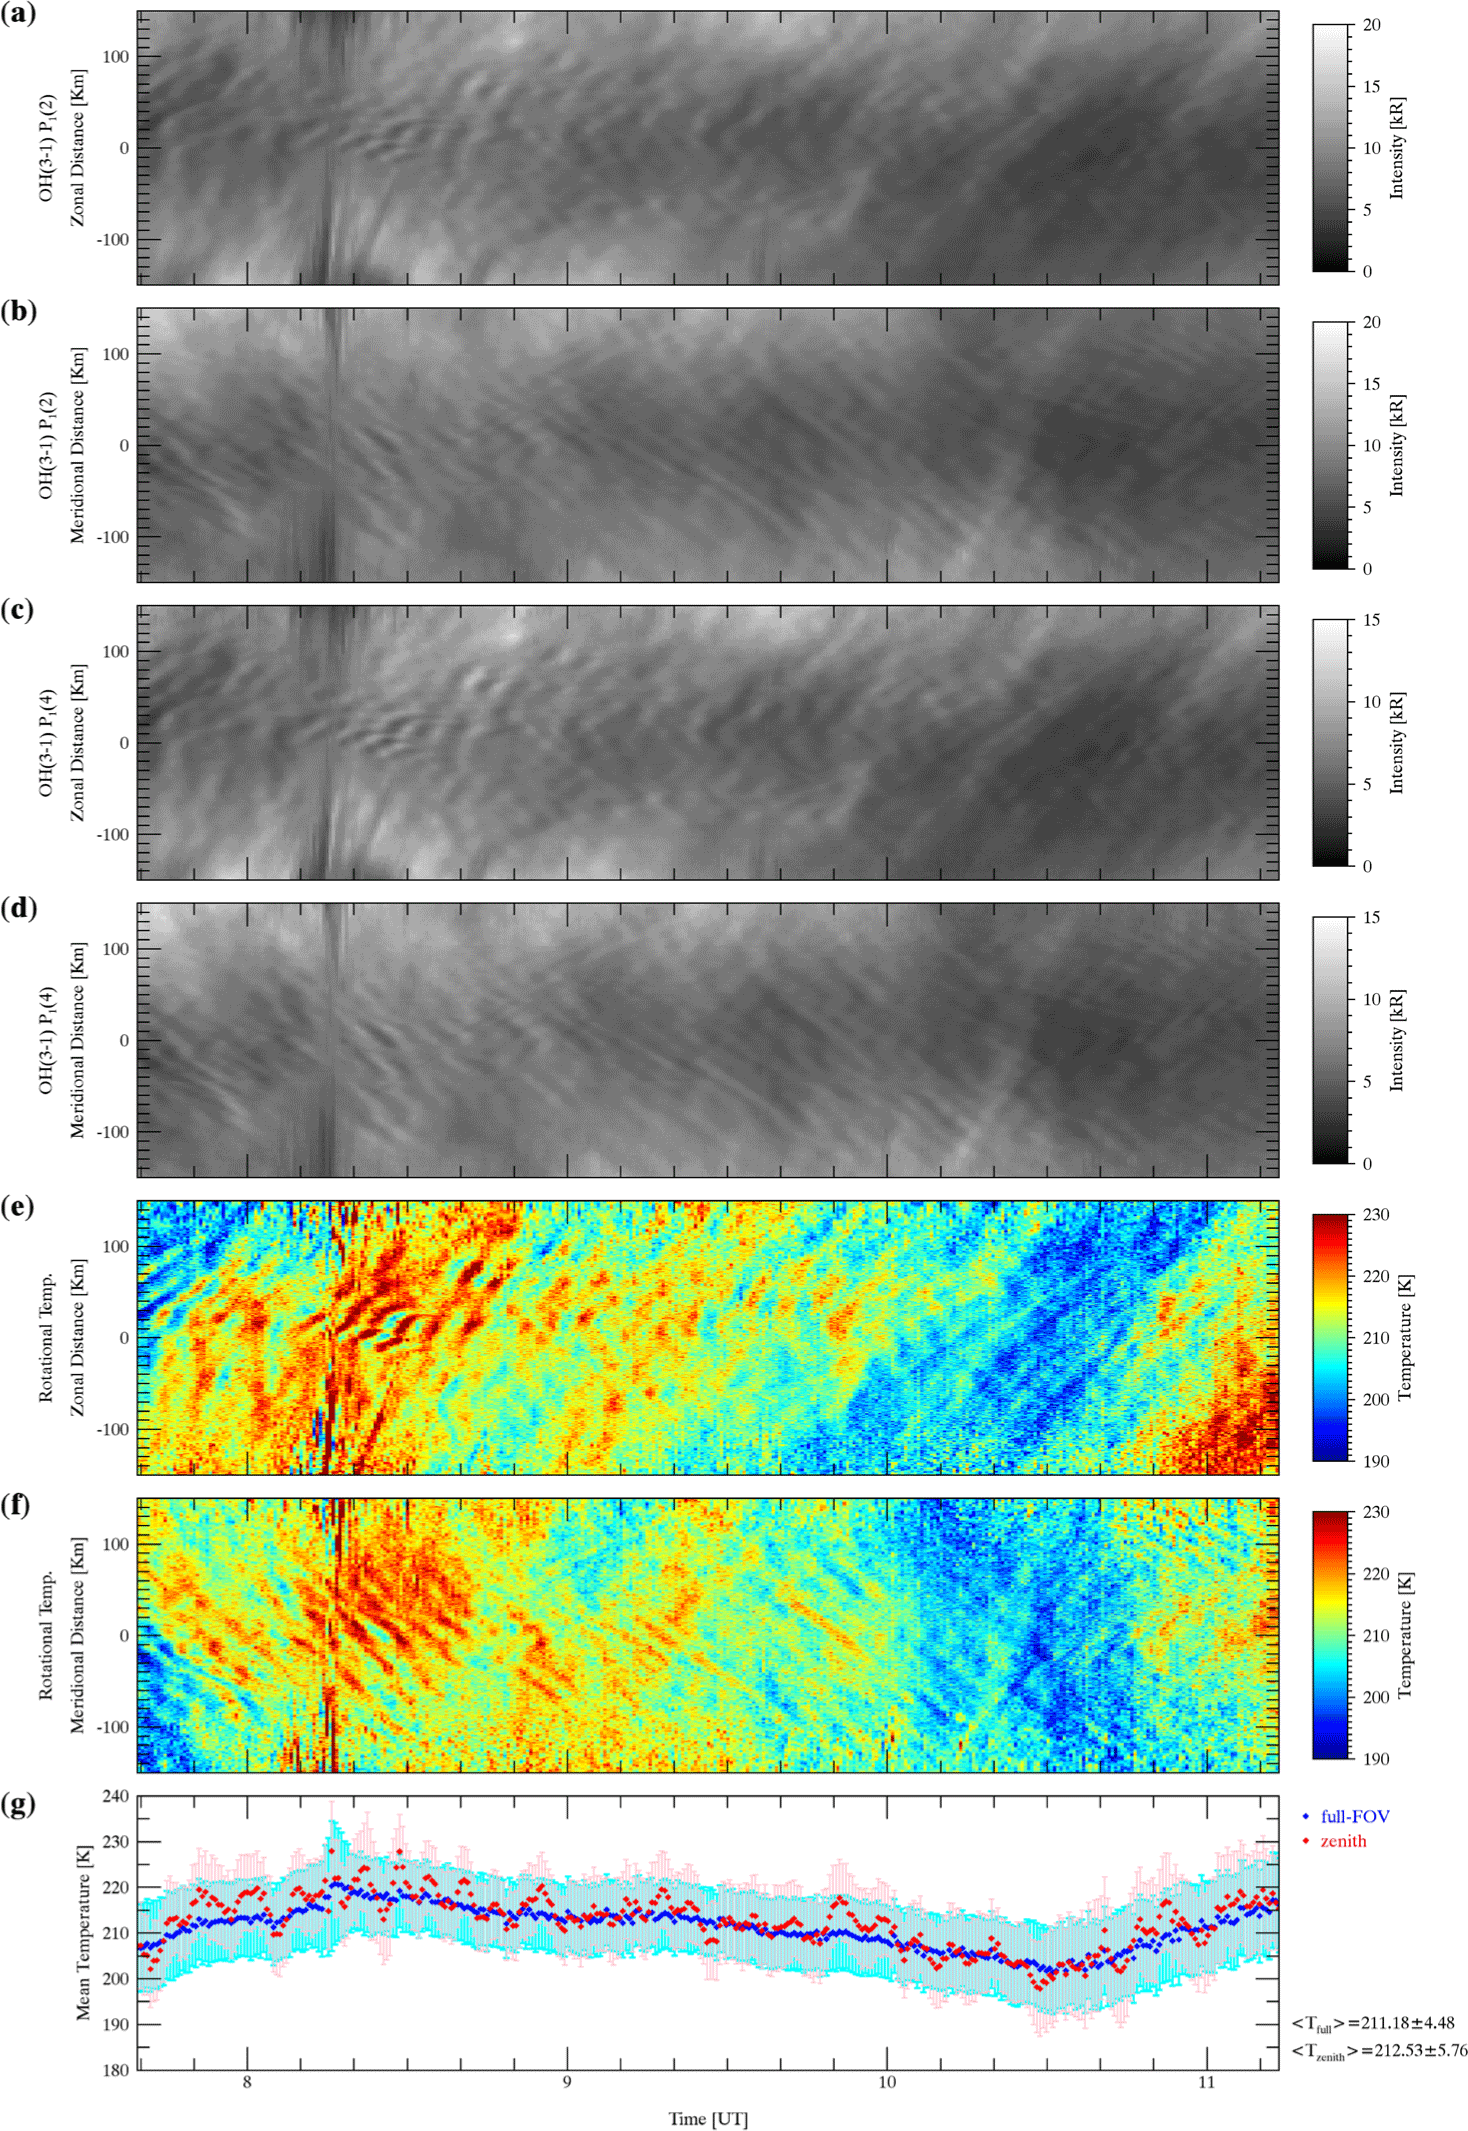
The effective nighttime observations are considered only when the clear sky continues to exist at least for two consecutive hours. With this clear sky condition, there were only 28 nights in 2023 as shown in Table 3. Fig. 7 shows the keograms for the emission intensities of P1(2) and P1(4) and the estimated rotational temperature in the zonal and meridional directions during the night on June 29, 2023. Also shown at the bottom panel of the figure is the mean temperatures with standard deviations for the entire field-of-view (FOV; blue) and the zenithal region (red) greater than 85° elevation angle. The nightly mean temperatures were calculated to be 211.18 ± 4.48 K for the full-FOV and 212.53 ± 5.76 K for the zenith region. The signatures of GWs were clearly observed in both intensities and temperatures. Also note that even the mean zenithal temperature shows oscillatory behavior associated with GWs while it is averaged out in the mean temperature over the full FOV.
In order to validate the estimated temperature from KSS-AMTM observations, we compared it with the temperature measurements from Aura/MLS and KSS-MR observations at the altitude of the OH layer during the same observation period. For the KSS-MR observations, temperatures were estimated using the FWHM method introduced by Lee et al. (2016). For comparison with KSS-AMTM nighttime temperatures, the KSS-MR temperatures were derived only from meteor radar observations conducted during the nighttime period, specifically from one hour after sunset to one hour before sunrise at the location of KSS. Fig. 8 displays example of the FWHM determination from meteor echo height profiles during the nighttime periods of July 20, 2023. The total number of meteor echoes, maximum peak height (MPH), and FWHM are indicated for each profile. The mesospheric mean temperature (T) at the MPH was calculated using the equation:
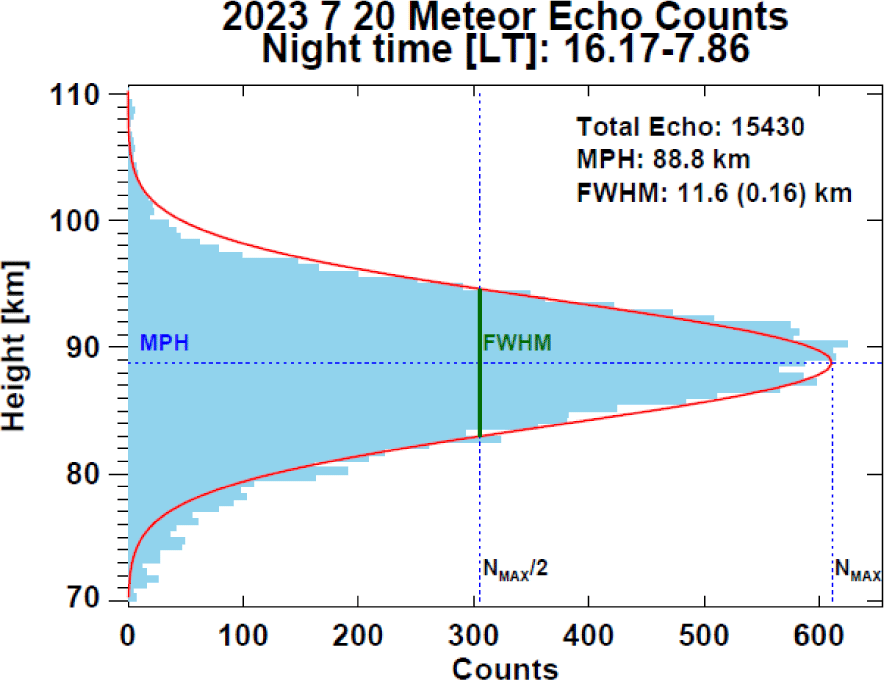
where C is a proportionality constant empirically determined from the linear relationship between observed temperature and FWHM or estimated from pressure measurements around the mesopause region. According to Lee et al. (2018a), the FWHM serves as a key parameter for estimating mesospheric temperatures, and the C value for KSS-MR during 2012–2016 was determined to be C = 16.68 ± 0.26. Using this method, the nighttime mean temperature was calculated from KSS-MR data for 2023, based on the observation period from one hour after sunset to one hour before sunrise.
Unlike KSS-AMTM, which provides continuous temperature variations over time, KSS-MR determines only one daily average temperature or, at most, two values if separated into daytime and nighttime periods. This is because its temperature estimation relies on the FWHM of the meteor echo height distribution rather than direct temperature measurements. Similarly, Aura/MLS does not provide continuous hourly temperature data at a fixed location but instead passes over the vicinity of King Sejong Station once during the daytime and once at night, within a ± 5° latitude range. Due to these limitations, a direct time-series comparison of the three instruments over the course of a day is difficult, and instead, we conducted a comparison of nighttime mean temperatures.
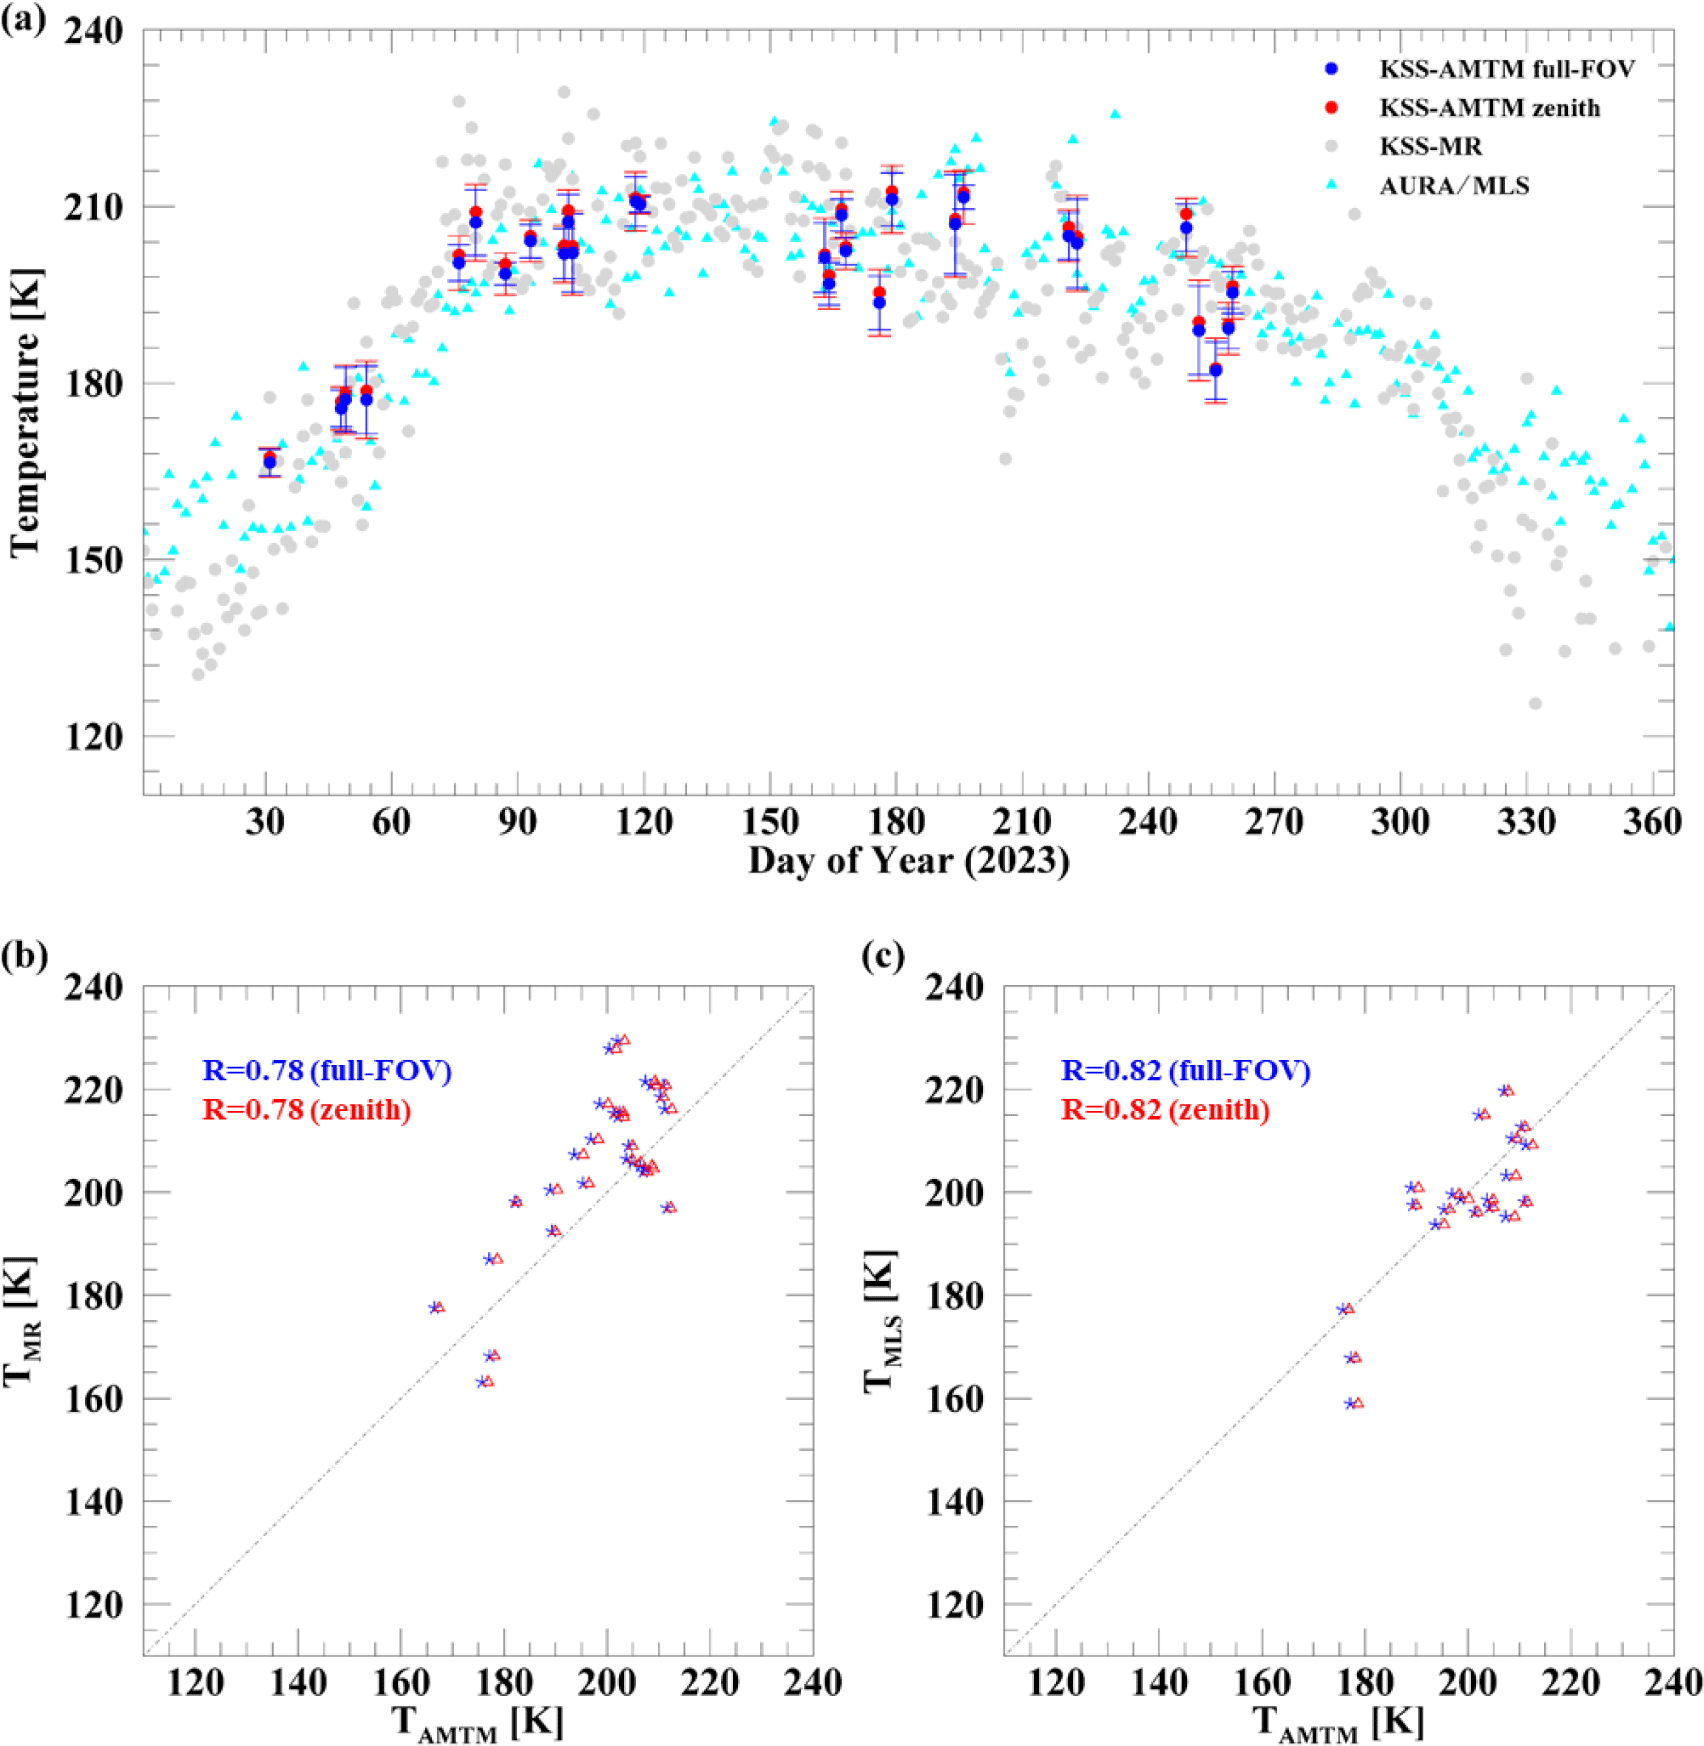
Fig. 9(a) shows the nighttime mean rotational temperatures measured by the KSS-AMTM during the 28 nights in 2023 (blue and red filled circles with error bars), along with independent temperature measurements from KSS-MR (grey dot) and Aura/MLS (cyan triangle) observations. All measurements are generally consistent, ranging from 160 K to 220 K. Fig. 9(b) and (c) show scatter plots comparing the KSS-AMTM temperatures with those measured by KSS-MR and Aura/MLS, respectively. The correlation coefficients are approximately 0.78 for KSS-MR and 0.82 for Aura/MLS, indicating good overall agreement between the datasets.
5. CONCLUSIONS
A new optical instrument, AMTM, was successfully installed in January 2023 to monitor the nighttime mesopause temperature in the two-dimensional space with a diameter of about 300 km. Utilizing the advanced Short-Wave Infrared (SWIR) imaging technology, the KSS-AMTM generated high-resolution, two-dimensional OH airglow intensity and rotational temperature data over 28 clear nights in 2023, unaffected by lunar or stray light interference. In particular, the observed data also revealed strong evidence of GW activity in the two-dimensional maps of both emission intensity and temperature.
As a validation of the new measurement of the mesopause temperature, the KSS-AMTM results were compared with Aura/MLS and KSS-MR observations, confirming the reliability of the KSS-AMTM observations with the correlation coefficients of about 0.78 for both observations.
Together with co-located MR observations, the KSS-AMTM observations provide valuable information on the mesopause region. With exceptionally high temporal resolution, it enables us to conduct advanced analyses, such as M-transform studies, to investigate the propagation properties of GWs, including their wavelengths, phase speeds, and directionality. Continuous long-term monitoring of the OH intensity and temperature in the two-dimensional space is expected to be complementary to the MR observation to uncover the detailed structure of GWs and their effects on MLT dynamics.
