1. INTRODUCTION
Comets, the celestial nomads of our cosmic neighborhood, have consistently captivated the attention and imagination of astronomers throughout the annals of human history. These enigmatic objects, composed of frozen materials, dust, and rocky constituents, hold the keys to deciphering the profound mysteries surrounding the inception of our solar system. As they venture close to the Sun, comets transform into transient celestial spectacles, manifesting sublimation processes that give rise to a beguiling luminous coma and an iconic tail, unfailingly extending over vast distances, forever pointing away from the Sun, under the compelling influence of the solar wind (England 2002; Jones et al. 2018).
The understanding of comets, steeped in the pages of history, has undergone a remarkable evolution. Before the 1880s, the radiance of comets in close proximity to the Sun was attributed to a singular recurring sungrazing comet. However, the seminal work of Kreutz and Kirkwood dismantled this long-standing theory, unveiling that these celestial vagabonds are, in truth, fragments born from past encounters with our Sun (Fig. 1).
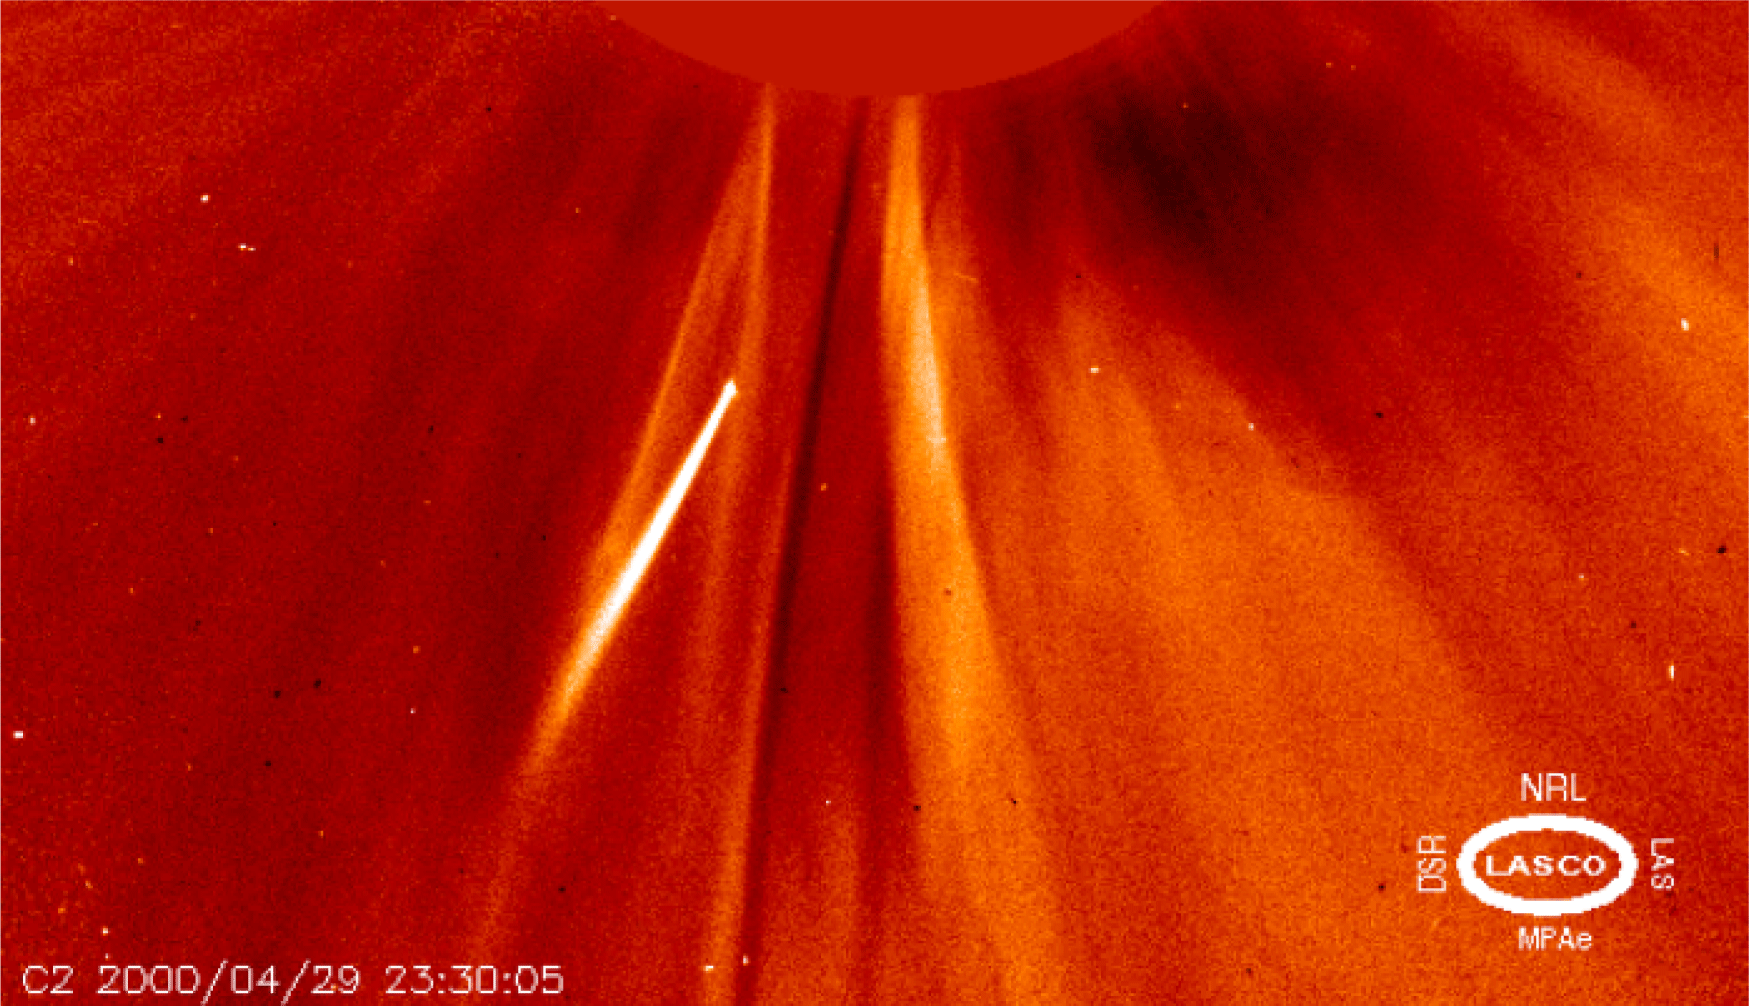
More precise studies aimed at clarifying the classification of sungrazing comet groups have resulted in the categorization of sungrazers into four distinct groups. With the identification of the Meyer, Marsden, and Kracht groups, researchers embarked on a comparative analysis with the Kreutz group to discern their differences and similarities (Marsden 1967). One notable distinction lies in the trajectories and orbital dynamics of these comet groups. While Kreutz comets typically follow similar trajectories stemming from a single progenitor comet, other groups like Meyer, Marsden, and Kracht may exhibit more diverse orbital paths and characteristics, possibly influenced by variations in their origins or interactions within the solar system (Knight et al. 2010).
Initially, research efforts predominantly focused on the Kreutz group, driven by its abundance and visibility, particularly after the widespread adoption of coronagraphic observations post-1979. However, with the advent of technological advancements and the availability of more data, notably from the Solar and Heliospheric Observatory (SOHO)/The Large Angle and Spectrometric Coronagraph (LASCO) instrument in 1996, attention gradually shifted towards studying other comet groups such as Meyer, Marsden, and Kracht. Despite being investigated later, these groups were found to have fewer detected comets and were situated relatively farther from Earth compared to the Kreutz group. This realization prompted a renewed interest in the Kreutz group due to its proximity and higher detection rates (Lee et al. 2007).
Comprehensive investigations into the intricate features of comet structures and their orbital dynamics have fueled scientific inquiry (Hasegawa & Nakano 2001; Sekanina & Kracht 2013). Deciphering the resilience of sungrazing comets in the face of extreme conditions during perihelion passage is a matter of paramount importance. Variables such as size, distance, and composition (Marsden 2005), emerge as decisive factors influencing their endurance. Even the most imposing comets are not impervious to the perils of fragmentation, disintegration, or damage as they traverse the intense heat, radiation, and gravitational forces of their perilous journey (Ohtsuka et al. 2003; Vokrouhlický et al. 2019).
Furthermore, the study of these celestial travelers offers invaluable insights into the very genesis of our solar system, notably with respect to the delivery of water to our terrestrial abode, Earth. Long-period comets, originating from the distant Oort cloud, traverse unique trajectories that unveil snapshots of the early narrative of our cosmic vicinity (Biermann et al. 1983; Whipple 2000; Rickman 2014). In addition, these comets serve as indispensable markers of the Sun’s behavior, offering critical perspectives on solar flares and occasional encounters among themselves (Iseli et al. 2002; Jia et al. 2014). In light of their potential ramifications for Earth, the examination of interactions between these comets and the Sun stands as a matter of paramount consequence (Bzowski & Krolikowska 2005; Brown et al. 2011; Rasca et al. 2014; Hou et al. 2021; Fouchard et al. 2023).
Furthermore, scientists have ventured into the tantalizing exploration of potential connections between sungrazing comets, and the enigmatic celestial entity known as Planet X (Whitmire 2016; Batygin et al. 2019).
2. DATA AND METHODS
Commencing our study, we initiated the data collection phase by sourcing pertinent data from the SOHO webpage. The data we acquired was selected specifically for the purpose of conducting in-depth observations and analyses of sungrazing comets.
In the preparatory stages of our data analysis, we undertook various data preprocessing measures aimed at optimizing the dataset’s quality and suitability for our research objectives. This process encompassed the removal of redundant or duplicate observations and comprehensive data cleansing to rectify any discrepancies or inaccuracies present in the raw data. Additionally, any potential outliers, which could introduce bias or distortion into our analyses, were meticulously identified and subsequently eliminated. Data transformation, if deemed necessary, was executed to normalize, or scale variables in alignment with the demands of our analysis.
The core of our analytical approach lies in the effective utilization of the density-based spatial clustering of applications with noise (DBSCAN) algorithm. The selection of DBSCAN parameters assumes critical importance in ensuring the precise categorization of the comet data. The epsilon value (ε), set at 0.15, determines the radius within which data points are considered as neighbors. When selecting the epsilon value (ε) for the DBSCAN algorithm, it’s essential to find a balance. If the epsilon value is set too high, for instance, at 3, it would encompass a broader range, including a larger number of comets within the defined neighborhood. However, this approach also means incorporating more dissimilar parameters, potentially leading to less precise clustering results. Therefore, setting epsilon to 0.15, we strike a balance where we include enough comets while maintaining similarity among the parameters. This threshold ensures a comprehensive analysis by including enough comets while maintaining similarity among parameters. This balance is crucial for categorizing sungrazing comets effectively, capturing essential characteristics among clustered data points while minimizing outliers.
Furthermore, we established a minimum threshold of 5 comet instances as the requisite number of data points needed to form a dense region, contributing to the formation of distinct clusters. These parameters are of high significance, as they are instrumental in the identification of comet instances clustered based on their spatial density, thereby facilitating the categorization of sungrazing comets into well-defined groupings.
DBSCAN, an acronym for density-based spatial clustering of applications with noise, stands as a versatile and highly esteemed density-based clustering algorithm, renowned for its proficiency in uncovering clusters within intricate and multifaceted datasets. Unlike some other conventional clustering techniques, such as K-means, DBSCAN distinguishes itself by its unique feature: it does not necessitate a predetermined count of clusters. Furthermore, it excels in the identification of clusters characterized by varying shapes and structures. These exceptional capabilities hinge on the two pivotal parameters, namely, epsilon (ε) and the minimum number of data points (MinPts).
Epsilon (ε): This parameter serves as a threshold, defining a radius that demarcates the ε-neighborhood, within which data points are considered neighbors. To merit inclusion within the same cluster, a data point must demonstrate at least MinPts data points within this ε-neighborhood. Essentially, ε establishes a proximity threshold, delineating the requisite closeness for data points to be deemed part of a shared cluster.
The MinPts parameter stipulates the minimum count of data points necessary to constitute a dense region. A data point attains the status of a core point when its ε-neighborhood encompasses at least MinPts data points. Core points serve as a core point around which clusters coalesce.
These data points stand as the central pillars of clusters, demonstrating the presence of at least MinPts data points within their ε-neighborhoods.
Border Points: While not themselves core points, border points reside within the ε-neighborhoods of core points, marking the periphery of clusters.
Noise Points: Noise points are data points devoid of core or border point attributes, evading association with any specific cluster. Typically, these points represent outliers within the dataset.
Established categories (C-Established): These are the predefined or previously recognized categories of comets, typically based on traditional classification methods or expert knowledge.
Categories from DBSCAN (C-DBSCAN): These represent the categories or clusters identified by applying the DBSCAN algorithm to the comet data.
Jaccard similarity coefficient (J): The Jaccard similarity coefficient (J) between two sets A and B is defined as:
In this context, A = C – Established and B = C – DBSCAN:
Therefore, the Jaccard similarity coefficient (J) between the established categories and the categories identified by DBSCAN is computed as:
After validating the categorization using the Jaccard coefficient, statistical analysis is performed on the orbital parameters of Kreutz comet subgroups.
This analysis provides insights into the variability of orbital parameters within each subgroup, further corroborating the clustering results. By assessing the consistency and variability of orbital parameters, the statistical analysis adds another layer of validation to the categorization process.
3. RESULTS
We have validated our comet categorization approach based on the DBSCAN algorithm. Our validation process encompassed a meticulous comparison of our findings with previously established comet categories. This comprehensive verification involved an examination of the orbital parameter values associated with the categorized comets, assessing their alignment with the known comet categories.
-
The DBSCAN method effectively demonstrates its prowess in grouping multivariable data within the sungrazing comet dataset.
-
The Kreutz comet group was subdivided into four well-defined subgroups with unique orbital characteristics.
-
Uniform clustering of perihelion positions across the Kreutz comet subgroups indicated their interconnected nature.
-
Each subgroup (A, B, C) deviates by approximately ±20 degrees to the left and right of the primary comet orbit.
-
A minor away Group D was identified, indicative of slightly varying orbital parameters.
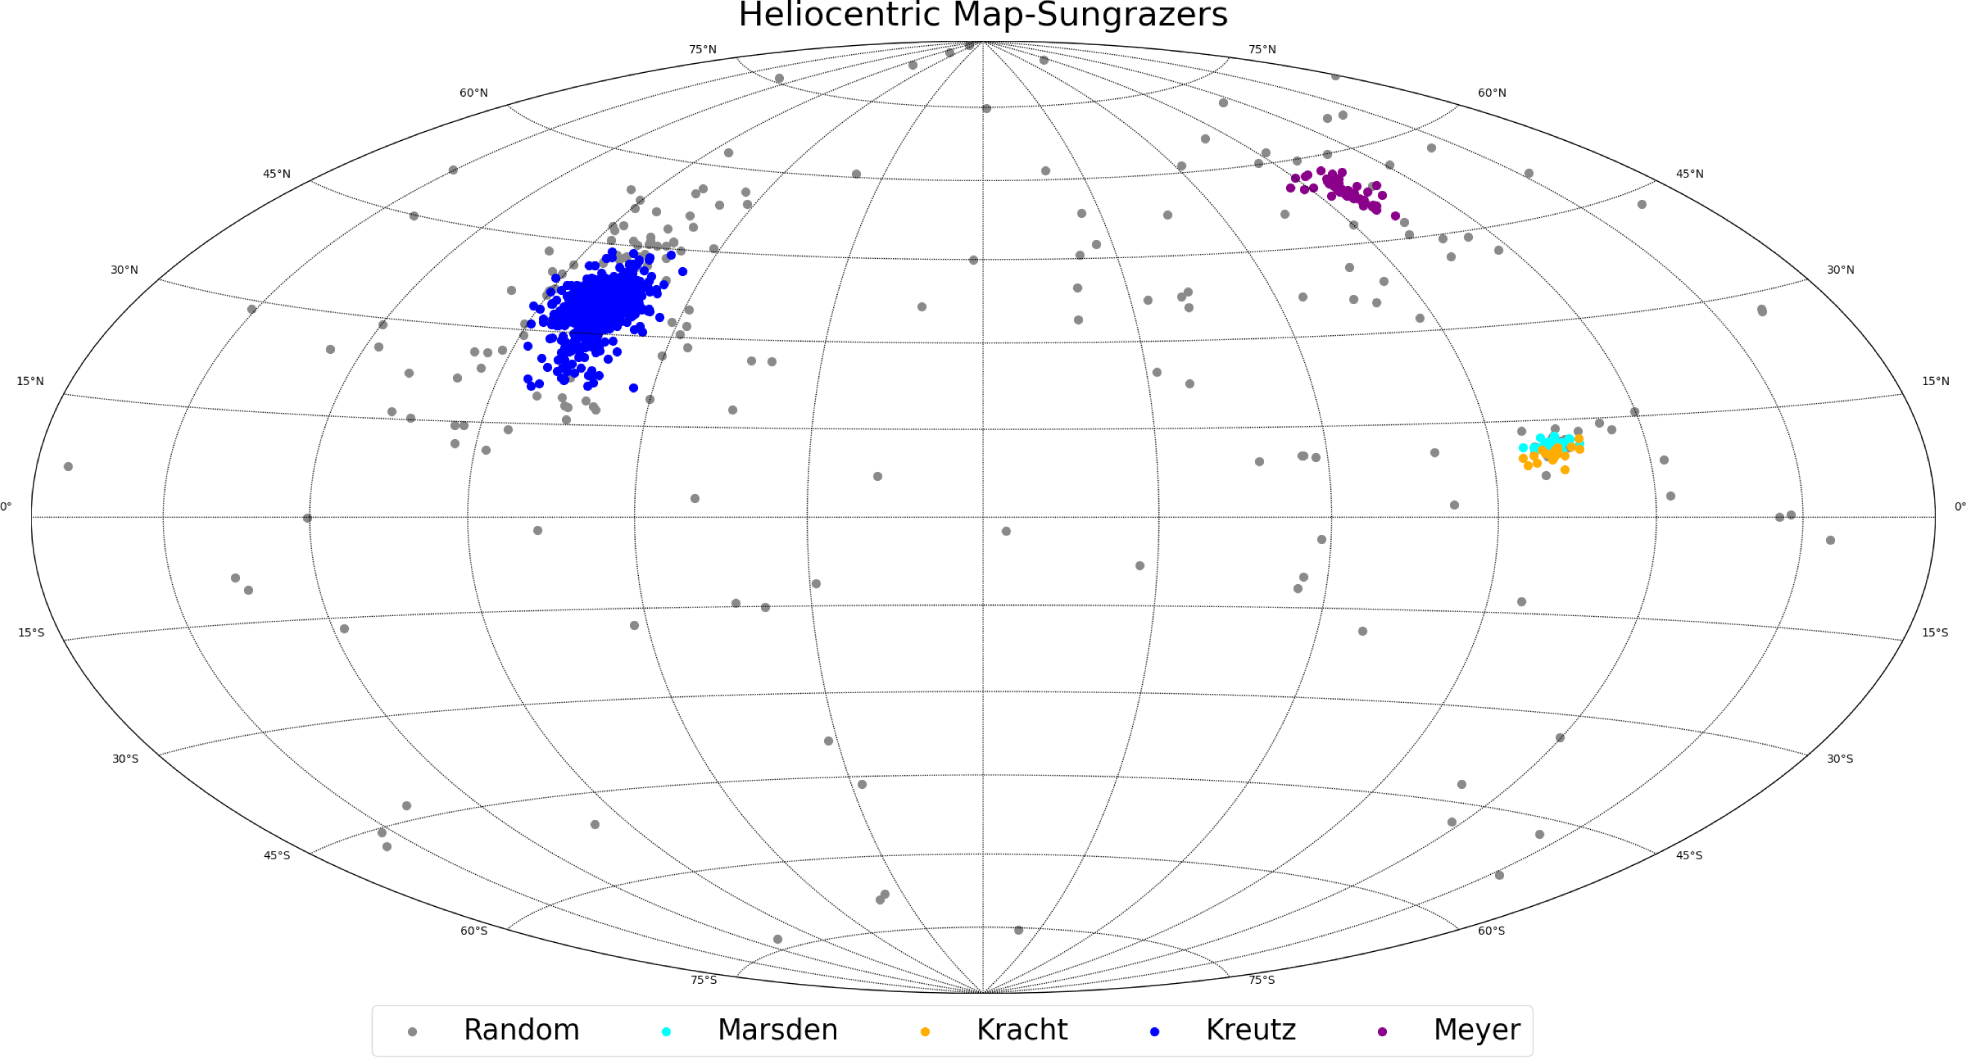
Building on the insights gained from our DBSCAN analysis and initial classifications, we embarked on an illuminating exploration of the heliocentric ecliptic map. This spatial representation provided valuable insights into following the successful application of the DBSCAN method to categorize comets into their respective groups, we initially presented Fig. 2, which provided a heliocentric ecliptic map illustrating the longitude (l) and latitude (b) of perihelion variables of comets.
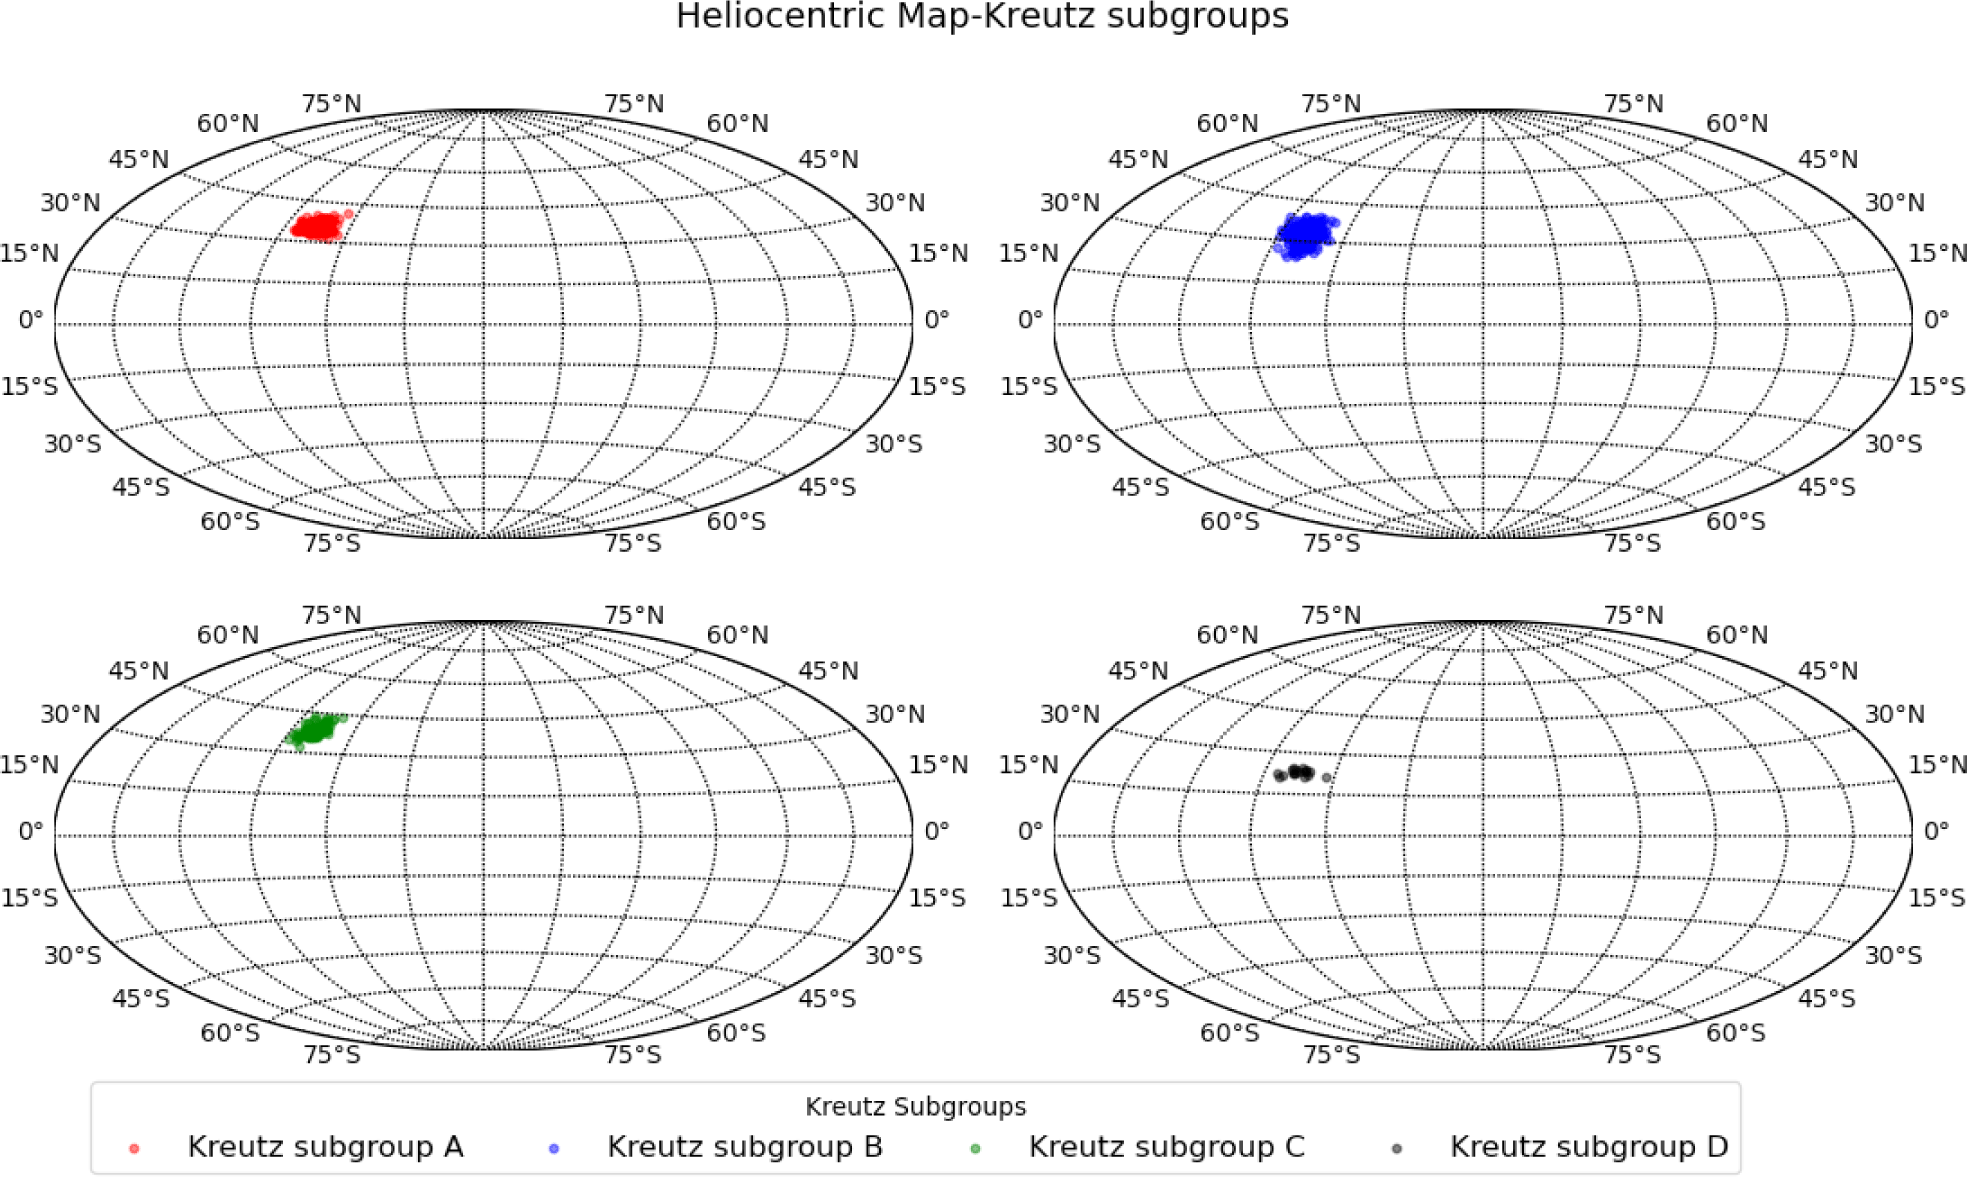
The heliocentric ecliptic map presented in Fig. 3 delineates the four Kreutz subgroups distinctly, illustrating their precise locations on the map. This visual depiction enables clear differentiation between each subgroup, providing an accurate representation of their respective positions.
In our quest to validate and solidify the reliability of the DBSCAN method, we turned to the scatter plot matrix as a powerful tool. This visual representation, as displayed in Fig. 4, serves as a compelling means of discerning the distinctive subgroups within the Kreutz sungrazing comets, all accomplished post-DBSCAN application. The scatter plot matrix unveils the underlying structures and interrelationships between orbital parameters, offering a visual confirmation of the clustering efficacy achieved through the DBSCAN approach.
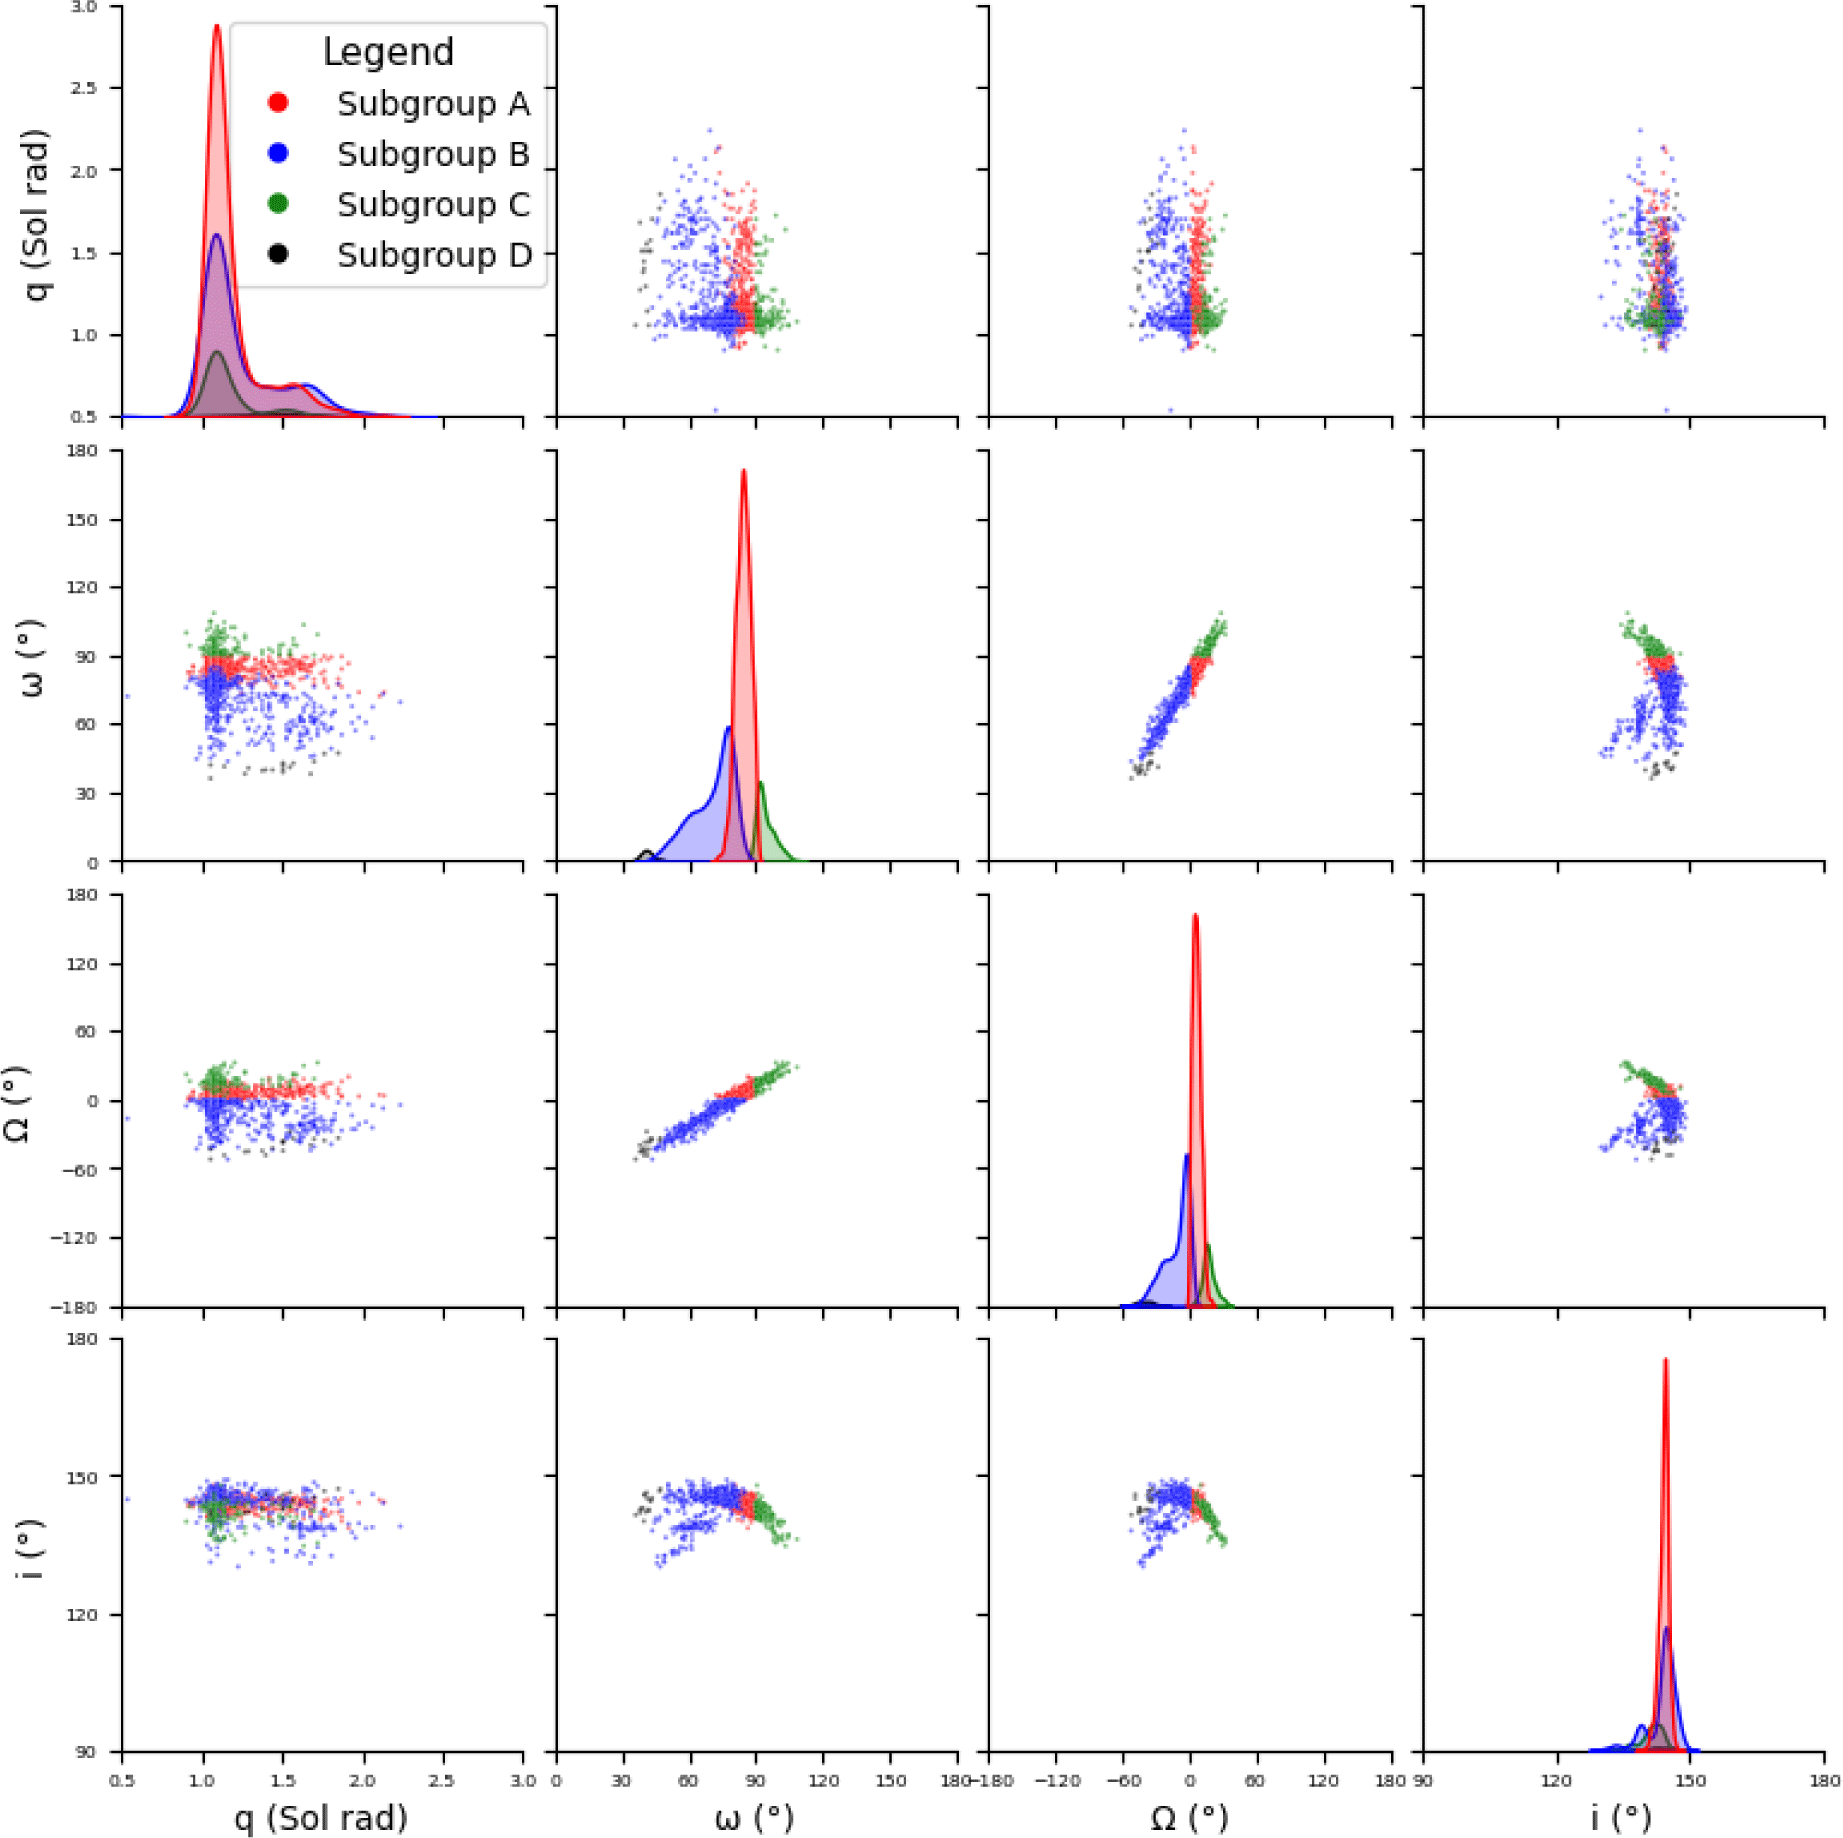
In this scatter matrix plot the ω (°) represents the argument of perihelion, Ω (°) is the longitude of the ascending node, i (°) is the inclination of the orbit and the q stands for perihelion distance from the sun in astronomical units (AU).
Thus, through thorough analysis using the scatter plot matrix and mapping tool, we can confidently identify the presence of these subgroups within the Kreutz sungrazing comets. This visual confirmation further validates the precision and reliability of the DBSCAN methodology, affirming the accurate segmentation of comet data based on specific orbital characteristics. Such visual evidence significantly enhances our understanding of the dynamics within this group.
Following the analysis of outcomes from employing the DBSCAN method and examining the Scatterplot Matrix, we calculated the mean orbital parameters for the four distinct Kreutz comet subgroups, as detailed in the subsequent table (Table 1).
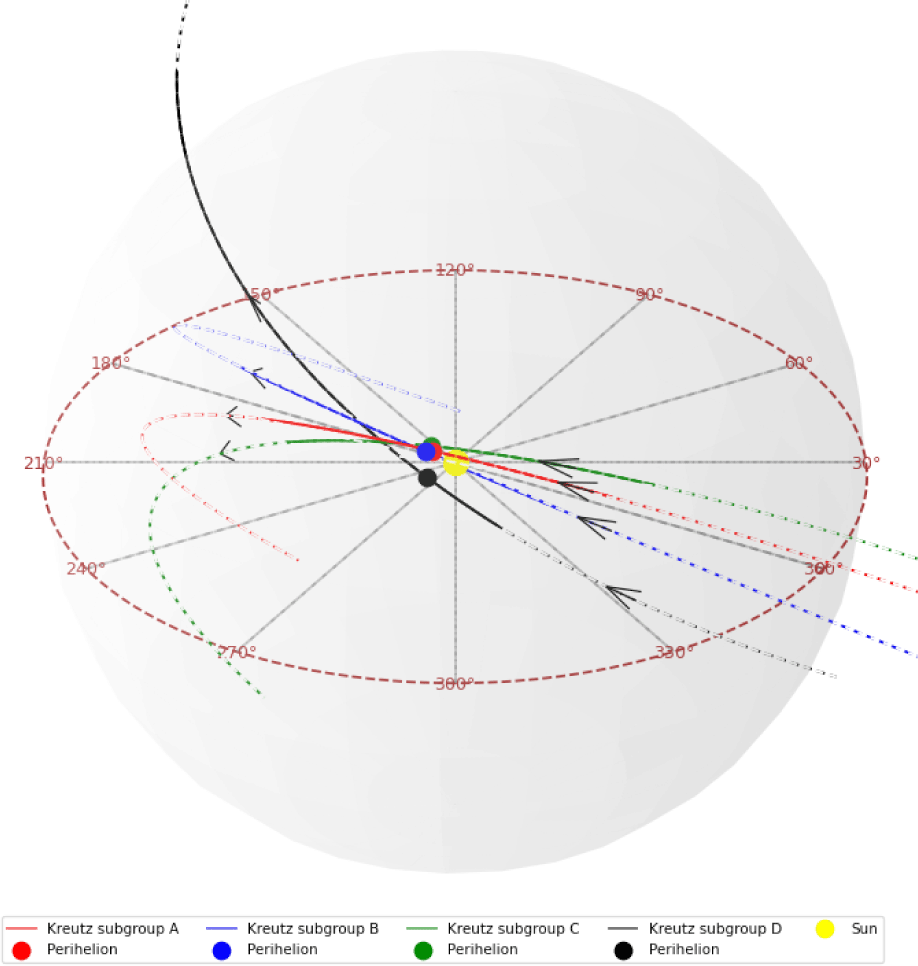
The 3D visualization (Fig. 5) of the comet trajectories reveals distinct clustering among the three major comet subgroups (labeled A, B, and C), indicating their relatedness. However, the fourth subgroup (labeled D) appears slightly more isolated, suggesting potential variations in origin and destination trajectories compared to the other subgroups. This observation further corroborates the findings from the scatter matrix plot and the DBSCAN grouping methods, as the resulting trajectories align with the clusters identified through these techniques.
4. SUMMARY AND DISCUSSION
The application of the DBSCAN algorithm has unequivocally demonstrated its prowess in categorizing comets based on orbital parameters, validating the method’s precision and effectiveness in our classification efforts. In a significant breakthrough, our study utilized the DBSCAN algorithm to validate the existence of established comet groups, such as Kreutz, Meyer, Marsden, and Kracht.
Expanding our inquiry, we employed DBSCAN to analyze deeply the Kreutz comet group. This endeavor resulted in the subdivision of Kreutz into four distinct subgroups (A, B, C, D), each characterized by unique orbital signatures. Through this process, further reinforced by scatter plot matrix analysis, we underscored DBSCAN’s capacity to partition complex celestial data into meaningful segments. A systematic observation within this section revealed that all Kreutz sungrazing comets consistently traverse their orbits in a clockwise direction, a phenomenon meriting further examination.
Our investigation into the trajectories of the Kreutz comet group, utilizing advanced clustering methodologies, reveals noteworthy patterns. Subgroups A, B, and C showcase a high degree of orbital consistency, whereas subgroup D exhibits a discernible yet subtle deviation in its mean trajectory, particularly evident in the three-dimensional representations. This nuanced distinction in 3D orbital trajectories emphasizes the probable influence of argument of perihelion and perihelion distance variation within subgroup D, contributing to its unique orbital characteristics compared to the more uniform patterns observed in A, B, and C.
Our investigation unveils a unique destruction pattern in the Kreutz comet group, occurring remarkably close to the Sun at limits of 0.8 to 1.1 solar radii, sometimes managing to travel further than that. Unlike conventional celestial bodies, their destruction process extends beyond established limits, necessitating further inquiry into the specific factors governing their resilience. The exceptional nature of the Kreutz comets, potentially could have been influenced by material composition or travel speed, underscores the need for focused research to unravel the intricate dynamics of cometary destruction in close proximity to the Sun.
