1. INTRODUCTION
Polar mesospheric summer echoes (PMSEs) are sub-visible phenomena occurring at altitudes of 80–90 km in the upper mesosphere and D-region ionosphere, detectable by radar operating within a frequency range of 3–300 MHz (Balsley et al. 1983; Cho & Röttger 1997). In addition, noctilucent clouds (NLC) occur in the same altitude region, coexisting in the same volume of atmosphere with the upper PMSE and lower NLC layers (Stebel et al. 2000; Kaifler et al. 2011). Both PMSE and NLC are composed of charged ice particles; however, PMSE particles range in size from 10–50 nm, whereas NLC particles are larger, exceeding 50 nm (Nussbaumer et al. 1996; von Zahn & Bremer 1999). PMSE scatterers can be generated at temperatures below 150 K (Rapp & Lübken 2004; Rapp & Thomas 2006; Li & Rapp 2013). PMSE refers to the reflected radar signal from the summer mesospheric irregularities including electron density and charged ice particles, which act as PMSE scatterers. For the purpose of this study, the term PMSE can be used to refer to these scatterers as well. Meteorite smoke particles can serve as nuclei for water vapor adsorption and subsequent ice particle formation. The ice particles grow through vapor deposition. Therefore, PMSE is considered a precursor to NLC, which becomes visible as the initially subvisible ice particles grow and sediment (Cho & Röttger 1997).
For approximately two decades since the discovery of PMSE, scientists have attempted to interpret its formation primarily based on atmospheric factors, including neutral temperature, tidal waves, and gravity waves (Ecklund & Balsley 1981; Cho & Röttger 1997; Rapp & Lübken 2004; Rapp & Thomas 2006; Li & Rapp 2013).
Several publications have investigated the local time (LT) variation of PMSE (Hoffmann et al. 1999; Bremer et al. 2001; Liu et al. 2013). Hoffmann et al. (1999) identified a LT dependence in PMSE echo intensity, as measured by the signal-to-noise ratio (SNR). They observed a clear maximum at 13–14 LT and a minimum at approximately 19–21 LT, which remained stable throughout the summer season. Moreover, a second maximum occurred near midnight/early morning hours (23–02 LT), although it was unstable (Hoffmann et al. 1999). Therefore, the occurrence of PMSE at midnight is dependent on specific conditions and not regulated by solar illumination, as observed with solar tides. Bremer et al. (2001) reanalyzed the same dataset from 1999 and demonstrated that the SNR at 21–05 LT significantly improved for high ΣK by 9–11 dB compared to low ΣK. Liu et al. (2013) reported the semi-diurnal variation of PMSE, with the primary maximum observed at local midnight and a secondary maximum near noon, based on observations at the SuperDARN Zongshan station in Antarctica.
Recently, energetic electron precipitation induced by geomagnetic disturbance has been recognized as a significant contributor to PMSE production (Zeller & Bremer 2009; Kirkwood et al. 2013; Lee et al. 2013, 2014, 2015, 2018, 2020). During high-speed solar wind streams (HSSs), PMSE exhibits periodicities of 7, 9, and 13.5 days, in phase with solar wind speed and the auroral electrojet (AE) index (Lee et al. 2013). This indicates the significance of the AE, as represented by the AE index, during HSS events. Therefore, we can infer that favorable conditions for PMSE production are facilitated by D-region ionization induced by energetic electron precipitation (≥ 30 keV), primarily driven by substorms (Meredith et al. 2011; Kavanagh et al. 2012). The concept of the auroral substorm was introduced by Akasofu et al. (1966), who observed a sudden brightening of the auroral arc with the onset of the substorm expansion phase near the equatorward boundary of the auroral oval, close to midnight, followed by poleward expansion.
The onset of the substorm is recognized when the interplanetary magnetic field (IMF) is southward or when the IMF Bz turns northward after a previous 12 h southward duration (Hargreaves 1992). Substorms can be identified through variations in ground magnetic field measurements within the high latitude auroral oval, particularly in the dusk-midnight sectors (McPherron & Chu 2016). The H component of the magnetic field experiences negative (positive) excursions in the post-midnight (from dusk to premidnight) sector owing to the presence of westward (eastward) electrojet currents (Akasofu et al. 1966). The degree of local geomagnetic disturbance can be normalized using the K-index.
PMSE is characterized by its occurrence as well as its horizontal and vertical dynamics (Lee et al. 2014, 2018). Extreme horizontal echo speeds (≥ 300 m/s) and signatures of triggering gravity waves have been observed (Lee et al. 2014, 2018). However, Lee et al. (2014) focused on the occurrence of high velocities in day-to-day variations of solar wind speed and the AE index, overlooking the velocity variations at high temporal resolutions. The D region is a layer where the ionization induced by energetic electron precipitation (≥ 30 keV) can occur, and is where the pulsating aurora is draped down (Akasofu et al. 1966). The pulsating aurora patch exhibits westward drift in the pre-midnight sector and eastward drift in the post-midnight sector at speeds of 50–300 m/s because of the convection field, extending its lower edge to approximately 80 km (Scourfield et al. 1983; Hosokawa & Ogawa 2015; Yang et al. 2017; Humberset et al. 2018). Understanding the zonal velocity pattern in PMSE is crucial, as PMSE can be associated with the eastward drift of auroral patches during auroral onset (if incorporated into the dawn sector) or the westward drift (in the dusk sector). In the summer mesosphere, the zonal wind is predominantly westward without the influence of geomagnetic factors.
Therefore, this study reanalyzed the ESRAD PMSE data according to magnetic local time (MLT), considering the K-index levels. Additionally, the zonal velocity profile was examined to observe the variations in the height profile at high temporal resolution (2 min) based on geomagnetic activity.
2. DATA AND ANALYSIS
The Esrange VHF (52 MHz) mesosphere–stratosphere–troposphere (MST) radar (ESRAD) is situated in Esrange, Sweden (67.8°N, 20.4°E; magnetic latitude: 64.75°N) and provides information on atmospheric dynamics, including winds, waves, and turbulence.
During summer, the radar is specifically configured to observe the mesosphere within the altitude range of 75–95 km. A technical description of ESRAD can be found in the work of Chilson et al. (1999). The intensity of PMSE is quantified using the SNR, obtained through full correlation analysis (FCA) (e.g., Briggs et al. 1950). For this study, the fca_150 mode data set with a height resolution of 150 m is analyzed. PMSE events are identified when SNR > 0 dB. The horizontal velocity of the irregularities causing radar echoes is measured using FCA, a spaced-antenna technique (e.g., Briggs 1984), which estimates the “true” velocity in the ground diffraction pattern. In the D region (80–90 km), FCA true velocity (≤ 150 m/s) was found to agree well with imaging Doppler interferometry values (within 10%) (Holdsworth & Reid 2004). The FCA method determines the travel speed of plasma irregularity (or scatterer), caused by either neutral winds or the electric field. In the fca_150 experiment mode, the available sampling time is 0.027 s, determined by the pulse repetition frequency and the number of coherent integrations. This yields an estimated Vmax of approximately 450 m/s for fca_150 (Holdsworth & Reid 1995).
Typically, the FCA technique is applied using all available receivers. However, since only three receiver/antenna segments are necessary to determine the horizontal movement speed, when six segments are available, speed and other parameters can be estimated independently in terms of height and time. This enables us to infer high travel speeds of the scatterers from the differences between the pairs of measurements. Consequently, the speed uncertainty was estimated, for example, as σ = 21.5 m/s for a speed of 300 m/s, resulting in an uncertainty of approximately 7%, based on radar operations from 12 to 31 July 2008. For detailed information on deriving the horizontal scatterer drift velocity using the FCA method for ESRAD data, refer to Kirkwood et al. (2006). The data selection criteria for deriving the FCA true velocity strictly adhere to a normalized time delay of less than 0.4 to ensure good self-consistency of the time delay between antennas (Hocking et al. 1989).
For the investigation of the summer polar D region (80–90 km), the fca_150 data with a height resolution of 150 m is utilized from 1 June to 8 August (doy: 150–220) in 2006. In the summer polar region, strong echoes are specifically observed at approximately 80–90 km to eliminate height aliasing concerns.
For the data analysis, the K-index is employed as a local magnetic field index for Kiruna. The K-index data is obtained from the website (https://www2.irf.se/Observatory/?link=Magnetometers).
3. MAGNETIC LOCAL TIME AND K-INDEX DEPENDENCE
This study examines the hourly variation of PMSE in relation to MLT and incorporates the K-index to account for local geomagnetic activity. In contrast, Lee et al. (2013) investigated the daily variations of PMSE by comparing solar wind speed and AE index. The K-index ranges from 0 to 9, and during the summer of 2006, it varies from 0 up to 7 with data available at 3 h intervals. Even at K-index = 2, the PMSE and zonal velocities still exhibit the influence of geomagnetic activity. However, for the purpose of this study, PMSE and magnetic zonal velocity are categorized into two groups: K < 3 for quiet times and K ≥ 3 for the effects of geomagnetic activity.
This study aims to estimate the impacts of geomagnetic activity and substorms on PMSE occurrence and zonal velocity by analyzing them in terms of MLT and K-index (or K). Therefore, the zonal velocity in geographic coordinates was converted to magnetic zonal velocity using the geomagnetic coordinates denoted as muu.
The MLT variations of the K-index in presence of PMSE are illustrated in Fig. 1(a). In Fig. 1(b), the occurrence of PMSE is counted for each MLT, considering all cases (black), quiet times (blue), and active geomagnetic conditions (red). The estimated PMSE intensity (SNR) is displayed in Fig. 1(c) as a function of MLT across various geomagnetic conditions. As depicted in Fig. 1(a), the K-index is notably higher around midnight at 23–04 MLT compared to the remaining period. In Fig. 1(b), PMSE occurrence appears to be most frequent during the daytime, peaking at 15 MLT, and a similar trend is observed during periods of low geomagnetic activity (K < 3, blue). Conversely, when geomagnetic activity was active (K ≥ 3), the maximum occurrence shifted to 03–04 MLT (red), which was significantly different from the pattern observed at 15 MLT (Fig. 1(b)).
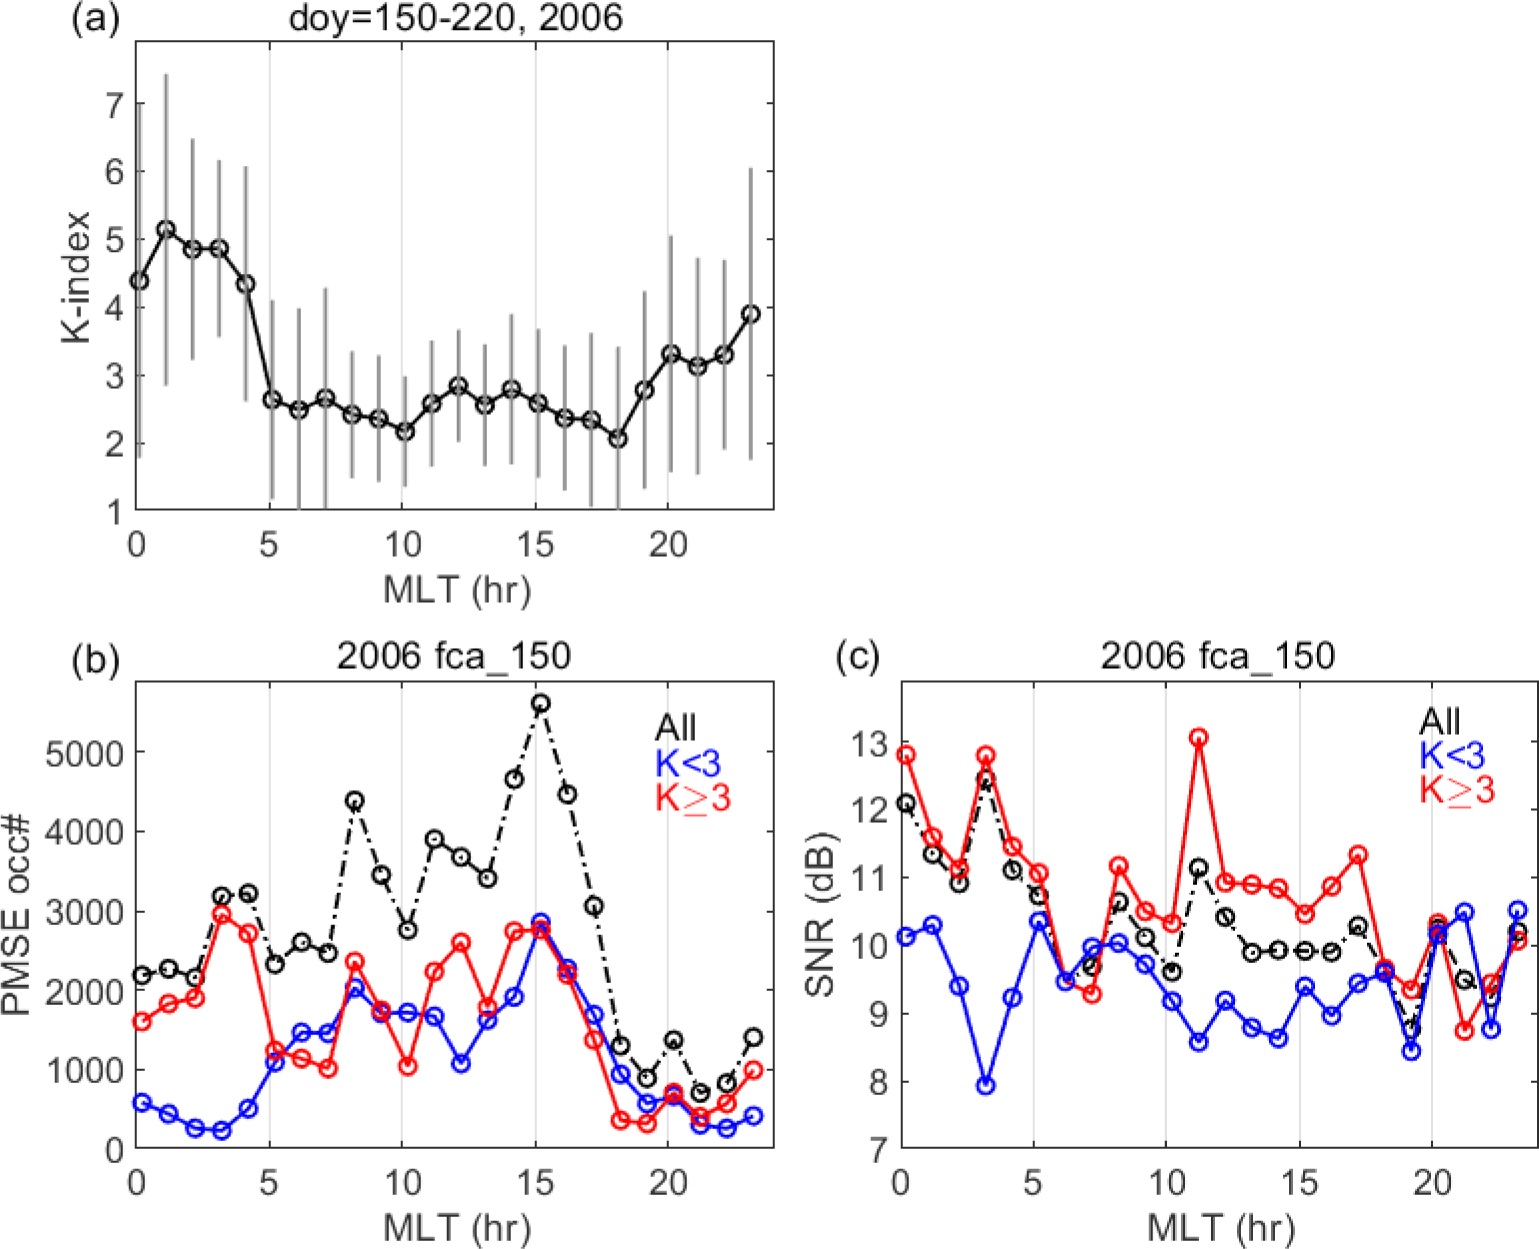
In Fig. 1(c), the SNR exhibited a clear distinction between active and quiet geomagnetic activities, with the upper curves corresponding to K ≥ 3 and the lower curves corresponding to K < 3. The asymmetric structure was evident from 0–5 MLT and 8–17 MLT, displaying a primary maximum at 11 MLT and secondary peaks at 00 and 03 MLT. Additionally, the peaks for K ≥ 3 and troughs for K < 3 were most pronounced at 03 MLT for both SNR and PMSE occurrence.
The magnetotail current extends to the D-/E-region ionospheres through the wedge current, resulting in the peak occurrence of auroral substorms around magnetic midnight hours, spanning from dusk to early dawn, from 20–23 MLT and 0–4 MLT. Medium-energy electrons (> 30 keV) can penetrate into the D region and are scattered by the chorus wave, which simultaneously scatters lower-energy electrons or auroral electrons (< 20 keV) into the E-region ionosphere, inducing intense ionization as described by Lee et al. (2018).
Therefore, according to Hoffmann et al. (1999) and Bremer et al. (2001), the presence of the unstable PMSE peak near midnight can be attributed to substorms associated with strong geomagnetic activity. Liu et al. (2013) reported on the diurnal variation of PMSE observed at the SuperDARN Zongshan station. Owing to its location at a high geomagnetic latitude, the occurrence peaks near local midnight, and a secondary peak is observed at 13–14 local time. Their findings suggested that auroral particle precipitation is crucial for PMSE generation.
Although the absolute counts of PMSE occurring from the pre-midnight to the early dawn sector were lower than those during the daytime, the PMSE occurrence was predominantly influenced by geomagnetic activity near midnight and the early dawn sector. In most cases, substorm occurrence is directly linked to pulsating aurora (Akasofu et al. 1966), emphasizing the significance of considering the potential overlap between PMSE and pulsating aurora.
Hereinafter, the zonal velocity indicates magnetic zonal velocity adjusted to magnetic coordinates. The zonal velocity distribution was examined in terms of K-index according to velocity levels.
The zonal mean velocities recorded from day 150 to 220 in 2006 are presented in Fig. 2(a). As observed, the zonal mean velocity was biased to the west, ranging from −60 to −5 m/s with uncertainties from ±20–40 m/s. The result is consistent with the prevailing westward zonal wind in the high-latitude summer mesosphere, as reported by Stober et al. (2017). Therefore, the background zonal velocity (muu) can be defined within the range of −100 to +80 m/s as the low velocity, and abnormally high velocity can be defined within the ranges of −400 to −100 m/s or +80 to +400 m/s for negative and positive values, respectively (Fig. 2(b) and 2(c)). As depicted in Fig. 2(b), both the low- and high-velocity occurrences increased similarly with the K-index up to K = 3, after which their trends descended with the increasing K values. Note that the low-velocity occurrence abruptly decreased from K = 3 to 4.
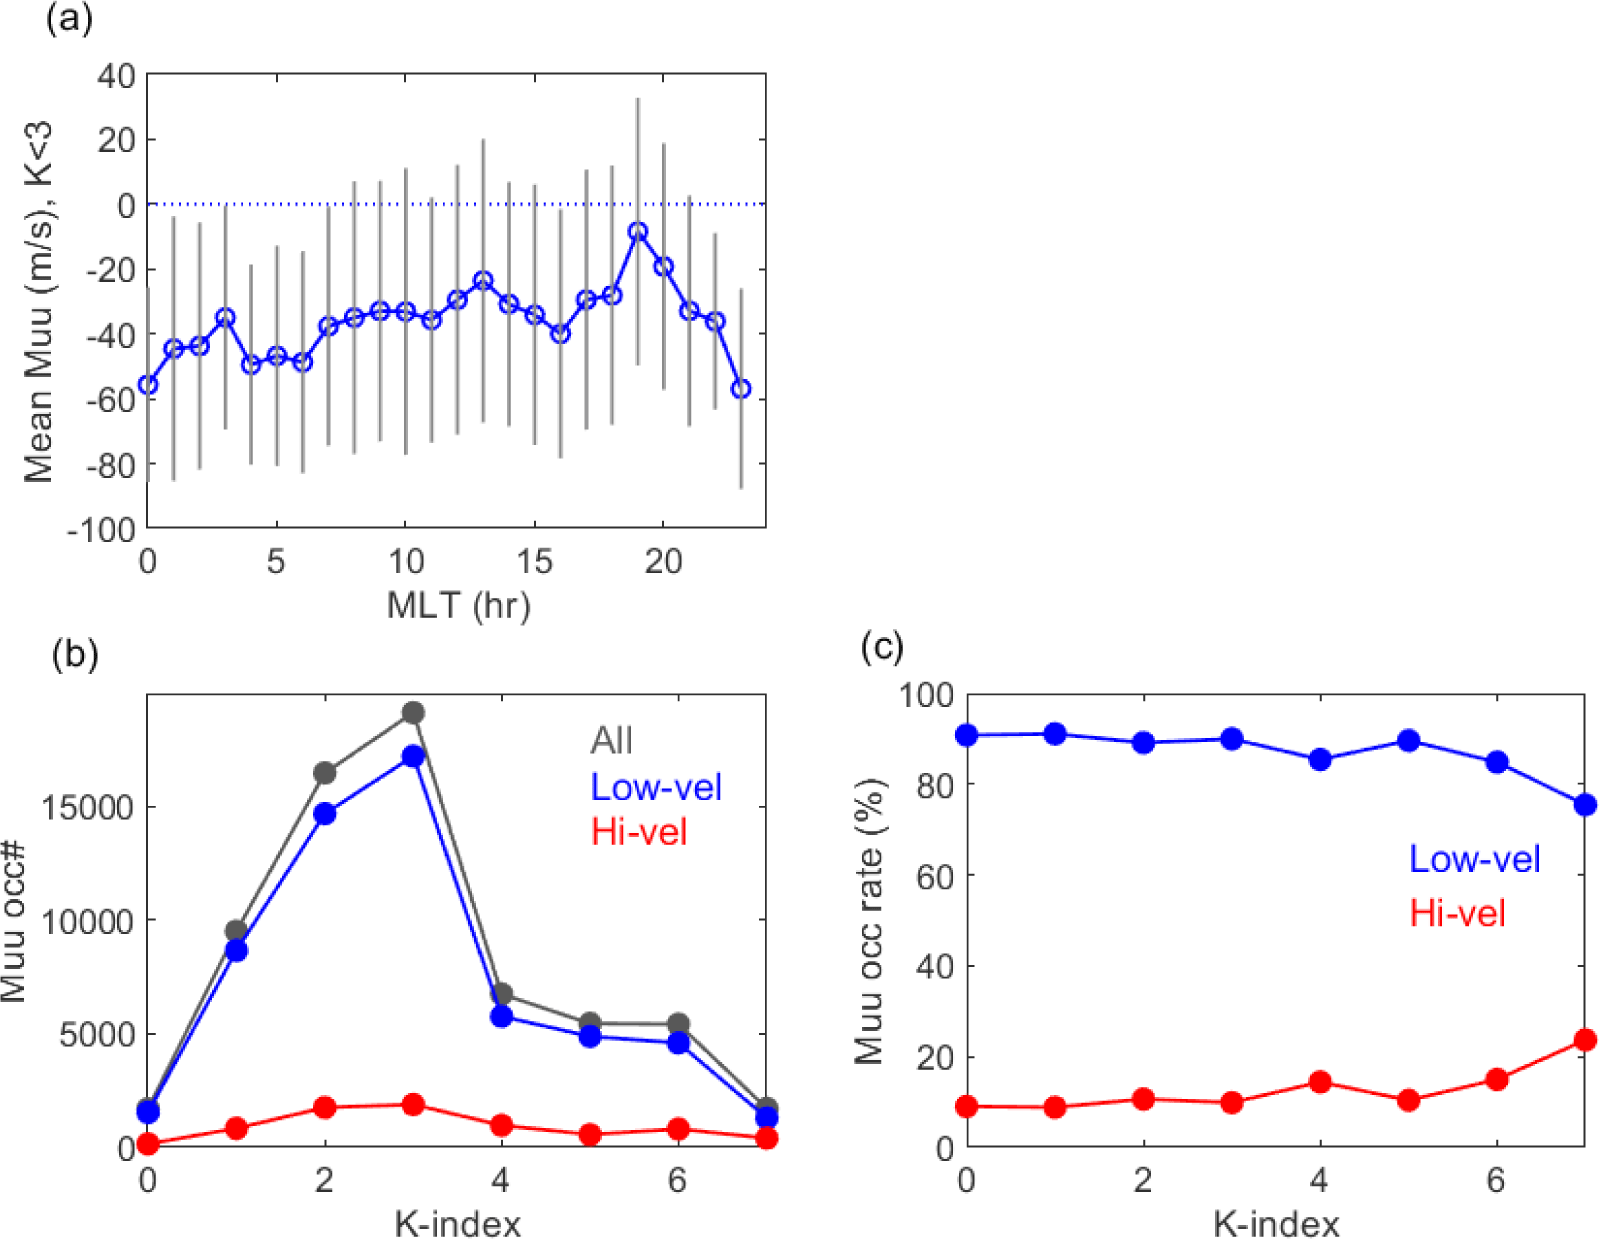
Moreover, the trends of the occurrence rate exhibited differences between low and high velocities in terms of K-index. The occurrence rate for high velocity increased with the K-index, K = 1 to 7, whereas that for low velocity decreased, although with low variation rates.
Considering the zonal velocity (muu) for K ≥ 3 portrayed in Fig. 3(a), low velocity occurrence exhibited peaks at 4–5, 8, 11–12, and 14–15 MLT. The high-velocity peak occurred initially at 3–4 MLT and thereafter at 8–9 MLT. As observed in Fig. 3(b), the occurrence rate of high velocity (red) displayed four peaks, primarily at 4 MLT and 9 MLT with approximately 22% and at 17 MLT and 1 MLT with approximately 20%. The trend of high velocity occurrence rate gradually decreased with MLT, and that of the low velocity gradually increased with MLT, indicating that high velocities were more prevalent during dawn–morning sectors.
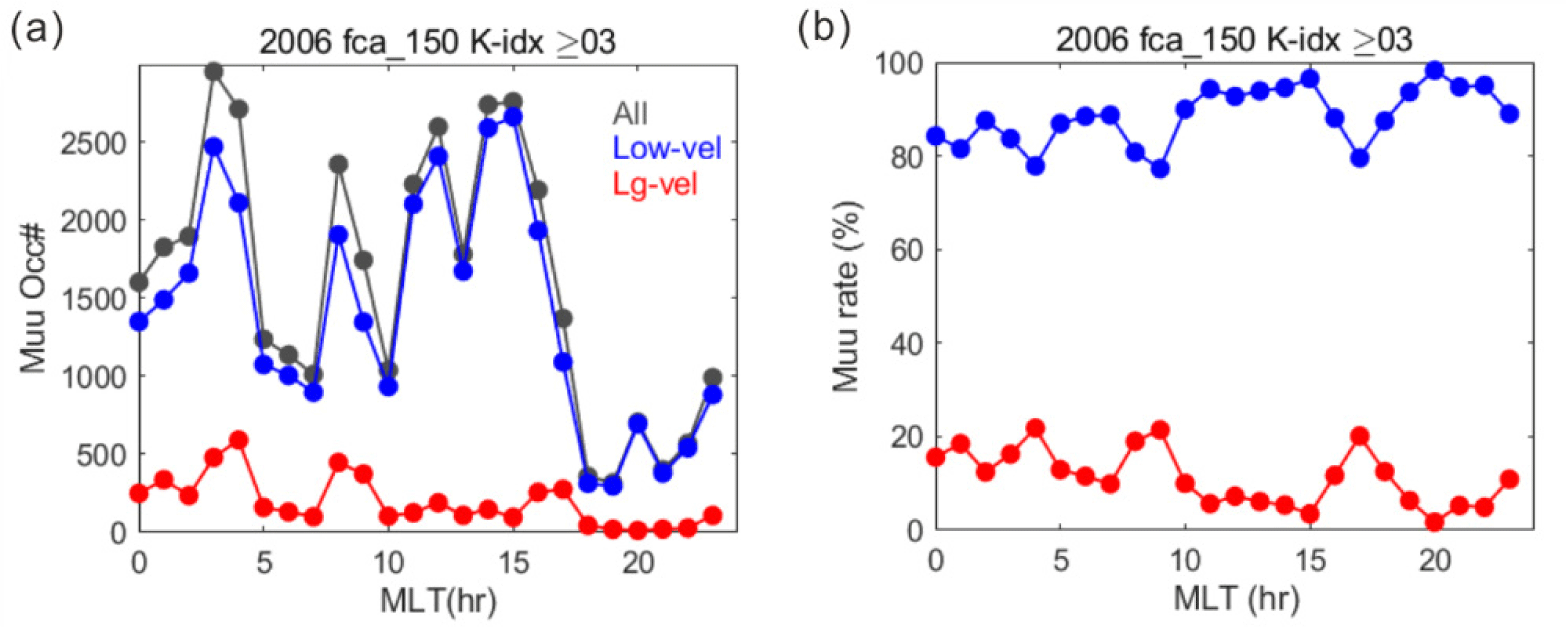
Consequently, the maximum occurrence of high velocity appeared at 3–4 MLT. In particular, the occurrence rate of high velocity accounted for less than 22% in the MLT variation.
4. ZONAL VELOCITY AND ECHO INTENSITY PROFILES
The pulsating aurora patches exhibited a feature of westward drift in the pre-midnight hours and eastward drift in the post-midnight hours, with speeds ranging from 50 to 300 m/s (Akasofu et al. 1966; Scourfield et al. 1983; Yang et al. 2017; Humberset et al. 2018). The zonal velocity pattern of PMSE was further investigated during periods of high K-index to detect intense local geomagnetic activity.
PMSE outbreaks are known to occur within the altitude range of 80–90 km (Lee et al. 2013). However, PMSE does not typically occupy the majority of altitudes within that range. Instead, it generally occupies a thin layer of approximately 1–3 km. In the summer of 2006, PMSE occurrence indicated a strong correlation with the AE index and solar wind speed in day-to-day variations (with periodicities of 7, 9, and 13.5 days), as medium-energy electron precipitation (> 30 keV) creates favorable conditions for PMSE formation (Lee et al. 2013). In the sector from midnight to early dawn, under substorm activity and near noon, the PMSE profile can be well represented across a wide range of altitudes.
As the ESRAD PMSE provides height profiles with high temporal resolution, the zonal velocity and echo intensity (SNR) profiles can be examined at 2 min intervals. This enabled the characterization of PMSE zonal velocity and SNR variations over time and height, especially in the early magnetic dawn sector (00–04 MLT).
The profiles of daytime zonal velocity and SNR are presented in Fig. 4(a) and 4(b), respectively. Despite K-index = 3, the PMSE profile at 13 MLT apparently exhibited the characteristics of PMSE scatterers during periods of geomagnetically quiet conditions. The profile is plotted in a single panel, displaying five 2 min profiles spanning a duration of 10 min, each represented by a different color.
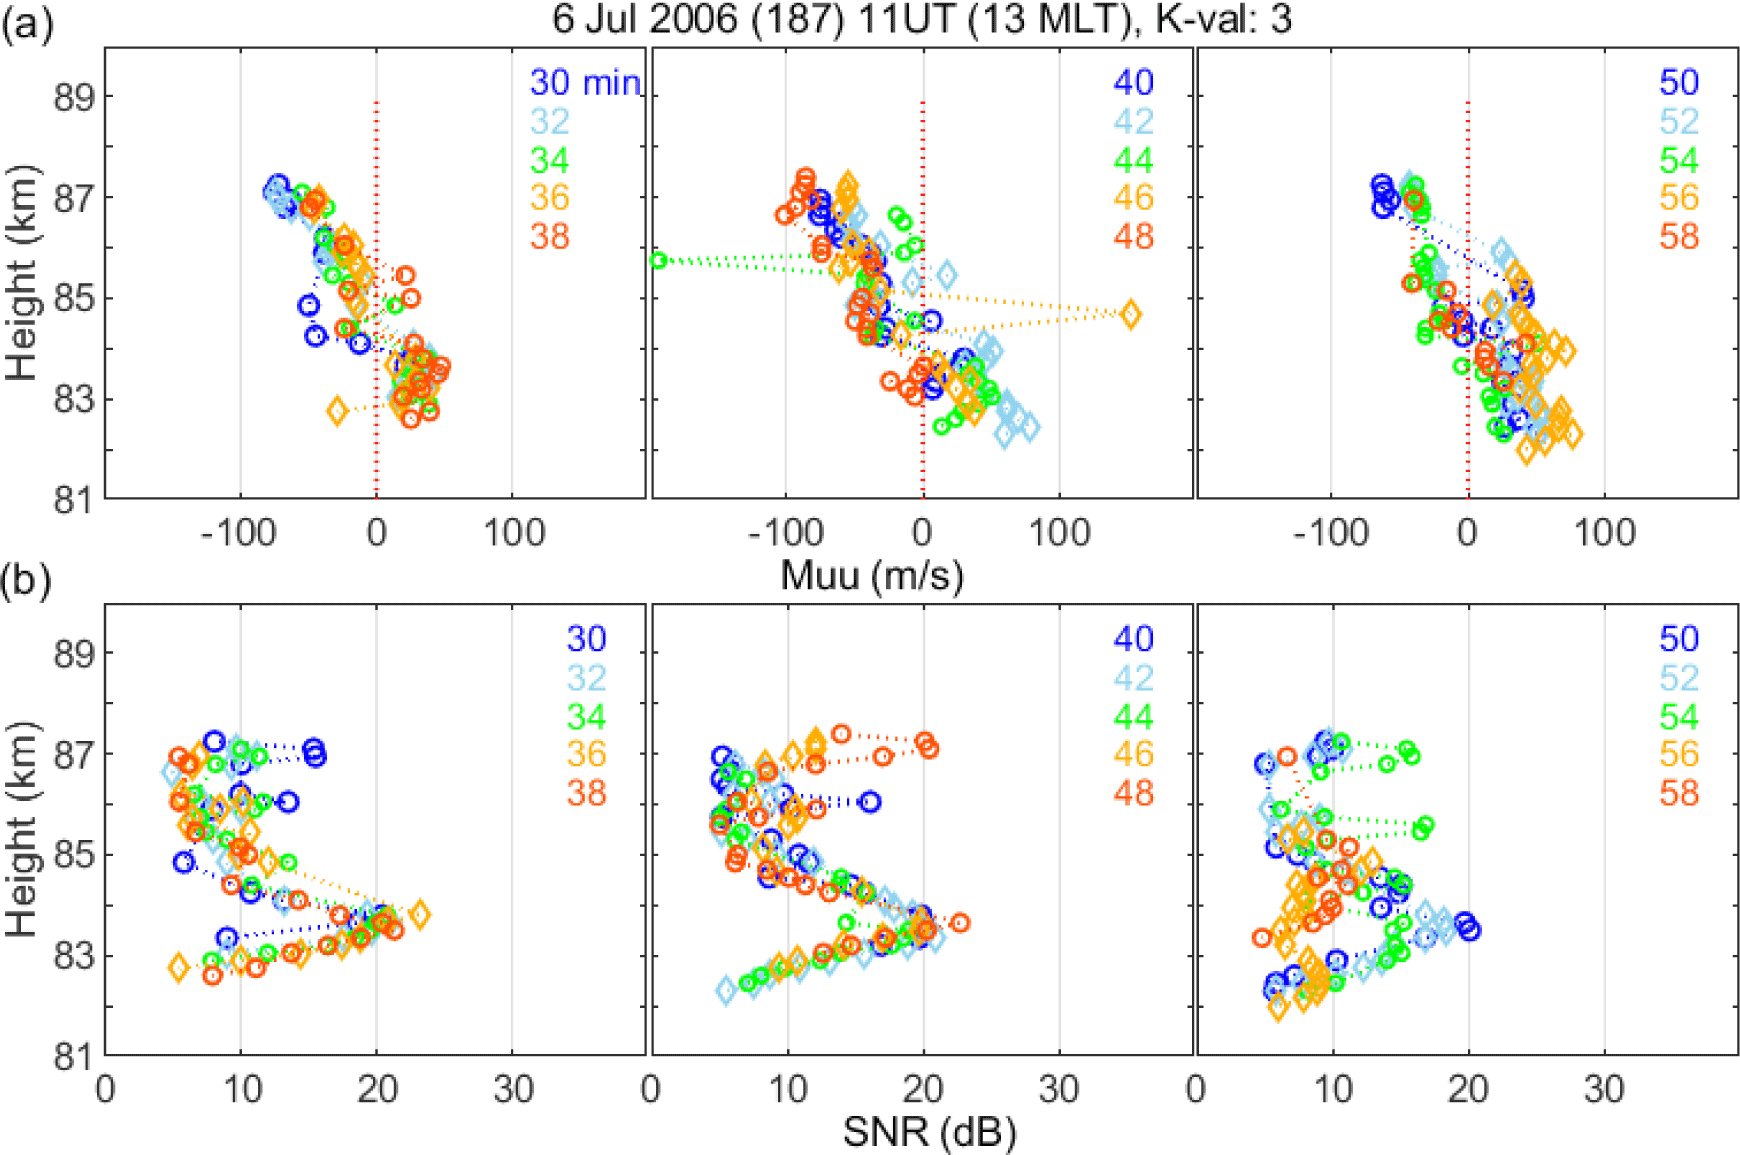
The daytime zonal velocity, as depicted in Fig. 4(a), varied within ± 100 m/s, and the velocity difference between the profiles over a 10 min period was typically less than 100 m/s. The corresponding SNR profile, illustrated in Fig. 4(b), exhibited two peaks—at 84 km and 87 km. This observation indicated the occurrence of peak SNR in the low altitude region (81–84 km) and the upper altitude region (85–89 km) in certain cases.
In contrast, the zonal velocity profile characterized by high speeds predominantly occurred in the early magnetic dawn sector because of strong geomagnetic activity. This type of PMSE profile is expected to provide information on the response of the PMSE layer to the energy input of intense geomagnetic disturbances, including substorms.
The zonal velocities are illustrated in Fig. 5(a)–5(c), and the corresponding SNR profiles are plotted in Fig. 5(d)–5(f), from which three events were considered. In Fig. 5(a) and 5(d) (middle), the zonal velocity and SNR were recorded for June 7, 2006 (doy = 158), 22 UT (00 MLT). In Fig. 5(a), at minutes 40, 42, and 44 of 22 UT, the westward speed increased from −160 to ~−240 m/s, before sharply turning eastward, and finally reaching a maximum of ~90 m/s (84 km, 48 min, red) by stepping −50 m/s at 84 km (46 min, orange). The red (48 min) profile featured an eastward peak (~90 m/s) anchored at −150 m/s at ~83 km, threading through −60 m/s (83.5 km) and then +20 m/s (83.7 km). In this case, the profile rapidly developed from the previous profile, undergoing a high velocity shift from −240 m/s (42, 44 min) to 90 m/s (48 min) with a west-to-east turning. The speed varied up to ~330 m/s, accompanied by a directional shift. The corresponding SNR profile exhibited an increasing trend with decreasing height, peaking at 20–30 dB in the 82–85 km range, as illustrated in Fig. 5(d) (middle). Notably, for this event, large speed variations did not significantly impact the echo intensity.
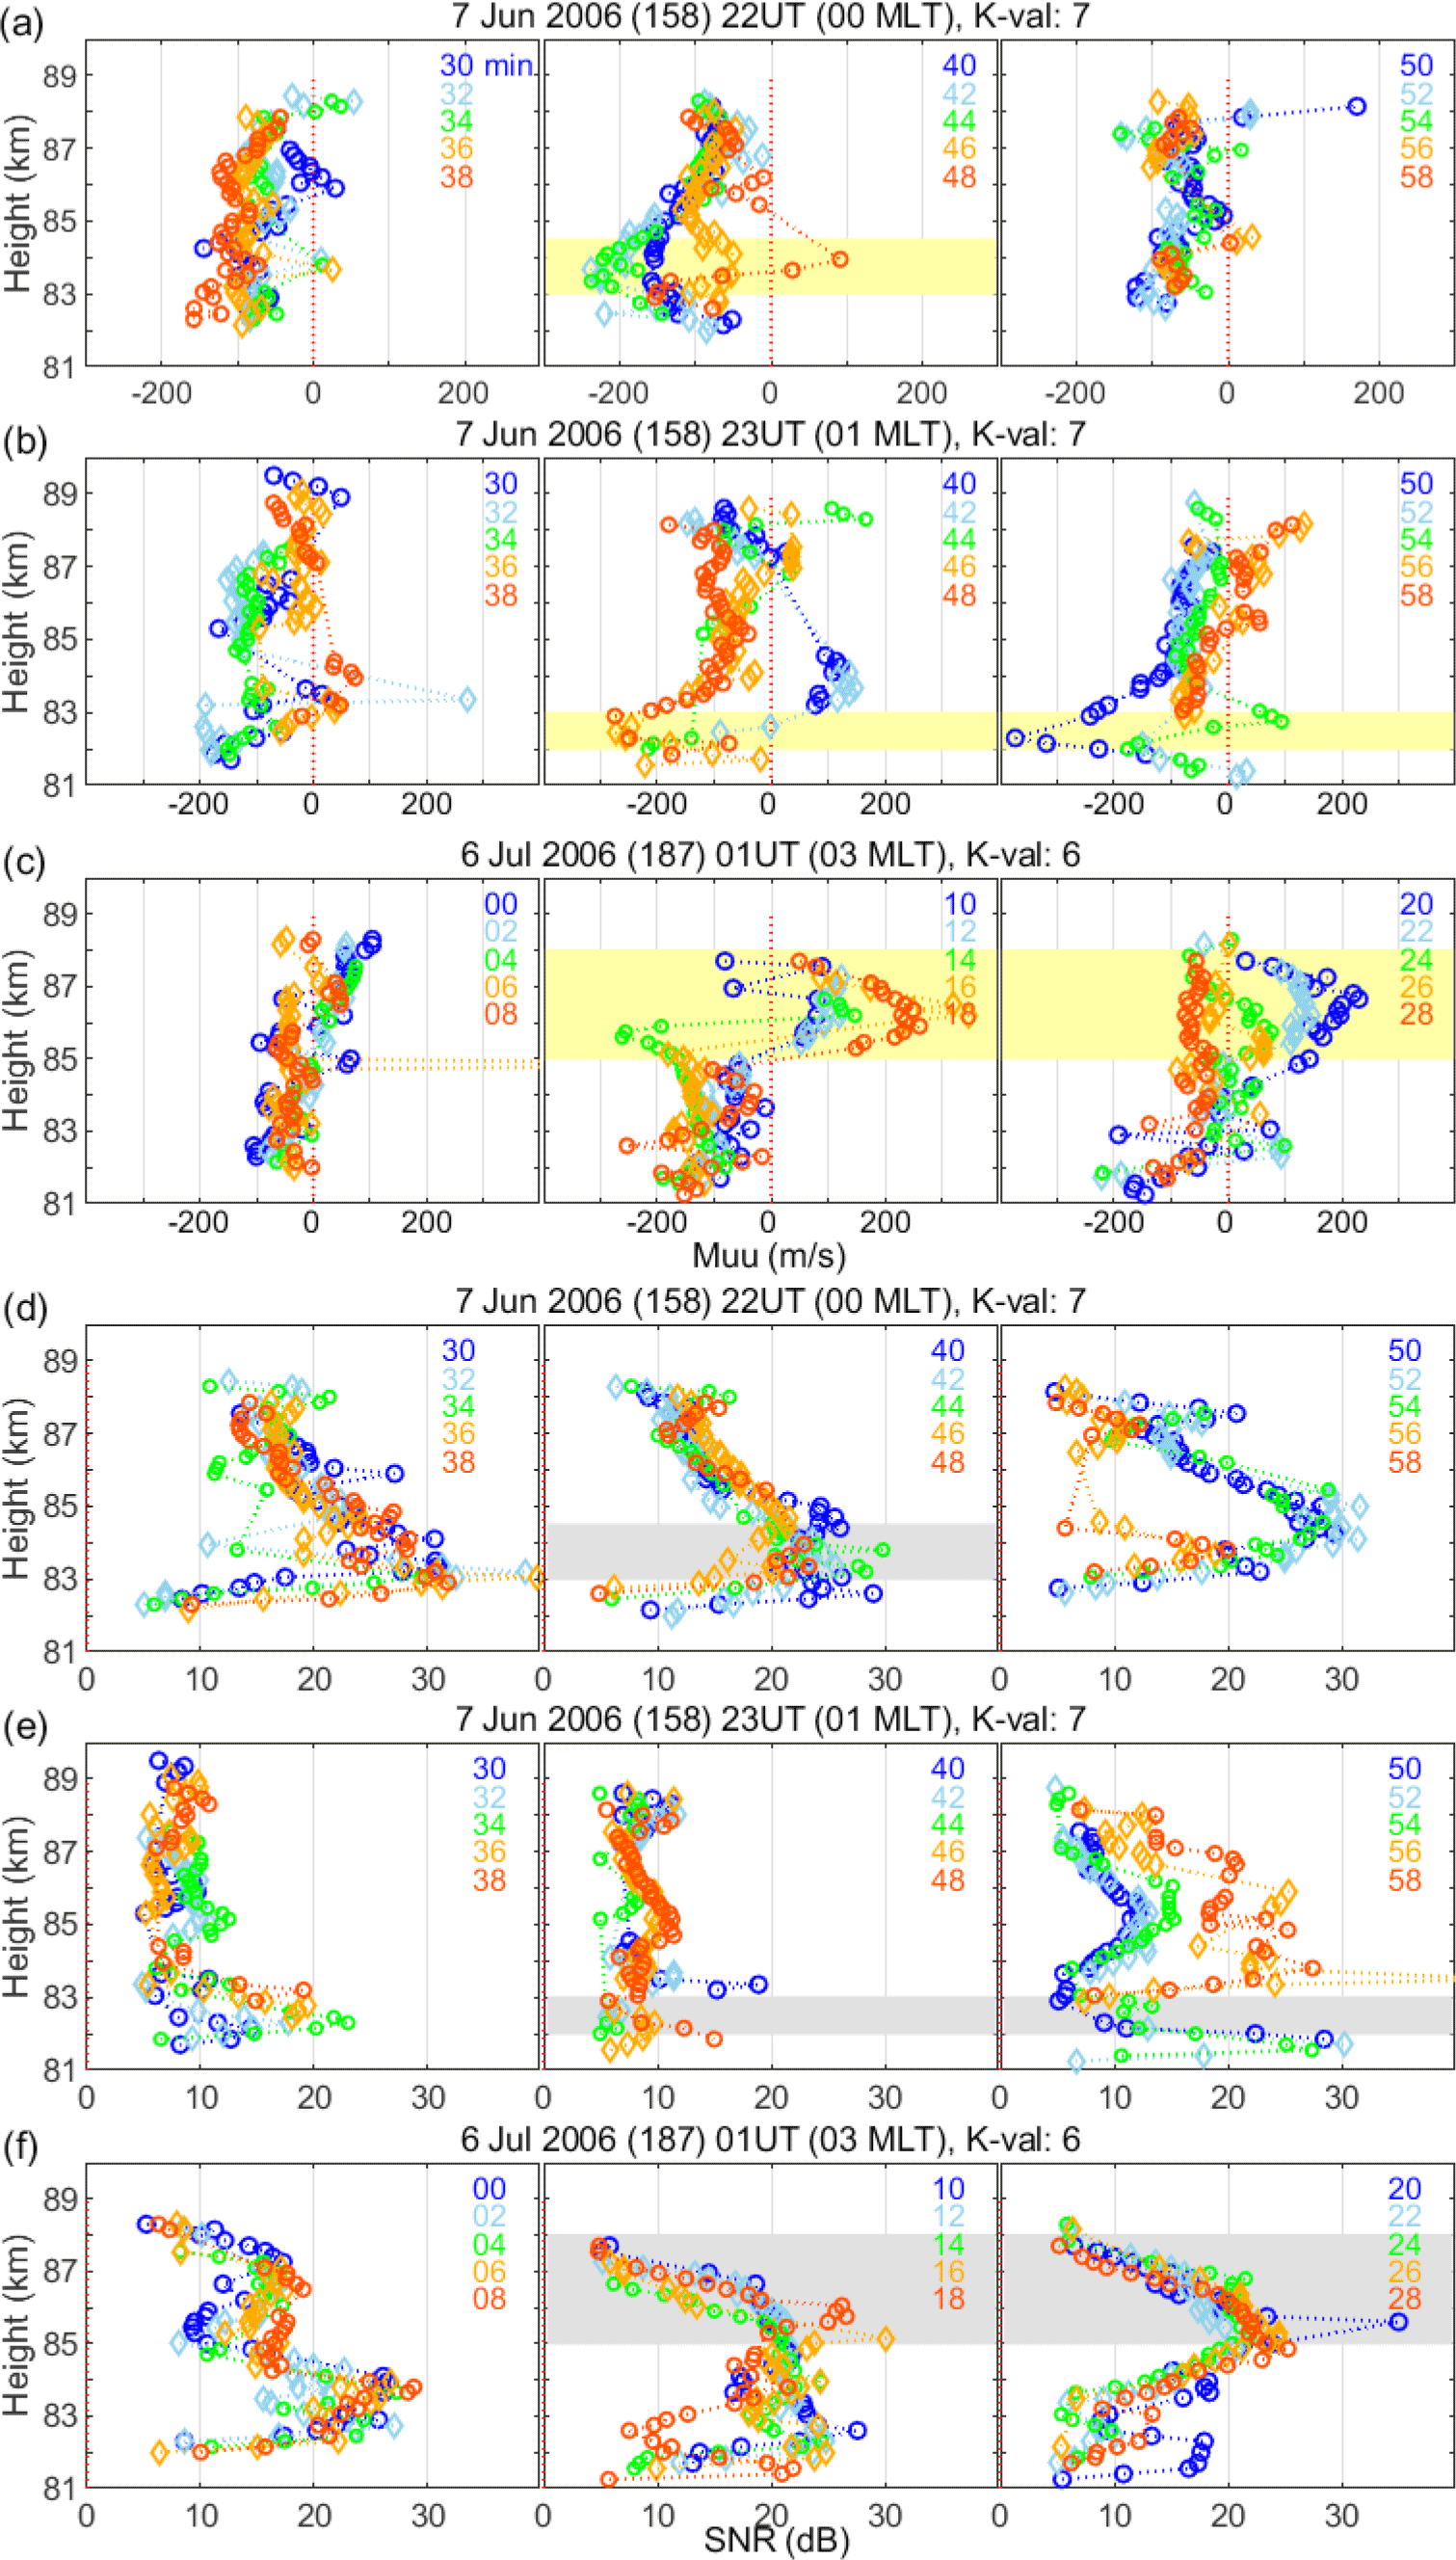
In Fig. 5(b), for June 7, 2006 (doy = 158), 23 UT (01 MLT) (middle and right panels), peak velocities increased from −250 m/s, −270 m/s, and −370 m/s to the west at ~82–83 km at 46 (orange), 48 (red), and 50 (blue) min, respectively. Each profile exhibited a balanced distribution of peaks connected with decreasing magnitudes at upper and lower heights within the 81–84 km range. The extreme zonal velocity underwent a rapid turn of 470 m/s in 4 min, transitioning from an extreme westward speed of −370 m/s (50 min) to an eastward speed of ~+100 m/s (82.5 km, 54 min). Thereafter, it returned to a westward speed of −85 m/s (~83 km, 56, 58 min). These extreme velocity events corresponded to weaker echo intensity of 6–10 dB for the westward direction and 13 dB for the eastward direction compared to the first event (Fig. 4(a)), as depicted in Fig. 4(b) (middle, right panel). From Fig. 5(a) and 5(b), the rapid variations in velocity, both in magnitude and direction, cannot be attributed solely to neutral wind factors.
In Fig. 5(c), for July 6, 2006, 01 UT (03 MLT) at K = 6, zonal velocity profiles were observed at heights of 85–88 km, exhibiting an eastward bias from 10–24 min, as depicted in the middle and right panels. The velocity clusters in the profile moved together at higher eastward velocities and later decayed to lower velocities. The peak velocity commenced in the middle panel at ~+100 m/s (blue-green, 10–14 min), increased to ~+340 m/s (orange, 16 min), and then decreased to 220–260 m/s (red, 18 min). In the right panel, it maintained a similar level of 200–220 m/s (blue, 20 min), decreased to +160 m/s (skyblue, 22 min), and further decayed to +60–70 m/s (green, 24 min) as the peak descended.
In summary, the eastward bias velocities, including the high velocities (≥ 200 m/s), persisted for approximately 18 min at 85–88 km. Thus, the velocity cluster in a profile increased combinedly over a span of 8 min before decreasing over 8–10 min. The corresponding SNR ranged from mid-to-high intensity, varying from 11–20 dB (middle panel) to 15–22 dB (right panel).
Therefore, the occurrence of high velocities was consistent with the credible profile configuration. This can be justified on three points: first, the velocity profile structure typically featured linearly varying velocities around the peak altitude; second, when an extreme velocity abruptly switched direction, the subsequent profile consisted of a new opposite velocity connected to the midpoint and the previous level of extreme velocity; third, when a peak velocity experienced a significant shift over 4–6 min, an intermediate state profile was detected.
Another noteworthy aspect in Fig. 5(c) (middle panel) can be observed in the period of 10–18 min, where shears were formed at the lower boundary of the large eastward velocities owing to a contrasting alteration from west to east. For instance, a significant shear occurred with velocity variations ranging from −270 m/s (85.7 km) to +150 m/s (86.3 km) in the green profile (14 min), from −180 m/s (85 km) to 340 m/s (86 km) in the orange profile (16 min), and from −100 m/s (84.8 km) to 200 m/s (86 km) in the red profile (18 min). The eastward turning from lower to upper altitudes at 85–87 km was accompanied by large shifts up to ~520 m/s, suggesting the application of external forces in the 85–88 km altitudinal region. The shear persisted for more than 6 min.
Lee et al. (2020) investigated using a hodogram to determine whether the shear is connected to winds propagating from lower altitudes. The findings revealed that the shear was independent of the upward propagation of wind and instead abruptly occurred at local altitudes.
The rapid alteration in peak velocity, reaching up to 470 m/s in 4 min (Fig. 5(a) and 5(b)), and the swift velocity shift of 520 m/s (Fig. 5(c)) observed in the velocity profile align with the expected pattern of velocity profiles. However, the driving force behind these rapid velocity variations cannot be attributed to neutral wind. Lee et al. (2020) identified a correlation between high velocity occurrences and peak turbulence (turbulent energy dissipation rate) in the atmosphere, which was likely caused by the energy input from geomagnetic disturbances, as evidenced by the alignment with peaks of the AE index and solar wind speed. Consequently, the persisting eastward high velocities can be attributed to forces associated with the local electromagnetic field or the global convection field induced by energetic electron precipitation during geomagnetic activity.
5. CONCLUSIONS
We conducted a statistical study to examine the variations of PMSE in the D-region ionosphere based on MLT and K-index. Additionally, we analyzed the velocity profile at a high time resolution to assess the credibility of high velocities (≥ 200 m/s) within the D-region layer (80–90 km). The PMSE data utilized in this study were obtained from the MST radar located in Esrange (63.7°N, 21°E), Sweden.
The results are summarized as follows:
-
The K-index exhibited noticeable peaks near midnight, specifically at 23–04 MLT. The occurrence of PMSE peaked at 15 MLT for all available data at each MLT, regardless of the geomagnetic activity level (or K-index < 3). However, under active geomagnetic conditions (K ≥ 3), the maximum PMSE occurrence shifted to 3–4 MLT, surpassing that of 15 MLT.
-
The PMSE SNR for K ≥ 3 displayed peaks at midnight, 00 and 03 MLT, in addition to a daytime peak at 11 MLT. The SNR variation across MLT exhibited an asymmetric structure, with upper curves for K ≥ 3 and lower curves for K < 3. The asymmetric structure was most pronounced at 03 MLT for both SNR and PMSE occurrence.
-
The zonal mean velocity during quiet periods, characterized by K < 3, demonstrated a westward bias in terms of MLT, ranging from −60 to −5 m/s, with uncertainties ranging from ±20–40 m/s. The occurrence of high velocities, defined by values ≤ −100 m/s or ≥ +80 m/s, attained its maximum at 3–4 MLT.
-
In the case studies conducted during the 0–3 MLT period, high velocities exhibited rapid shifts in both magnitude and direction, reaching values as large as 330 m/s or 470 m/s within approximately 4 min. These eastward-biased velocities, including those exceeding 200 m/s, persisted for ~18 min, accompanied by coordinated motion among altitudinal velocities within the 85–88 km range.
-
The occurrence of high zonal velocities is aligned with a credible profile configuration.
-
(i) Notably, high velocities exceeding 200 m/s, up to 400 m/s, occurred within the D-region (80–90 km) ionosphere during substorm periods, adhering to the aforementioned credible profile configuration.
-
(ii) The observed rapid variations in peak velocity, such as the magnitude reaching 470 m/s within 4 min, and the rapid variations in velocity at 520 m/s in the profile, were consistent with an acceptable velocity profile structure. These rapid shifts cannot be solely attributed to neutral wind effects but were rather influenced by geomagnetic disturbances and substorms.
-
In summary, the enhancement of PMSE, particularly during the 0–4 MLT period, was closely associated with local substorms. Furthermore, in the early magnetic dawn sector (0–3 MLT), the occurrence of high zonal velocities in PMSE scatterers aligned with a credible profile configuration, driven by forces associated with the local electromagnetic field or the global convection field induced by electron precipitation during substorm-induced geomagnetic activity.
