1. INTRODUCTION
The polar ionosphere is characterized by the coupling processes with the magnetosphere along the geomagnetic field lines in the polar cap, auroral oval, and cusp regions, which results in unique characteristics of the ionosphere density structures such as strong plasma convection, joule/frictional heating, energetic particle precipitations, enhanced E-region density, optical auroral emissions, etc. These additional physical processes not only produce characteristic plasma density structures in the polar ionosphere, but also greatly affect the global ionosphere-thermosphere system in particular during severe magnetic storm periods. Compared with low and mid-latitude ionosphere, however, the characteristics of the polar ionospheric density structure have not been well understood, most probably due to the relatively limited observations (Heelis 1982).
In order to investigate the complex processes in the upper atmosphere including the ionosphere, mesosphere, and thermosphere in the polar region, Korea Polar Research Institute (KOPRI) has been operating various ground-instruments in the Korean Antarctic stations to observe the ionosphere, thermosphere, and the magnetosphere in the southern polar region (Jee et al. 2014; Kwon et al. 2018; Ham et al. 2020). In the northern polar region, on the other hand, only a few ground observations have been performed with Fabry-Perrot Interferometers (FPI) and GPS scintillation monitors in Kiruna, Sweden and Svalbard, Norway. In an effort to enhance the ionospheric observations in the northern polar region, we joined the European Incoherent Scatter (EISCAT) observations together with Korea Astronomy and Space Institute (KASI) since 2015. The EISCAT is an international scientific association that was initiated in the middle of 1970’s to operate incoherent radars in the northern artic region including Kiruna (Sweden), Sodankylä (Finland), Tromsø and Longyearbyen, Svalbard (Norway). The first EISCAT system, the ultra high frequency (UHF) incoherent scatter radar (ISR), became operational in 1981. Since then, the facilities of the EISCAT Scientific Association have been continuously developed and extended and today comprise world-class radars (Rishbeth & van Eyken 1993). Recently, EISCAT is developing a next-generation incoherent radar system, the EISCAT-3D, to investigate the atmosphere and near-Earth space environment (see the EISCAT Scientific Association for more details: https://eiscat.se) (Wannberg et al. 1997; Lehtinen et al. 2002; McCrea et al. 2015).
KOPRI and KASI have been participated in the EISCAT Scientific Association as an affiliate institution since 2015 in order to expand their ionospheric observations from the southern polar region to the northern polar region. As affiliated institutions, they can perform the observations of the polar ionosphere with their own observation schedule in the special program category in accordance with the time share calculation of the Association. There were three observations jointly performed by using KOPRI and KASI time shares: December 16–21, 2016; January 3–9, 2018; June 25–26, 2018. The first two observations in December 2016 and January 2018 were carried out to observe the characteristics of the ionosphere in the dayside polar cap/cusp region in winter. The third observation in June. 2018 were a joint observation with the balloon-borne instrument High-Altitude Interferometer WIND Experiment (HIWIND) (Wu et al., 2019a). In this article, we briefly report these observations using the EISCAT Svalbard radar (ESR) conducted by KOPRI-KASI time shares.
2. EUROPEAN INCOHERENT SCATTER (EISCAT) RADARS
EISCAT is an international scientific association with member institutes from several counties including Sweden, Norway, Finland, United Kingdom, China and Japan as council members and other affiliate members such as Korea, France, Germany, and United States, as of December 2020. It is a multi-site ISR system that is located in Kiruna, Sweden; Sodankylä, Finland; Tromsø, Norway and in Longyearbyen, Svalbard, originally planned to study the auroral ionosphere in the northern auroral regions (Wannberg 2022). Among three locations of the EISCAT radars, we utilized two radars in Longyearbyen, Svalbard and Tromsø, Norway for our observational studies.
The ESR is located in Longyearbyen (78.09°N, 16.02°E), which mostly belongs to the polar cap/cusp region. The ESR operates in the 500 MHz band with a transmitter peak power of 1,000 kW. The ESR consists of two antennas, a 32 m mechanically fully steerable parabolic dish antenna, and a 42 m fixed parabolic antenna aligned along the direction of the local geomagnetic field line. It is an ISR that is the most powerful ground-based measurement for observing the ionosphere parameters such as electron density, electron and ion temperatures, and ion velocity.
The ESR radar for our observation runs in the “ipy” pulse code mode. The ipy mode is utilized to obtain ionospheric data in the altitude range of about 100 to 500 km. The radar observations for the dayside ionosphere were performed for about 9 hours per day (0700-1600 UT) during the periods of December 16–21, 2016 and January 06–09, 2018.
The EISCAT facility in Ramfjordmoen, near Tromsø, Norway is the heart in EISCAT’s mainland system (69.56°N, 19.18°E), which is largely located in the auroral region. The Tromsø radar consists of one parabolic steerable antenna and the rectangular very high frequency (VHF) antenna. The EISCAT UHF radar operates in the 930 MHz band with transmitter peak power of 2.0 MW, 12.5% duty cycle and 1 µs–10 ms pulse length with frequency and phase modulation capability. The antenna is a 32 meter mechanically fully steerable parabolic dish used for transmission and reception. The EISCAT VHF radar operates in the 224 MHz band with transmitter peak power of 3 MW, 12.5% duty cycle and 1 µs–2 ms pulse length with frequency and phase modulation capability. The antenna, used for transmission and reception, is a parabolic cylinder consisting of 4 quarters, constituting a total aperture of 120 m × 40 m. This antenna is mechanically steerable in the meridional plane (–30° to 60° zenith angle), and electronically steerable in the longitudinal direction (± 12° off-boresight).
The EISCAT UHF radar was operated for two days on June 25–26, 2018 in order to simultaneously observe the ion drifts with the daytime neutral winds observed by HIWIND that is a balloon-borne FPI for daytime thermospheric wind observations.
3. EUROPEAN INCOHERENT SCATTER SVALBARD RADAR (ESR) OBSERVATIONS
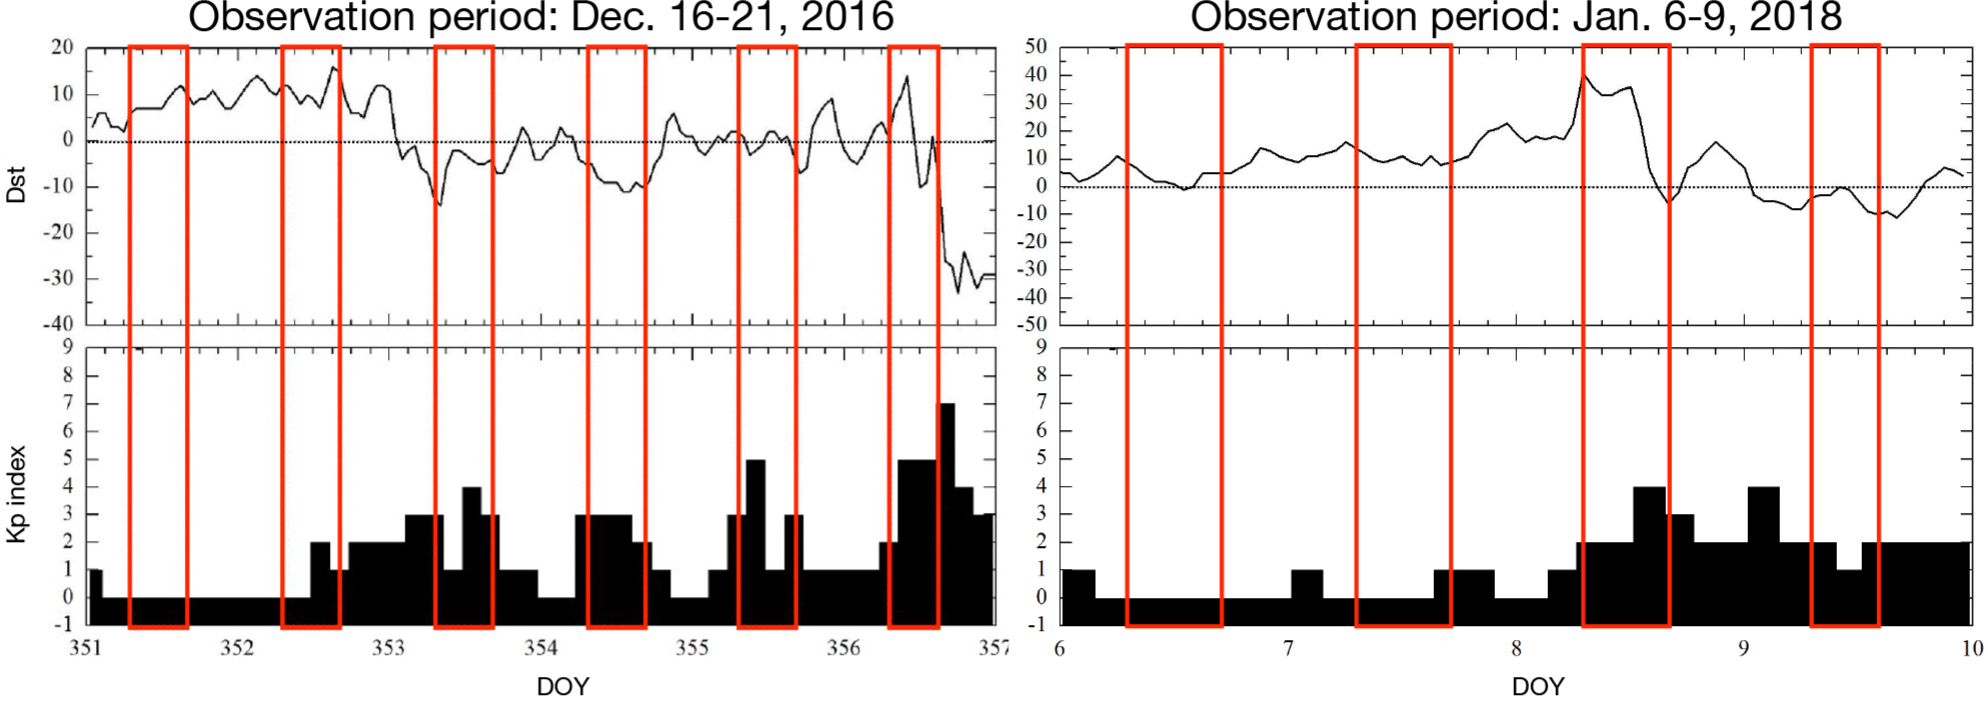
Fig. 1 shows the magnetic activity conditions represented by Kp and Dst indices during the observation periods of December 16–21, 2016 (top) and January 6–9, 2018. Both periods are largely quiet, less than Kp = 5, but once moderately disturbed up to Kp = 7 at the end of the observation in 2016. The solar activity was in the declining phase in 2016 and nearly minimum in 2018. Fig. 2 shows an example of the altitude profiles of electron density (Ne), electron temperature (Te), ion temperature (Ti), and field-aligned ion velocity (Vi) as observed by the ESR during the interval from 07:00 UT (10 MLT) to 16:00 UT (19 MLT) on December 20, 2016. The data show the typical state of the daytime polar ionosphere in winter. The overall level of the density is fairly low with extremely low altitude of peak height (~200 km). The diurnal variation of the density also shows rather complex variations, compared with typical diurnal variations of the middle and low latitude ionospheric densities. Note that there are noticeable variations in the electron density: It shows extremely large temperature enhancement up to 3,000 K at around 08:00 UT (11 MLT) to 10:00 UT (13 MLT) and then drops to about 1,000 K until about 12:00 UT.
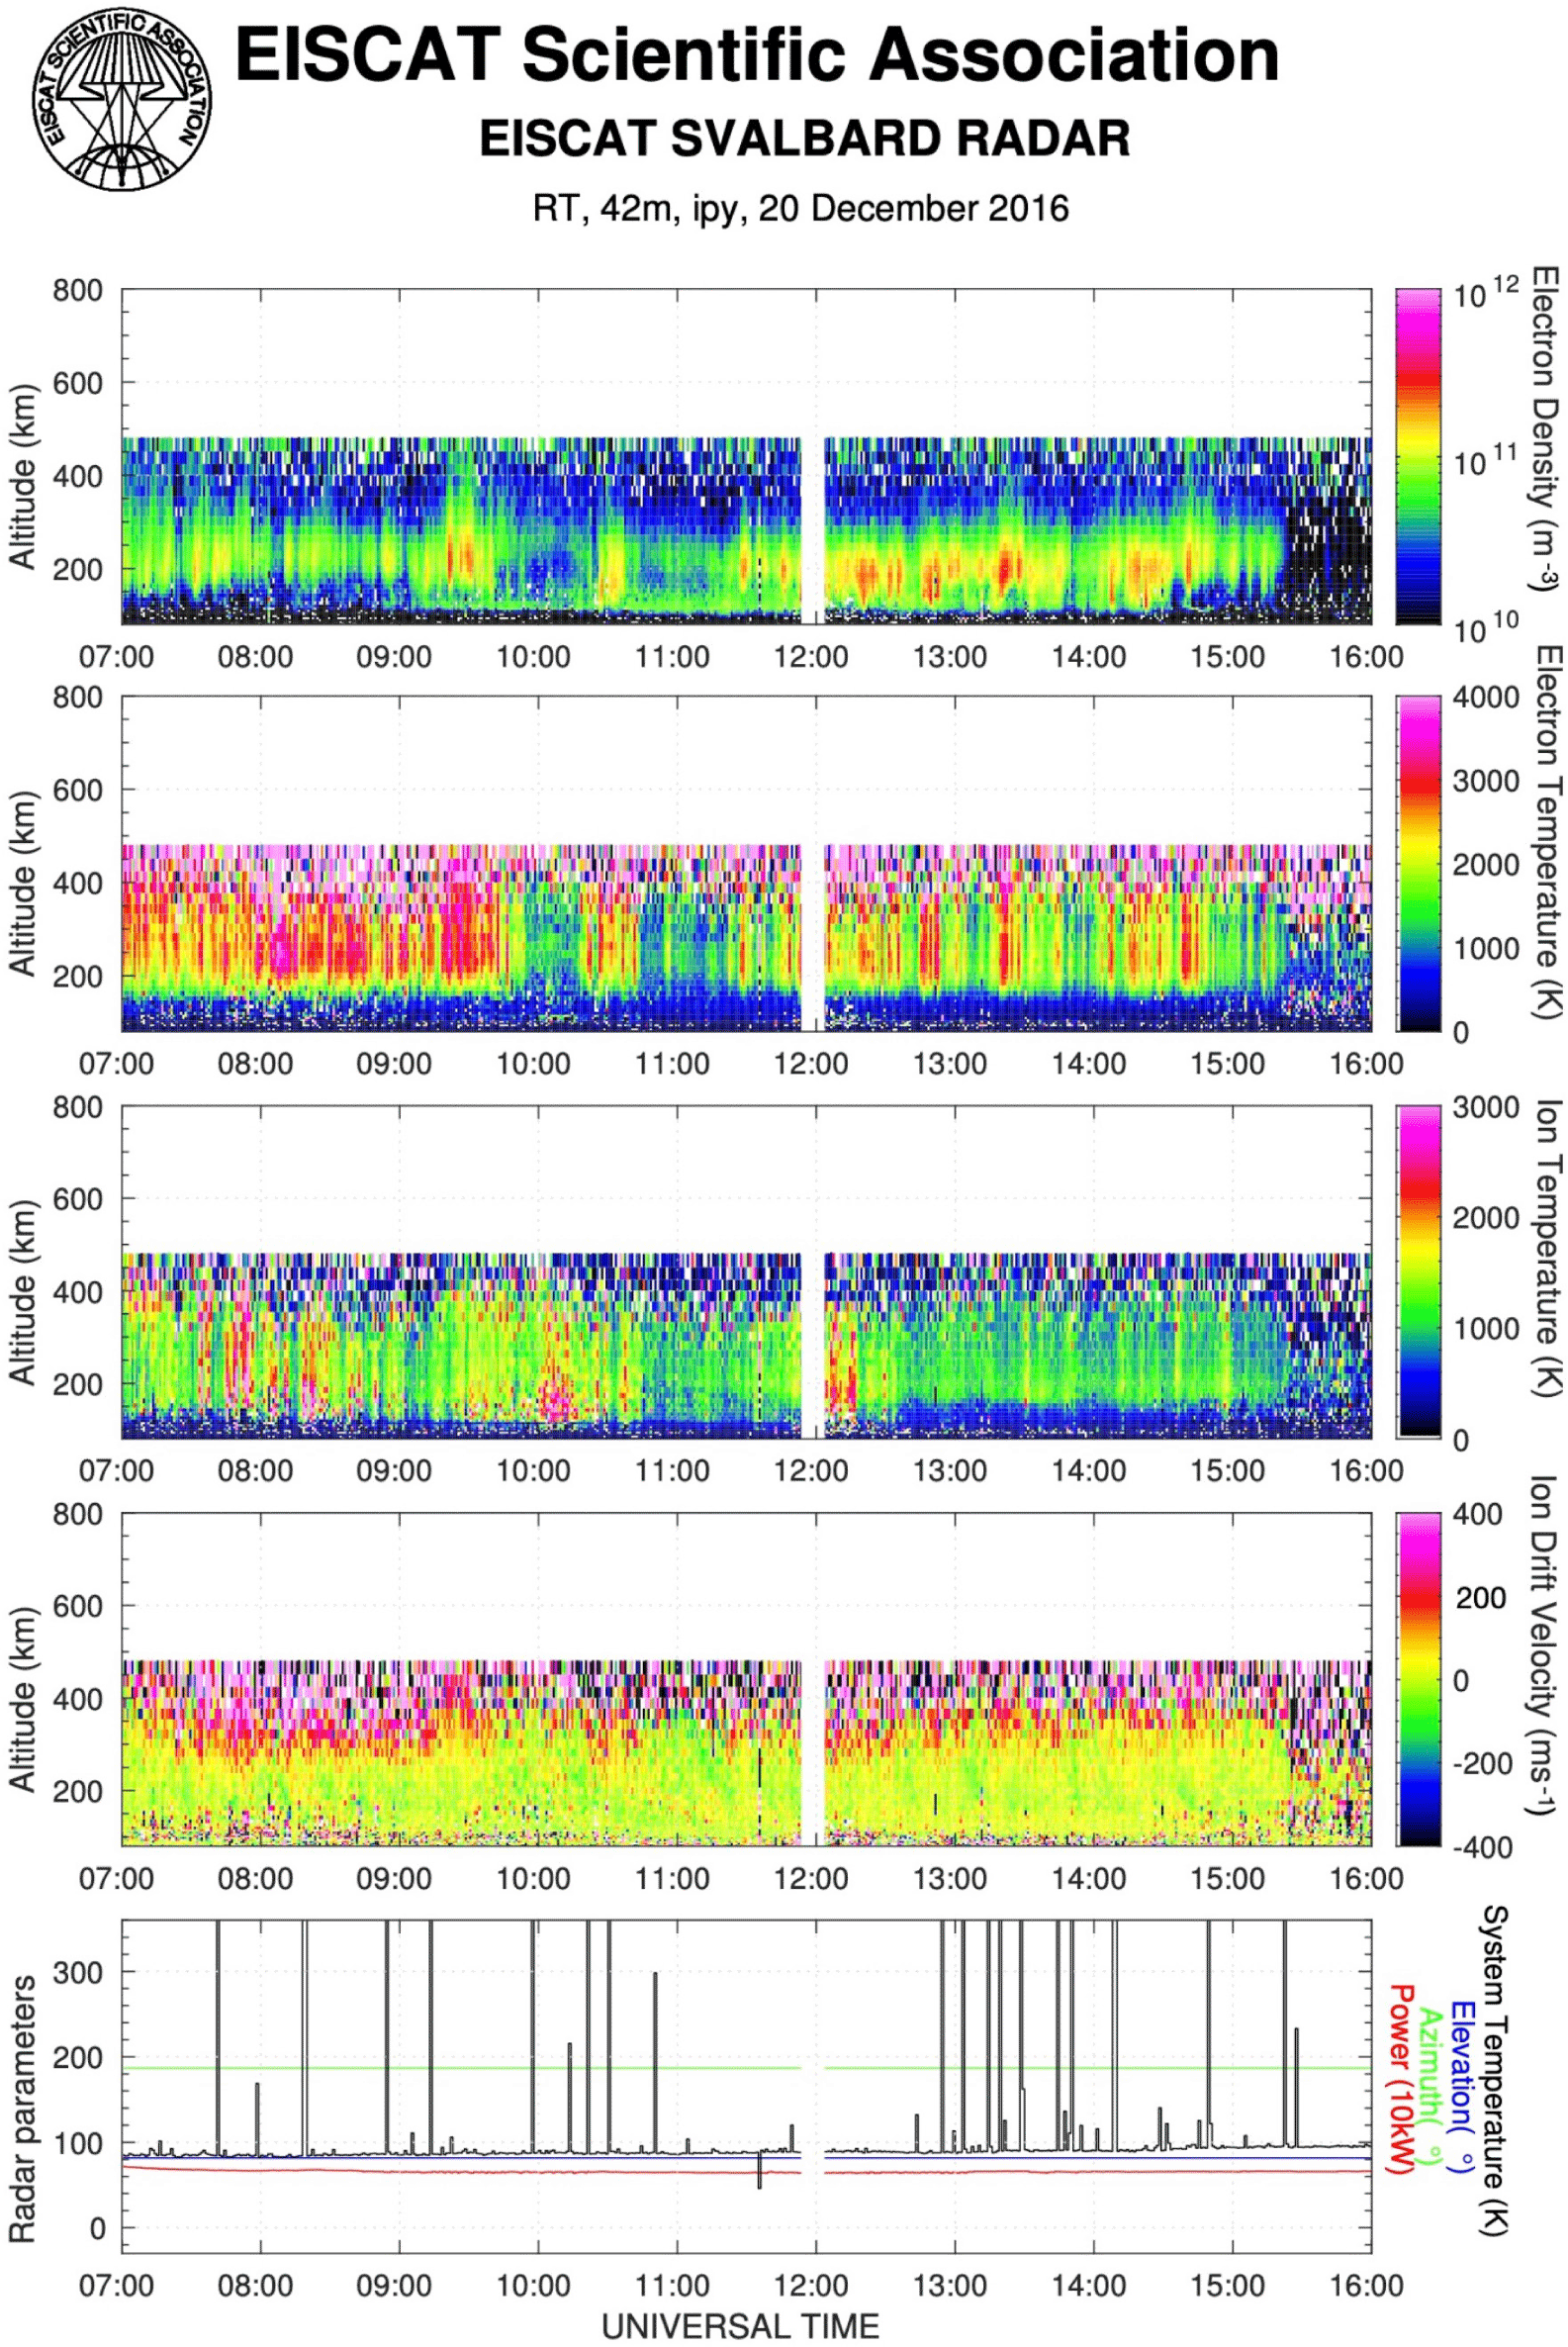
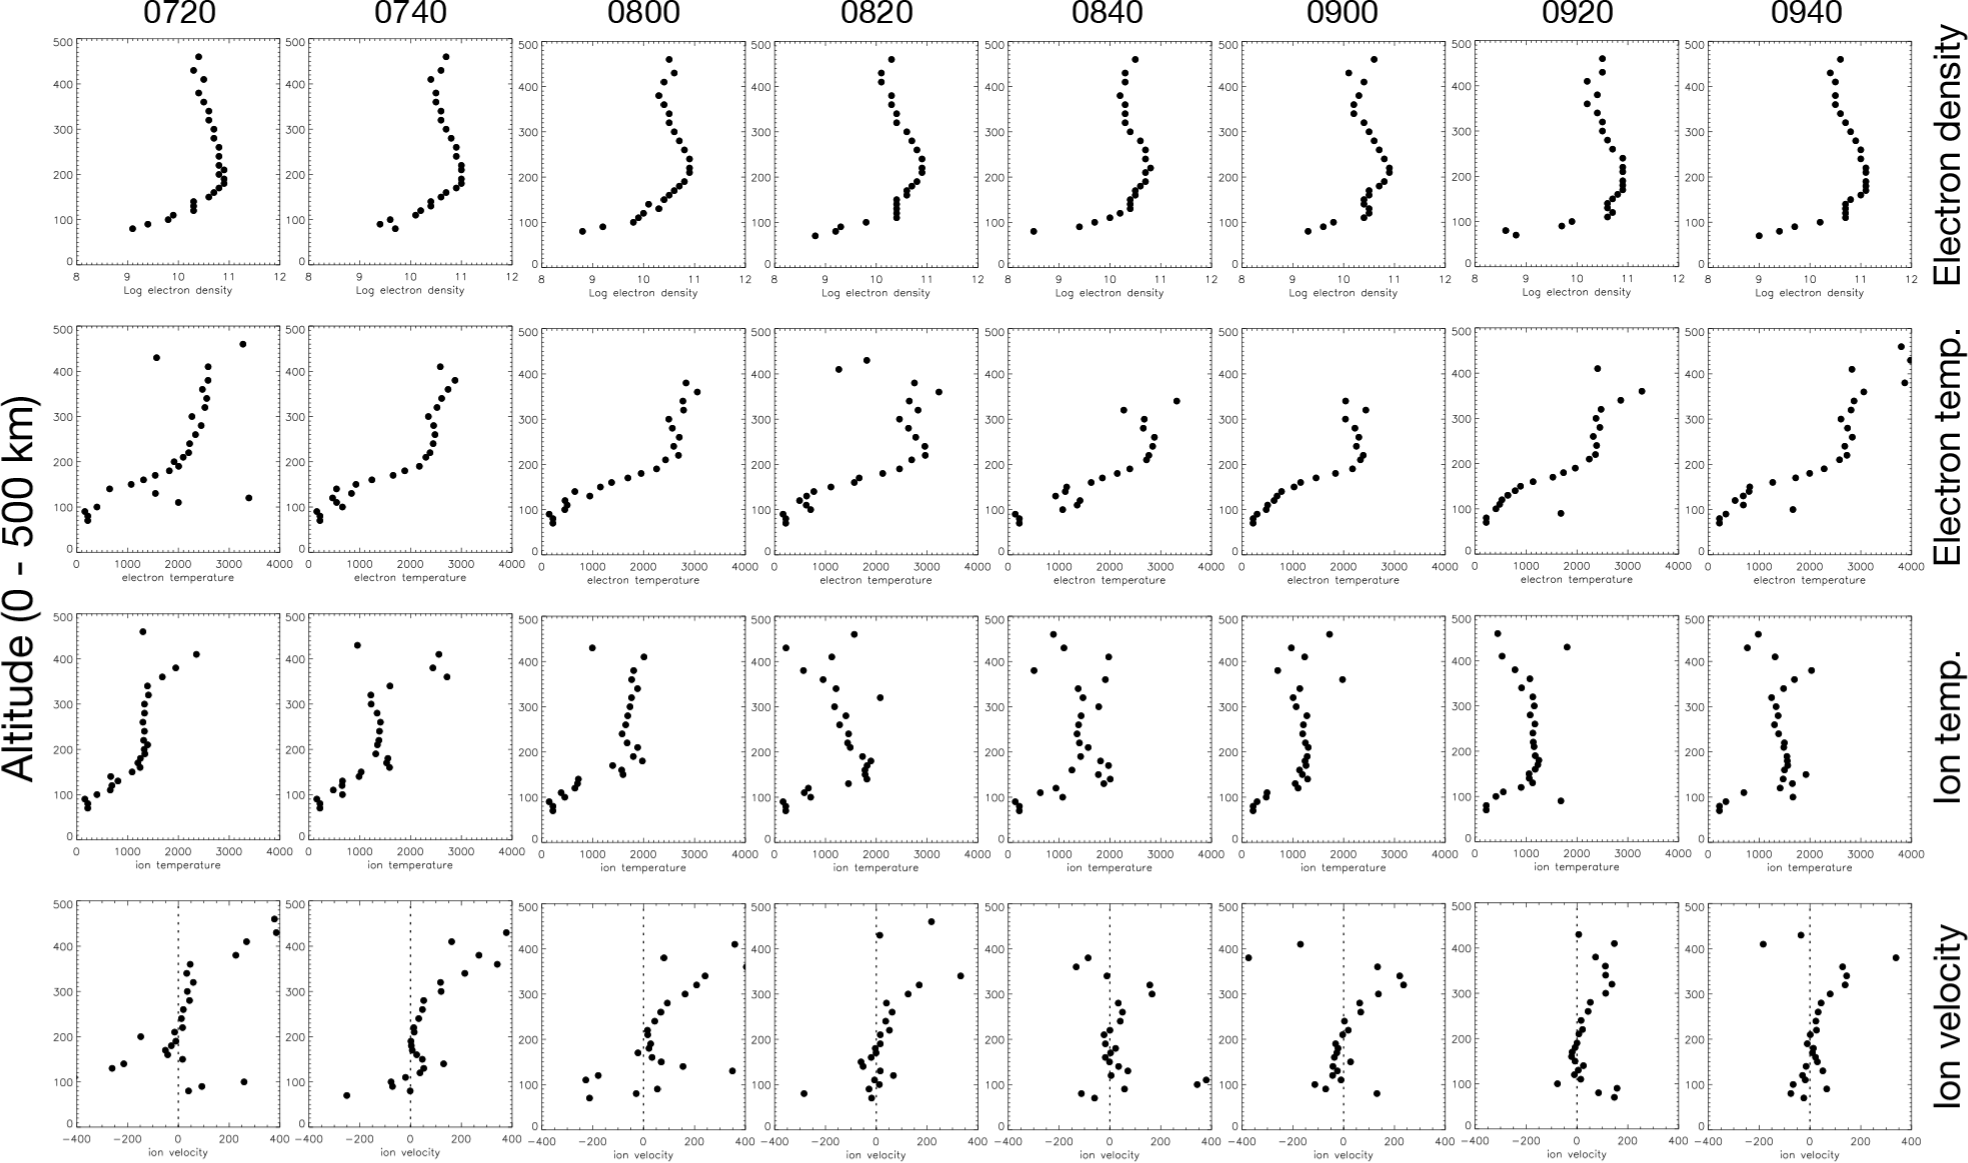
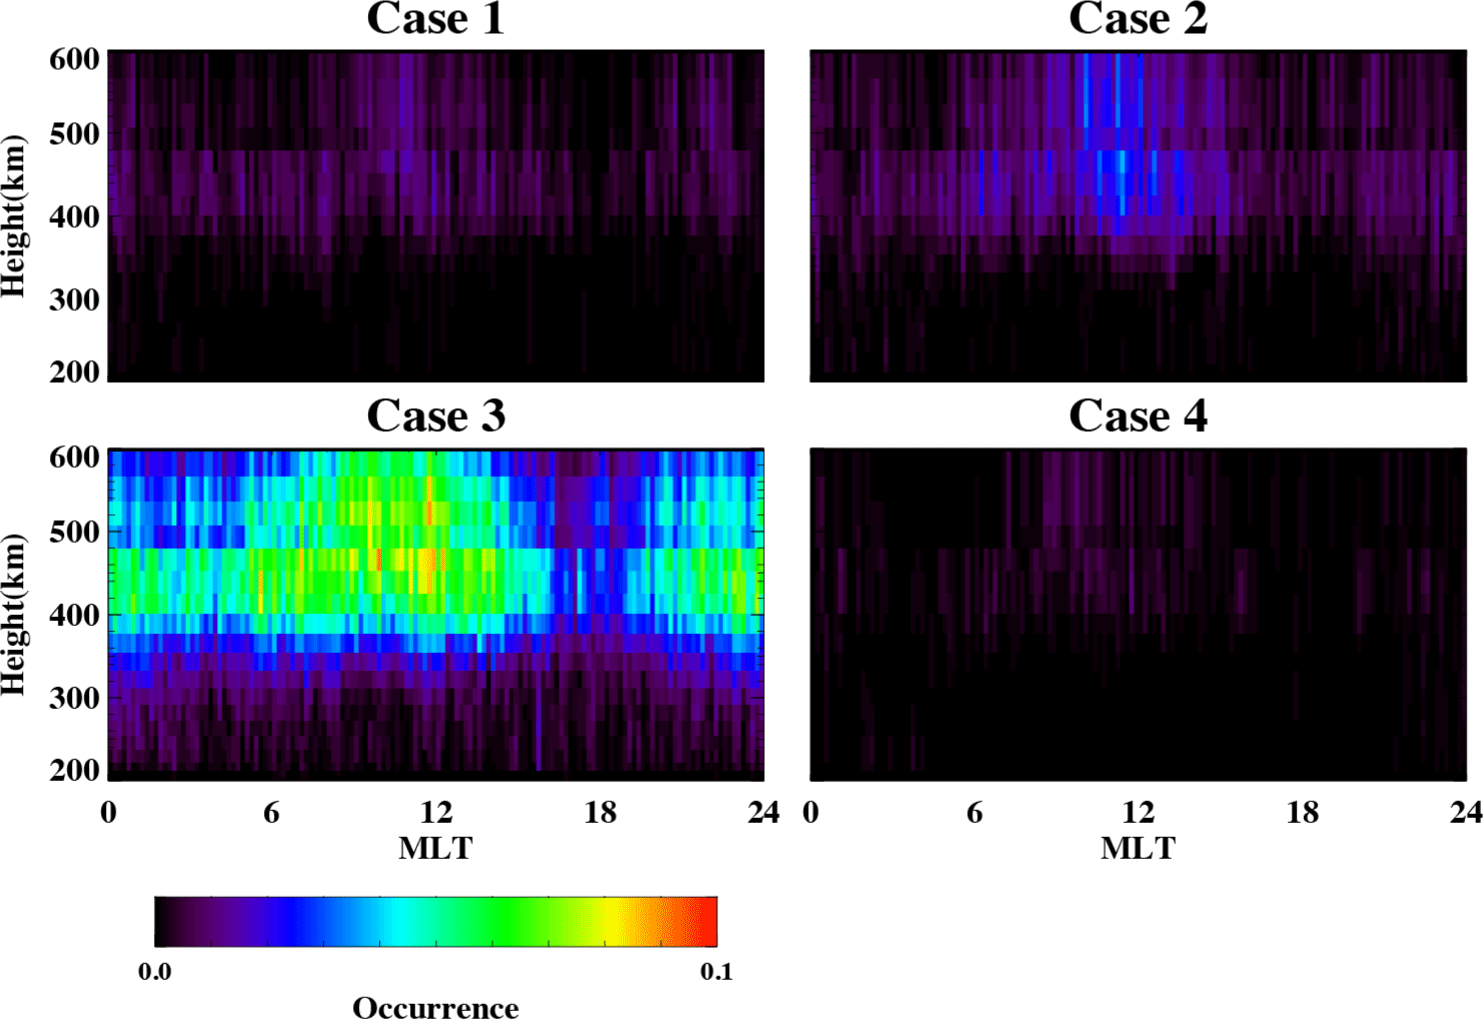
Also noted is that there seems to be corresponding ion drift velocity enhancement at the same UT interval in the topside ionosphere. Fig. 3 shows the altitude profiles of the ionospheric parameters during the period of 07:20–09:40 UT (10:20–12:40 MLT) near the magnetic noon. The ion velocity is steeply increasing with altitude and the ions may eventually escape the ionosphere into the magnetosphere along the magnetic field lines in the polar region, which is being called ‘ion outflow’ (e.g., Wahlund et al. 1992; Endo et al. 2000; Ogawa et al. 2009, 2010). The ion outflow is one of the characteristic phenomena occurring in the polar ionosphere and plays an important role in the magnetosphere-ionosphere coupling processes. In the polar cap and cusp ionosphere, the mechanism of ion upflow/outflow is known to be associated with soft particle precipitation and ion-neutral frictional heating. In particular, soft particle precipitation causes electrons in the F region and topside ionosphere to heat up as well as to ionize neutral particles (e.g., Wahlund et al. 1992; Liu et al. 1995; Ogawa et al. 2003). As the electrons heat up, they move upward under the gravitational force and pull up the ions with them by the ambipolar electric field existing between them. The ion outflow event in Fig. 3 seems to be a typical example of the ion outflow event induced by upward moving electrons since there is only an electron temperature enhancement but no ion temperature enhancement that is related with ion-neutral frictional heating accompanied by strong plasma convection. Using long-term ESR observations for the ionosphere, a statistical study was performed on the characteristics of the occurrence of ion upflow in association with both ion and electron heatings in the polar region as shown in Fig. 4 (Ji et al. 2019). Fig. 4 shows the height versus magnetic local time distributions of the relative occurrence frequency for four cases of ion upflow events observed by ESR during the period of 2000–2015: (1) Case 1 includes the ion upflow events with the increase of ion temperature alone; (2) Case 2 includes the ion upflow events with the increase of electron temperature alone; (3) Case 3 includes the ion upflow events with the increase of both ion and electron temperatures; (4) Case 4 includes the ion upflow events without any increase of ion or electron temperature. From the analysis of the results, they found that the electron heating seems to be more effective to produce upward ion flow than the ion heating, but the largest occurrence of ion upflow events exists when both electron and ion heatings occur simultaneously. Note that the ‘ion upflow’ moves heavy ions to high altitudes where additional processes mostly driven by external solar wind forcings are required to further accelerate the ions to escape the upper atmosphere to the magnetosphere, which becomes the ‘ion outflow’ (Strangeway et al. 2005; Sánchez & StrØmme 2014).
4. HIGH‐ALTITUDE INTERFEROMETER WIND EXPERIMENT (HIWIND) AND EUROPEAN INCOHERENT SCATTER (EISCAT) OBSERVATIONS
HIWIND is a balloon borne FPI. It is constructed by the National Center for Atmospheric Research/High Altitude Observatory (NCAR/HAO) Instrument Group and Earth Observation Laboratory. By flying at a 40 km altitude, the HIWIND can measure the thermospheric winds by monitoring a wind-induced Doppler shift in the airglow emission of O 630 nm during both day and night (Wu et al. 2012). Note that the ground-based FPI observation is usually only available during nighttime due to the high solar scattering background during daytime. There have been daytime thermospheric wind observations from the satellite missions such as limb-scan instruments on DE-2 and upper atmosphere research satellite (UARS) and in-situ measurements from Communication/Navigation Outage Forecasting System (C/NOFS). Although these satellite missions have been crucial to understand the daytime thermospheric winds, there is still a large gap of data coverage, for example, a high local time coverage. In an effort to understand the ion-neutral coupling processes during daytime in the polar region, the second HIWIND was launched in June 2018 in Kiruna, Sweden (67.8°N, 20.4°E) to observe daytime thermospheric wind together with the EISCAT observations of simultaneous ion drifts in Kiruna (Sweden) and Tromsø (Norway) during the balloon flight. The balloon drifted westward with a speed of 10 to 20 m/s. The balloon speed was taken into account in the Doppler shift measurements of the thermospheric wind (Wu et al. 2019a, 2019b).
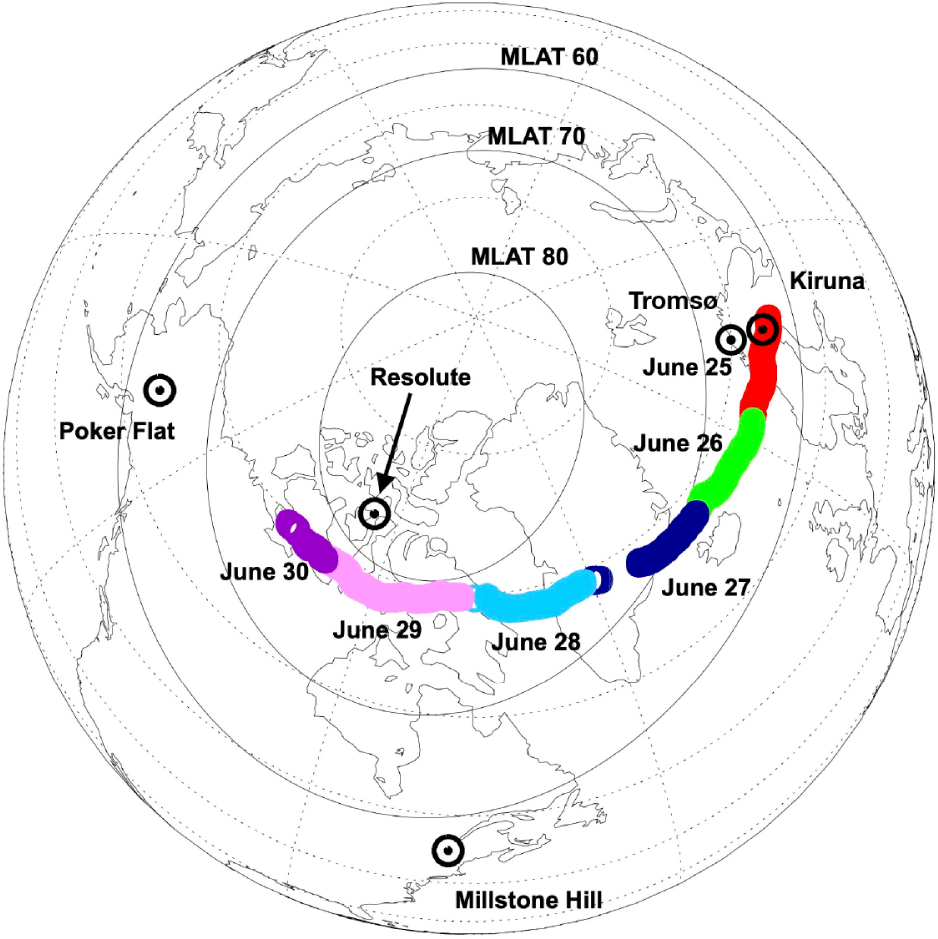
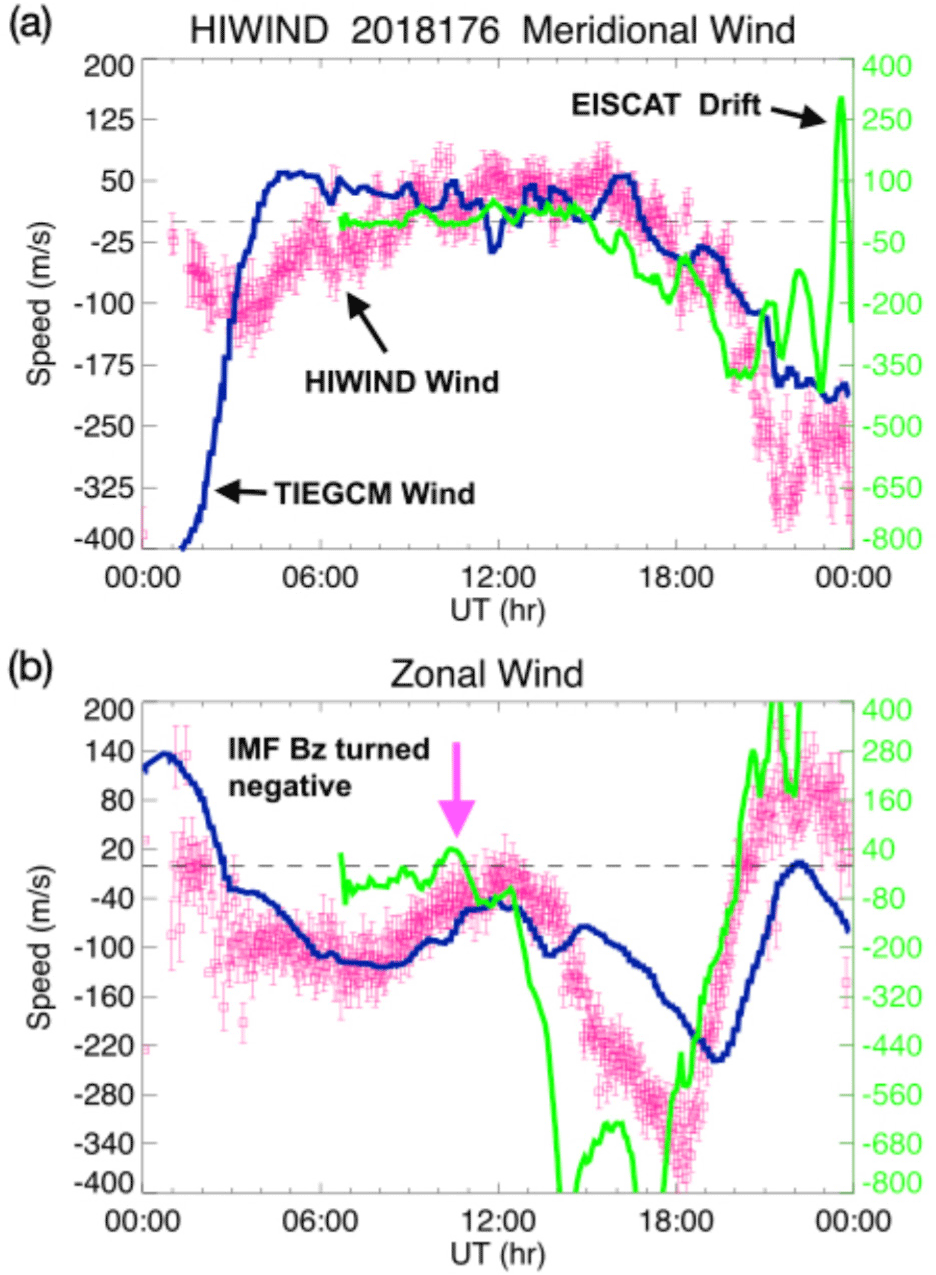
Fig. 5 shows the flight path of HIWIND during the observation period from 25 June to 30 June in 2018. The HIWIND observed the thermospheric winds as it passes through the auroral region. The EISCAT at Tromsø provided the observation of ion drift and other ionosphere parameters such as electron density, electron temperature, and ion temperature. Fig. 6(a) shows the meridional wind from HIWIND and ion drift from EISCAT and Fig. 6(b) shows the zonal wind from HIWIND and ion drift from EISCAT on June 25, 2018. The HIWIND winds are presented with error bars. Also presented are the thermosphere-ionosphere-electrodynamics general circulation model (TIEGCM)-simulated winds. This figure is adopted from Wu et al. (2019a). Note that the zonal component of ion drift almost instantly responded to the change of interplanetary magnetic field (IMF) Bz component to negative at around 11 UT but the corresponding response of neutral wind was slightly lagged behind, which may indicate the time required for ion-neutral coupling processes in the polar region. The TIEGCM simulation seems to show the enhancement of zonal wind but much weaker than the observation.
5. CLIMATOLOGY OF THE POLAR IONOSPHERIC DENSITY
Since it started to operate in 1980s for more than 40 years of active operation, the EISCAT radar system has been continually performed to provide fundamental ionospheric parameters such as ionospheric electron density, ion/electron temperatures, and ion velocity as well as auxiliary parameters such as ion composition, electric field-aligned current density, ion-neutral collision frequency etc. (Rishbeth & van Eyken 1993; Wannberg 2022). There are a number of researches on the climatological study of the polar ionospheric density using the long-term EISCAT observations (Fontaine 2002; Cai et al. 2007; Moen et al. 2008; Xu et al. 2014). Most recently, we also performed a climatological study on the polar ionospheric density profiles using multi-ISR observations for nearly 20 years from 1995 to 2015. The ISRs used for the study are located in three different latitudinal regions, namely, Millstone Hill for the mid-latitude ionosphere, Tromsø for the auroral ionosphere, and Svalbard for the polar cap/cusp ionosphere in order to investigate the climatological characteristics of the polar ionospheric density in comparison with the mid-latitude ionosphere (Kim et al. 2020). In particular, this study also investigated the characteristics of the vertical density structure of the polar ionosphere while most of previous studies focused only on the horizontal structure of the polar ionosphere. For example, Fig. 7 shows the hourly mean electron density profiles at Millstone Hill (MH), Tromsø (EISCAT), and Svalbard (ESR) for three different seasons and for low solar activity and moderately high geomagnetic activity condition in the two different formats. The contour format in the top panels presents the diurnal variations of the density profiles and the line plot in the bottom panels presents specific local time variations of the vertical density profiles, for example, exhibiting small-scale density fluctuations in the mid-latitude nighttime E-region ionosphere and nighttime enhancement of the E-region density in the auroral region. Note that the diurnal variations of the density clearly show the characteristics of the mid-latitude, auroral, and polar cap ionosphere. While the mid-latitude ionosphere shows well-known typical diurnal variations, the diurnal variations of the polar ionosphere exhibit very unusual variations with significant seasonal differences. In particular, the diurnal variations are negligibly small in summer in the polar ionosphere. In winter, the diurnal variation in the auroral region is quite unusual, showing fairly limited daytime bulge in the F-region but broad nighttime enhancement in the E-region. Although only the low solar and high magnetic activity condition was presented here, other solar and magnetic activity conditions also show very unique characteristics in the polar ionosphere, compared with the mid-latitude ionosphere.
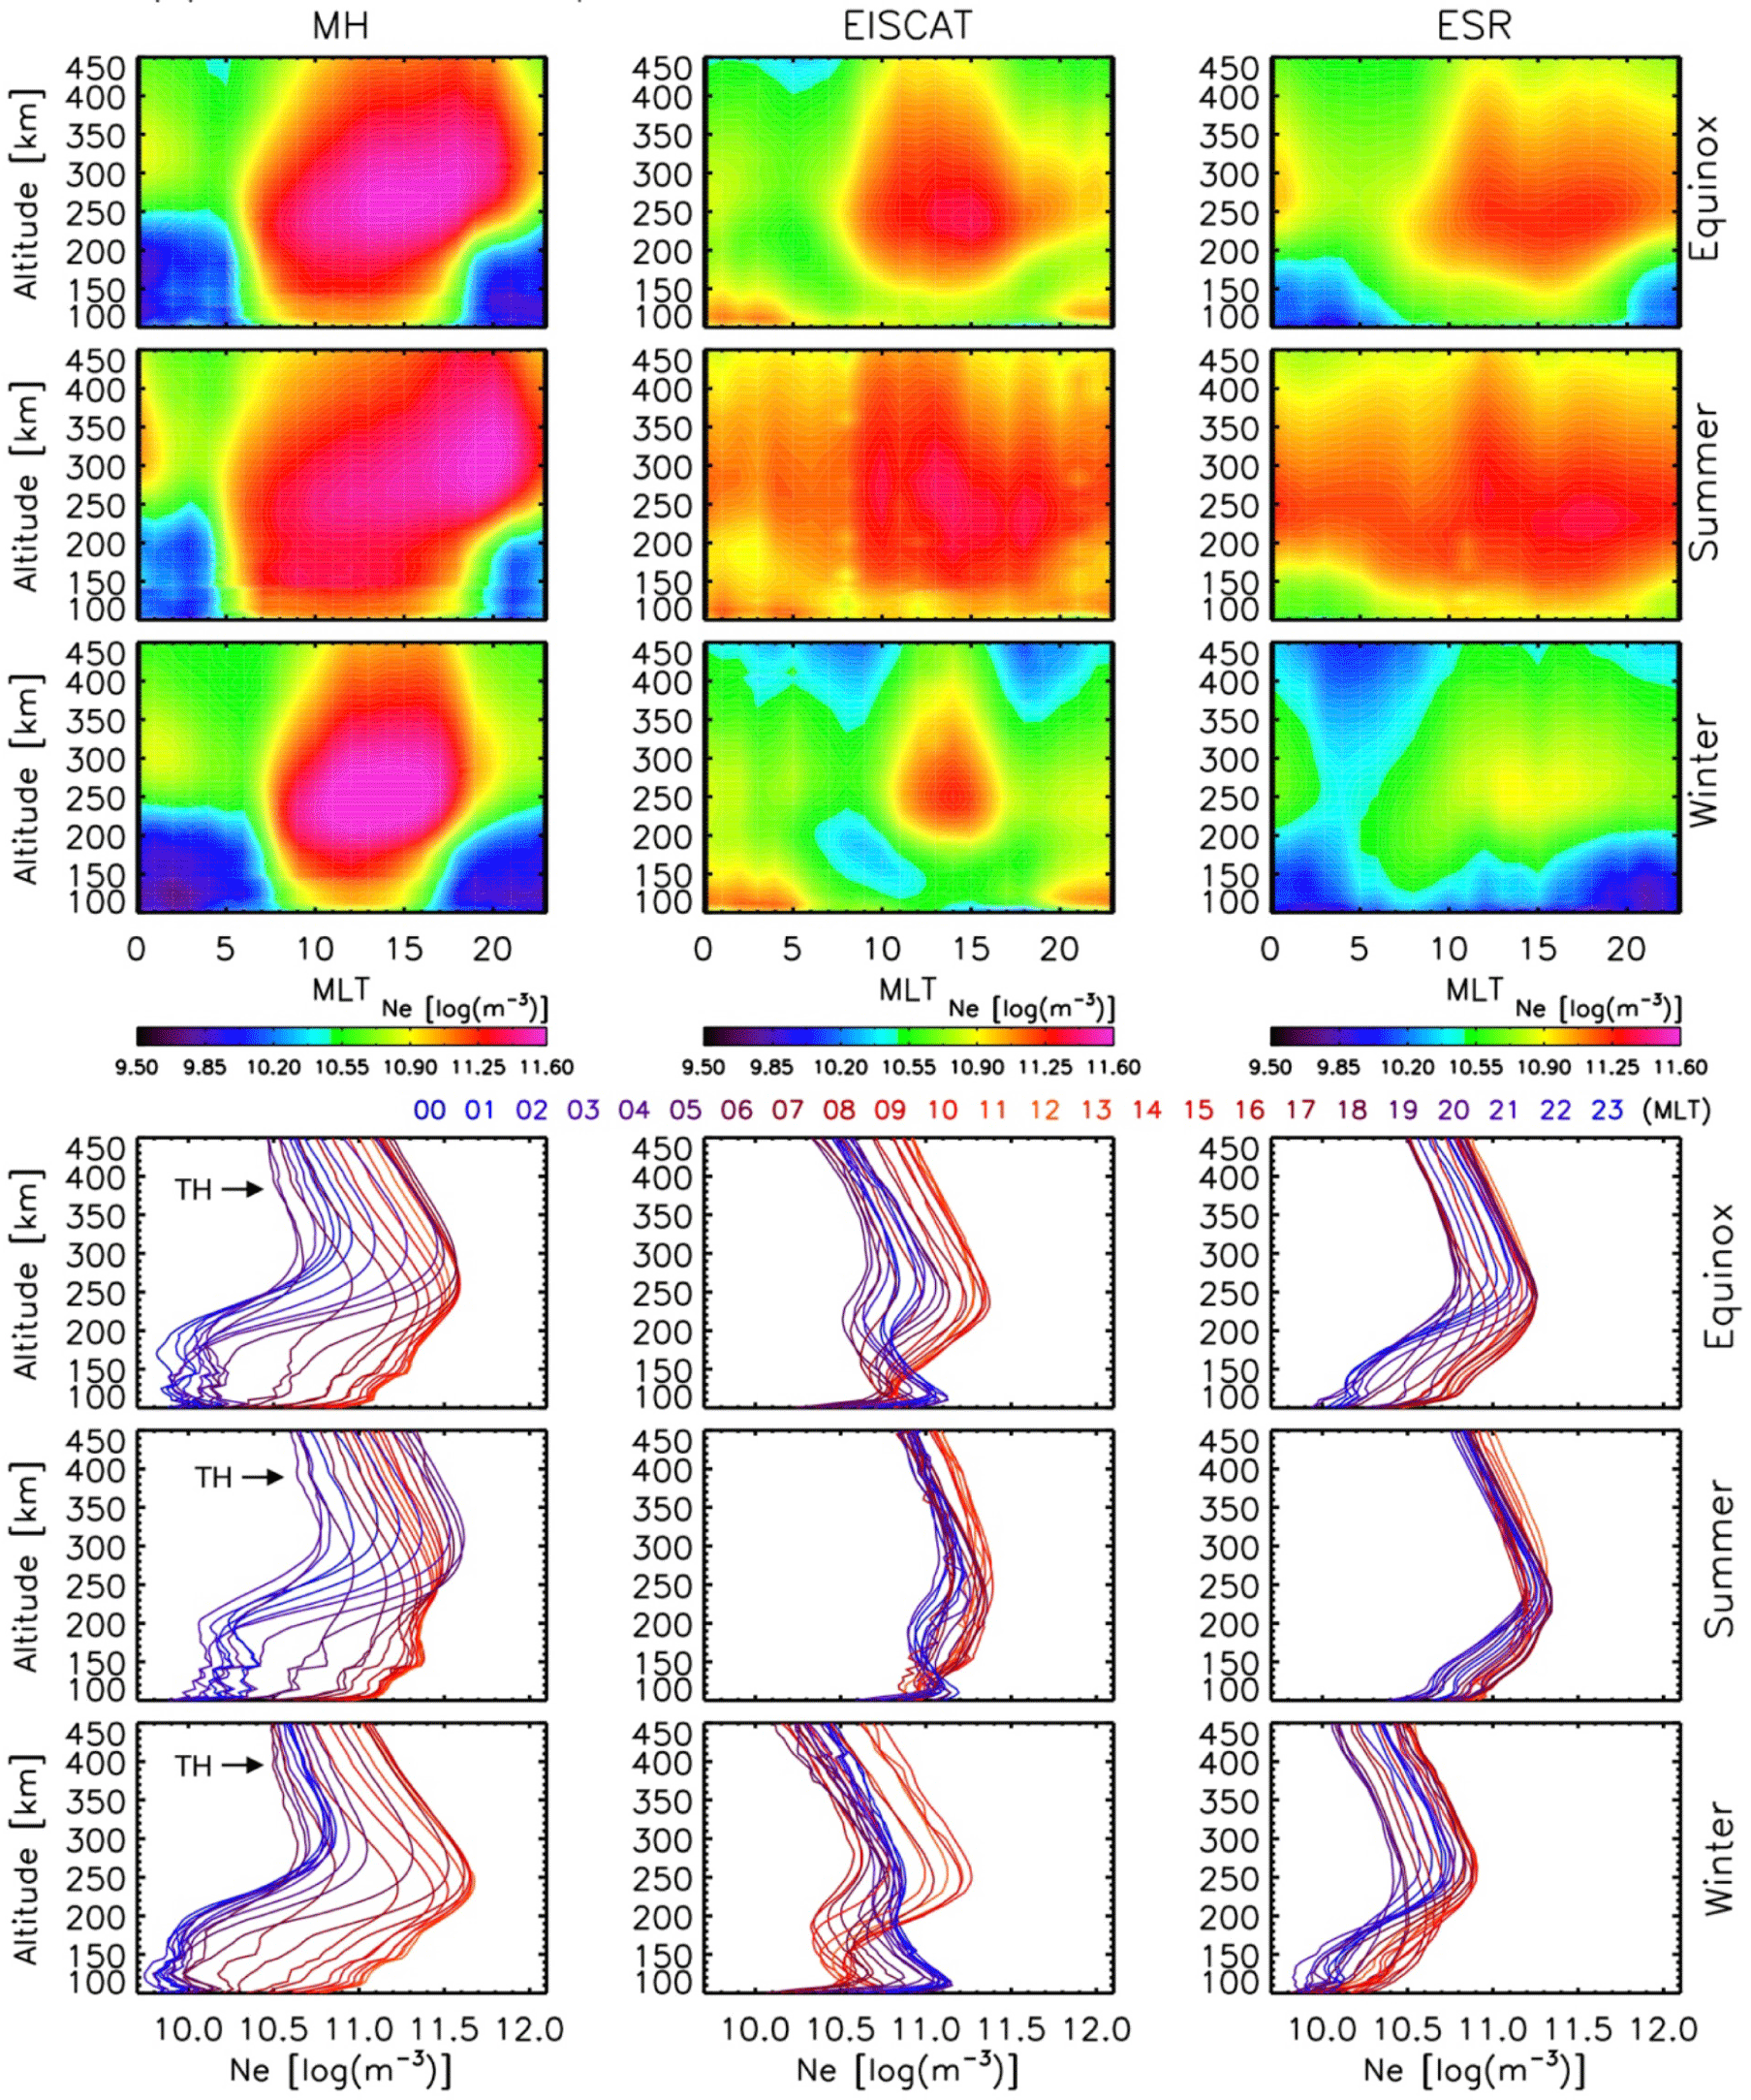
In addition to the diurnal variations of the density profiles, various aspects of the ionospheric density profiles were investigated from the analysis, including F-region peak height, seasonal variations such as winter and semiannual anomalies, E-region density, ionospheric slab thickness and scale height for the topside ionosphere. For example, Fig. 8 shows the diurnal variations of the F-region peak height for the same solar and geomagnetic activity condition as in Fig. 7. As the latitude increases, the diurnal variations of the F-region peak height in the polar region greatly deviate from the typical behavior in the mid-latitude ionosphere. Please see Kim et al. (2020) for more details.

6. SUMMARY AND FUTURE RESEARCH
KOPRI and KASI have jointly been participating EISCAT radar observations of the dayside polar cap and cusp ionospheres since 2015. This article briefly reports the KOPRI-KASI joint observational activities using EISCAT radars during winter season in 2016 and 2018 as well as the collaborative observation with HIWIND thermospheric wind observation. Furthermore, since the participation to the EISCAT, we were able to utilize unprecedented long-term polar ionospheric data from the EISCAT radars at three different sites. Using these data, we performed a study on the characteristics of the occurrence of ion upflow in association with ion/electron heating in the polar ionosphere. Also investigated is the climatology of the polar ionospheric density profiles in comparison with the mid-latitude ionosphere.
Currently, the next-generation 3-dimensional EISCAT radar observation system is under construction and will be equipped with the unpresented capabilities of state-of-the-art electronics, networking, storage and computing in order to monitor the upper atmosphere with five key attributes of volumetric imaging and tracking, interferometric imaging, multistatic configuration, greatly improved sensitivity, and transmitter flexibility (McCrea et al. 2015). In association with the extension of the capability of EISCAT observations, there are several other observations that are currently (or soon-to-be) available from the ground in the Arctic and Antarctica and from the space. For example, KOPRI operates FPIs in Kiruna and Svalbard to observe the neutral winds, which can be used with the EISCAT ion drift observations to study on the ion-neutral coupling processes during polar nighttime. Also, in Jang Bogo Station (JBS), Antarctica, they are operating various instruments to observe the ionosphere, the thermosphere, the magnetosphere, and the aurora. The JBS is also located near the boundary region between the polar cap and the auroral oval as the Dasan station in Ny-Ålesund, Svalbard and therefore the observations at both locations can be utilized for the study on interhemispheric differences. KASI is recently preparing for satellite missions such as Republic of Korea Imaging Test System (ROKITS) for the auroral observations and Small-scale magNetospheric and Ionospheric Plasma Experiments (SNIPE) for the observations of spatial and temporal variations of the micro-scale plasma structures in the topside ionosphere. These polar orbiting satellite missions will provide supplementary observations which can be utilized together with EISCAT observations to enhance our understanding of the upper atmosphere in the polar region.