1. INTRODUCTION
Monitoring the terrestrial ionosphere-thermosphere in the Far-Ultraviolet (FUV) wavelength regime has been an essential tool in aeronomy because it provides comprehensive information on the particle density, temperature, and composition. Since the Earth’s FUV emissions are absorbed before reaching ground-based equipments, space-based observations are necessary: e.g., Global Ultraviolet Imager (GUVI) on Thermosphere Ionosphere Mesosphere Energetics and Dynamics (TIMED) at a Low-Earth Orbit (LEO), the FUV imagers onboard Polar or Imager for Magnetopause-to-Aurora Global Exploration missions at Highly elliptical Earth Orbits (HEOs), and Global-scale Observations of the Limb and Disk (GOLD) on SES-14 at a Geosynchronous Orbit (GEO), to name a few. FUV images of the Earth’s disk portray horizontal structures of the ionosphere (Kelley et al. 2003;Immel et al. 2006) and thermosphere (Zhang et al. 2021) as well as aurora (Mende et al. 2003;Lee et al. 2011). On the other hand, FUV limb observations are able to catch vertical profiles of the ionosphere/thermosphere system, from which we can derive secondary information such as exospheric temperature (Evans et al. 2020).
FUV disk observation has been extensively used for investigating small-scale irregularities in the ionosphere/ thermosphere, such as Equatorial Plasma Bubbles (EPBs) that occur at nightside low-latitude regions. Kelley et al. (2003) demonstrated that EPB signatures in TIMED/GUVI’s 135.6 nm disk images agree with those from coordinated ground-based observations of near-infrared light (777.4 nm). Immel et al. (2003) derived zonal drift velocities of EPBs using the IMAGE/FUV disk images. Henderson et al. (2005a, b) developed a method of automatic EPB identification in the TIMED/GUVI disk images and statistically analyzed the EPB distribution. Eastes et al. (2019) reported that EPBs in GOLD 135.6 nm disk images are accompanied with locally intensified Equatorial Ionization Anomaly (EIA) in terms of both the latitudinal extent and FUV intensity: see also Cai et al. (2020, Fig. A2). Martinis et al. (2021) investigated EPB climatology in the GOLD disk images and compared them with the Rayleigh-Taylor instability theory.
On the contrary, usage of FUV limb images has been restricted in most cases to elucidating large-scale morphology of the ionosphere/thermosphere: e.g., ionospheric vertical profiles (DeMajistre et al. 2004), largescale Pedersen conductivity (Kil et al. 2006), or exospheric temperature (Evans et al. 2020). We could find only one study (Kamalabadi et al. 2003) that investigated smallscale fluctuations in FUV limb images, such as EPBs. Those authors used TIMED/GUVI limb scans for the purpose, but the details are unavailable on the web except for an abstract. Kelley et al. (2003, Fig. 7) and Comberiate & Paxton (2010, Fig. 3) reconstructed 3-dimensional shapes of EPBs (including their vertical profiles), but the method was heavily based on the disk images of TIMED/GUVI. Even among visible airglow observations, only a limited number of studies have ever utilized limb images to investigate ionospheric irregularities. Rajesh et al. (2016) conducted statistical analyses of Medium-Scale Traveling Ionospheric Disturbance (MSTID), which generally occurs at midlatitudes (Sivakandan et al. 2019, and reference therein). They used 630.0 nm (i.e., red-color) limb images taken by the Imager of Sprites and Upper Atmospheric Lightnings onboard the Formosa Satellite II (Formosat-2). Using numerical simulations, Wautelet et al. (2019) investigated possibility of using FUV limb images for MSTID detection. However, the method has not yet been applied to actual observations.
To the best of the authors’ knowledge, no previous study has ever derived EPB climatology from FUV limb images. Motivated by this, we aim at a feasibility test to utilize FUV limb images as a new EPB database. Specifically, we make use of the FUV imager onboard the Ionospheric Connection Explorer (ICON) spacecraft. In the following, Section 2 briefly describes the ICON spacecraft and FUV instruments. Section 3 first presents an example of EPBs observed by ICON/FUV and depicts our method of extracting EPB climatology from the data set. The statistical distribution of EPBs and ambient plasma is addressed at later parts of Section 3. Finally, in Section 4 we discuss the implication of results and draw the conclusions.
2. SPACECRAFT, INSTRUMENT, AND DATA PROCESSING
The ICON spacecraft (Immel et al. 2018) was launched by a Pegasus vehicle on 11 October 2019. The mission orbit has an altitude of about 590 km and an inclination angle of ~27°. Among a suite of payloads for monitoring the terrestrial ionosphere and thermosphere, the FUV instrument measures airglow intensity in two wavelength channels (135.6 nm and 157 nm) in the FUV band (Mende et al. 2017). The instrument’s Field-Of-View (FOV) basically covers the range of 8 degrees to 32 degrees below local horizontal at the spacecraft, which allows viewing of the Earth’s limb in the ultraviolet between 150 km and 507 km tangent altitude. ICON/FUV can steer its FOV in azimuth using a motorcontrolled turret, which was stationary until the summer in 2021. During nighttime, the 135.6 nm airglow intensity can be converted to oxygen ion density, which is largely equivalent to ionospheric plasma concentration around the F-region peak (Johnson 1966, Fig. 1), i.e., for the dominant part of the ICON/FUV’s observation altitudes (150–507 km). Wautelet et al. (2021) compared the ICON/FUV data with ground-based radar observations, and the two sets exhibited reasonably good consistence.
The ICON/FUV instrument produces two official data sets: Level 2.4 (file identifier: ICON_L2_4_FUV_Day) for daytime observations and Level 2.5 (file identifier: ICON_ L2_5_FUV_Night) for nighttime, both of which are given in the network Common Data Form (netCDF). Each file covers one whole day in universal time (UT) and is available at: http://icon-science.ssl.berkeley.edu/pub/LEVEL.2/. In this study, we only use the nighttime data (Level 2.5). Each file provides vertical profiles of 135.6 nm Volume Emission Rate (VER) and O+ density derived from them. One vertical profile is obtained every 12.3 seconds, and for each time stamp the observation locations move with the orbital motion of the spacecraft. The FUV takes six independent vertical profiles from contiguous regions simultaneously, each of which has a horizontal FOV of 3 degrees (called ‘Stripe’; Mende et al. 2017). In total, the daily O+ density (or 135.6 nm VER) is given as a 3-dimensional (3D) cube in the space spanned by (1) Stripe, (2) height, and (3) UT (or observation positions moving with the ICON locations). For each pixel in the 3D cube, geographic latitude (GLAT), geographic longitude (GLON), and altitude of the tangent point are provided among other supplementary information.
For a representative case study, we additionally use disk images of 135.6 nm nightglow taken by the GOLD. The instrument was launched to a geosynchronous orbit at 75°W GLON in January 2018. Since then, it has been monitoring the ionosphere/thermosphere around America and Africa. While GOLD has several observation modes that include dayside/nightside disk /limb imaging, this study uses only the 135.6 nm nightside disk images (product identifier: NI1), which visualize horizontal distribution of ionospheric O+ as seen from above (Eastes et al. 2019). Note that the look direction of GOLD disk imaging (approximately toward the nadir) is nearly perpendicular to that of ICON/ FUV (approximately parallel to the ground) although both instruments measure ionospheric O+. The GOLD data are open to public at the official repository: https://gold.cs.ucf. edu/data/search/.
3. RESULTS
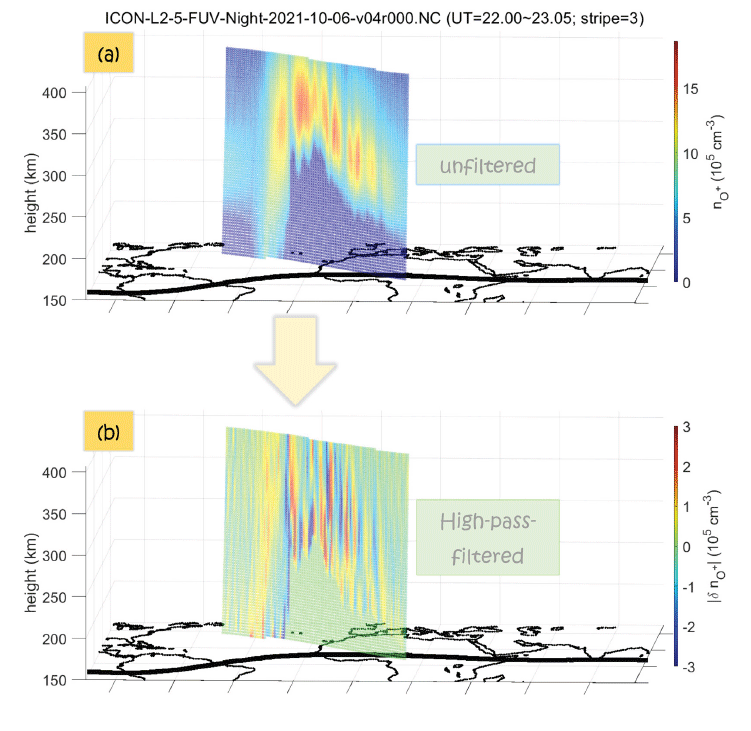
Fig. 1 shows a representative example, from 06 October 2021, of the ionospheric irregularities observed by ICON/ FUV. A 2-dimensional (2D) limb image of O+ density (hereafter, [O+]), which is extracted from 135.6 nm profiles during a nightside pass of ICON, is shown with color pixels. ICON/FUV has 6 independent ‘Stripes’ as stated above, among which only Stripe 3 is shown because other Stripes exhibit largely similar features. We note that the 2D limb image in Fig. 1 is not a snapshot, but is a composite figure of vertical profiles taken at different times along the ICON flying eastward on its orbit: i.e., western slices were taken earlier than eastern ones. A world map is given at the bottom of each panel, where the thickest black curve represents the dip equator. Fig. 1(a) presents the original Level 2.5 data from the ICON/FUV. To isolate small-scale [O+] fluctuations, such as EPBs, we have taken ‘adjacent differences’ (i.e., differences between zonally contiguous bins that are nominally ~12.3 seconds apart) of Fig. 1(a). Specifically, among the three dimensions (Stripe, height, and UT) of the ICON/FUV Level 2.5 data cube, we take the adjacent differences along the third dimension (UT). A MATLAB function, diff, is used for that purpose. Note that the observation points of ICON/FUV also change with the third dimension (UT): that is, ICON/FUV observes different regions at different UTs. The result of the ‘adjacent differences’ is shown in Fig. 1(b), whose amplitude represents the ‘fluctuation levels’ of [O+]. This approach can be deemed as high-pass filtering whose scale size is ~180 km. As ICON’s orbit speed is about 7.5 km/s, and the time interval between two consecutive ICON/FUV observations is about 12.3 seconds, the minimum resolvable scale is 7.5 (km/s) × 12.3 (s) × 2 ≈ 180 km according to the Nyquist’s theorem. EPB identification with the help of high pass filters has been a common practice in the aeronomy community (Stolle et al. 2006;Xiong et al. 2010;Park et al. 2021).
The ICON/FUV data in Fig. 1(a) host inhomogeneities that resemble ionospheric irregularities predicted earlier by the ‘Sami2 is Another Model of the Ionosphere’ (SAMI2) in Rajesh et al. (2016, Fig. 7) or by SAMI3/WACCM-X in Huba & Liu (2020, Figs. 4 and 5). In Fig. 1(b) (high-pass-filtered image) we see that the fluctuation levels are high (with alternating deep red and blue colors) wherever [O+] appears inhomogeneous in Fig. 1(a).
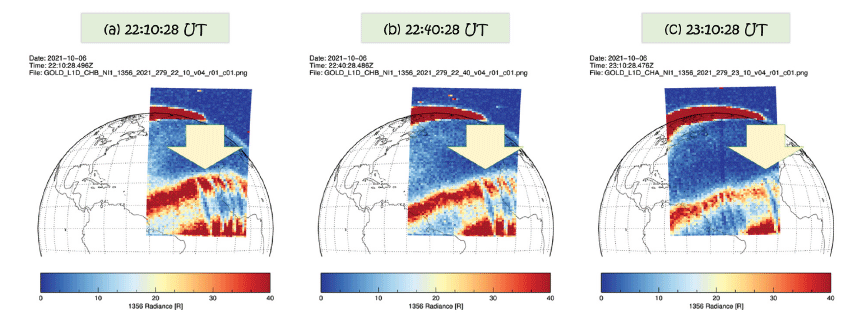
To confirm that the [O+] inhomogeneity observed by ICON/FUV represents plasma irregularities, not an instrument artifact, we look for simultaneous observations of 135.6 nm nightglow by GOLD. Fig. 2 presents time series of GOLD disk images (quick-looks) at 30-minute intervals, which are selected due to their temporal proximity to Fig. 1: (a) 22:10:28 UT, (b) 22:40:28 UT, and (c) 23:10:28 UT on 06 October 2021. Above West Africa and adjacent Atlantic Ocean in Fig. 2 (see the downward arrows), where ICON/ FUV recorded [O+] inhomogeneity as shown in Fig. 1, GOLD also observed EPB signatures (the bluish slits aligned approximately in the North-South direction; see Eastes et al. 2019 for comparison).
In Fig. 3, the color palette corresponds to the GOLD observation in Fig. 2(b), which is now interpolated at regularized GLAT-GLON grids. Note that original GOLD data have non-uniform GLAT-GLON grids, as can be seen in Fig. 2. The thick blue curve in Fig. 3 indicates the GLAT and GLON of the ICON/FUV tangent points around 300 km altitude. Specifically, Height Bin 86 (among 129 bins in total) is shown, whose mean tangent altitude was 299.9 km on this day with the standard deviation of 6.1 km. The 300 km corresponds to the nominal altitude of GOLD 135.6 nm nightglow. The thin blue curve with picket fences qualitatively represents [O+] [with a maximum value of 1.5 × 106 cm–3; see also Fig. 1(a)] for the ~300 km bin (Height Bin 86). The grid of gray dashed lines in the background corresponds to constant magnetic latitude (MLAT) and longitude (MLON) at 10-degree intervals. The thickest of them marks the dip equator. Both the MLAT and MLON are calculated in the Quasi-Dipole coordinate system as described in Laundal & Richmond (2017). The reddish regions in Fig. 3 (i.e., intense GOLD 135.6 nm nightglow) form two large-scale bands running parallel to the dip equator with a latitudinal separation of about ±10o MLAT, which are the EIA crests (Immel et al. 2006;Eastes et al. 2019). The reddish EIA bands are not zonally homogeneous. They instead exhibit substructures of nightglow depletion, which are elongated roughly in the North-South direction (i.e., cross-equatorial yellow wedges in Fig. 3). Eastes et al. (2019) attributed such substructures to EPBs.
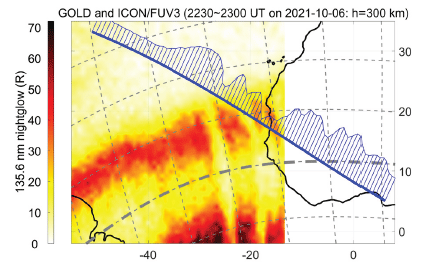
In Fig. 3, the point-to-point agreement between GOLD and ICON/FUV looks imperfect. However, we should keep in mind that both data are based on Line-Of-Sight (LOS) integration of FUV light, and that the two LOS directions are drastically different (nearly perpendicular to each other) as well as the geolocation methods (i.e., how to assign a representative location to each LOS measurement). Furthermore, standard mapping of the GOLD nighttime (NI1) images, which is used in Figs. 2 and 3, assumes that the emissions come from 300 km. Deviations of F-region peak altitudes from 300 km, which can be partially gleaned from Fig. 1, will introduce nonzero mapping errors in the GOLD NI1 images. Hence, it may be natural that GOLD and ICON/FUV exhibit imperfect correlations. As GOLD and ICON/FUV simultaneously observed [O+] fluctuations at similar locations, we argue that GOLD confirms the ability of ICON/FUV to identify EPBs although different LOS directions and possible mapping errors may compromise agreement between the two instruments. Encouraged by this case study, in the following Subsections we statistically analyze the ICON/FUV [O+] fluctuations using the high-pass filter (i.e., adjacent differences) that was applied to Fig. 1(b).
Before addressing the EPB statistics, we first present climatology of unfiltered [O+] to prove the overall quality of ICON/FUV data. Fig. 4 presents world maps of ICON/ FUV [O+] readings, which are averaged over the height range between 200 km and 400 km. ICON/FUV Stripe 3 data from 16 November 2019 to 31 January 2022 (~2 years) are used. Note that ICON/FUV provides [O+] data only for the nightside. Hence, our statistical analyses focus on the Local Time (LT) range between 18:30 and 04:30 (via midnight). For quality control, we only use the data points whose error levels do not exceed 5 × 104 cm–3, and discard vertical profiles that are separated by more than 13 seconds from the next one within a day.
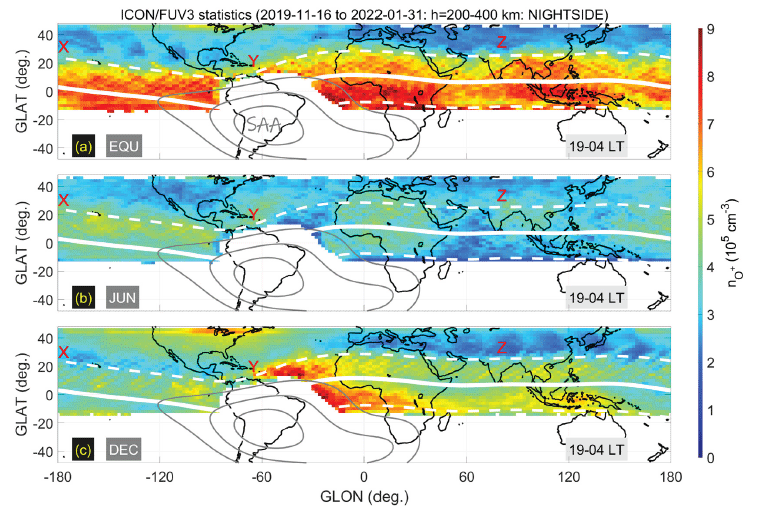
Each panel corresponds to a season: (a) combined equinoxes (March–April and September-October), (b) June solstice (May-August), and (c) December solstice (November-December and January–February). The thick solid white line in the middle of each panel represents the dip equator, and thinner dashed white lines correspond to ±20° MLAT. The gray solid contour lines of geomagnetic field strength indicate approximate positions of the South Atlantic Anomaly (SAA). The field is calculated for the reference height of 300 km (approximately the center of the altitude range in Fig. 4) with the CHAMP, Ørsted and SAC-C (CHAOS) magnetic field model that is available at: https:// www.space.dtu.dk/english/Research/Scientific_data_and_ models/Magnetic_Field_Models. Only the core magnetic field is calculated while the crustal and external fields of the model, both of which are much weaker than the core field, are omitted for simplicity. The contour levels (21 μT, 23 μT, and 26 μT) are arbitrarily chosen, but the outermost contour (26 μT) is qualitatively similar to the statistical regions of SAA-induced radiation effects that were reported in Schaefer et al. (2016, Fig. 4) and Anderson et al. (2018, Fig. 11).
In Fig. 4, bins containing less than 200 data points are shown white. ICON/FUV coverage has been much better in the Northern Hemisphere (NH) than in the Southern Hemisphere (SH) because it has viewed toward the North and ICON orbits with a low (27°) inclination angle (i.e., from West to East; Mende et al. 2017, Figs. 4 and 5). An additional data gap exists around the SAA, which can also be found in Urco et al. [2021, Fig. 2(c)] and Wautelet et al. (2021, Fig. 4). The gap results from high-energy particles abundant in the SAA, which hinder proper operations of FUV imagers at LEO (Zhang et al. 2013, Fig. 1).
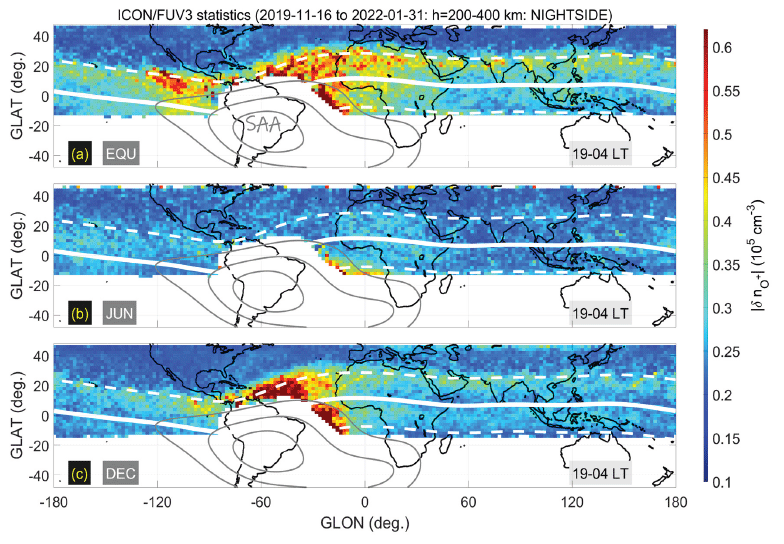
The [O+] climatology in Fig. 4 broadly agrees with previous studies. First, [O+] during June solstice [Fig. 4(b)] is lower than in the other seasons, which agrees with Kim et al. (2006, Fig. 2) and Ryu et al. (2016, Fig. 2), to name a few. Second, equatorial density in equinoxes [Fig. 4(a)] and June solstice [Fig. 4(b)] roughly exhibit wavenumber-4 structures of the EIA that is consistent with Immel et al. (2006, Fig. 3) and Tsai et al. (2019, Fig. 9). In those papers, the four peaks of the nightside EIA are located around Africa (~0°E GLON), Indonesia (~100°E GLON), Central Pacific Ocean (~170°W GLON), and Colombia (~90°W GLON). These peaks are reproduced in Figs. 4(a) and (b) except for the last one that is largely masked by the data gap around the SAA. During December solstice [Fig. 4(c)], the nightside wavenumber-4 structure is replaced by wavenumber-2 structure with the prime peak near South America (~70°W GLON) and the secondary peak around Indonesia (~100°E GLON). The structure is consistent with Tsai et al. (2019, Fig. 9).
Third, in every panel of Fig. 4, plasma density above the Caribbean Sea (annotated with red ‘Y’) is higher (i.e., more reddish or less bluish) than at regions with similar MLAT and different MLON (annotated with red ‘X’ and ‘Z’, for instance). This feature is by and large consistent with previous studies (Li et al. 2018b, Fig. 2;Li et al. 2018a, Figs. 1 and 3). Trans-hemispheric wind and concomitant fieldaligned plasma transport are known to induce a hemispheric asymmetry in off-equatorial ionospheric density (Khadka et al. 2018, Fig. 10). As zonal wind blows eastward at night (Xiong et al. 2015, Fig. 6), it can induce trans-hemispheric plasma transport (and resultant hemispheric asymmetry) once combined with large magnetic declination (e.g., above the Caribbean Sea; ‘Y’ in Fig. 4): refer to Kim et al. (2006, Fig. 1), Ryu et al. [2016, Fig. 6(d)], and Li et al. [2018b, Fig. 6(a)]. Specifically, enhancement and depletion of [O+] appear in the windward and leeward hemisphere, respectively. Above the Caribbean Sea (‘Y’), where the geomagnetic declination is strongly negative, eastward wind is expected to enhance off-equatorial [O+] in the NH (the windward hemisphere). This mechanism can explain why in Fig. 4 [O+] at ‘Y’ is higher than at ‘X’ and ‘Z’ in each season.
On the other hand, nighttime meridional wind generally blows from the summer hemisphere to the winter. It also increases and decreases plasma density in the summer (windward) and winter (leeward) hemispheres, respectively (Lin et al. 2007, Fig. 3). However, in Fig. 4 this hemispheric asymmetry cannot be clearly seen because of the data gap in the SH and the SAA.
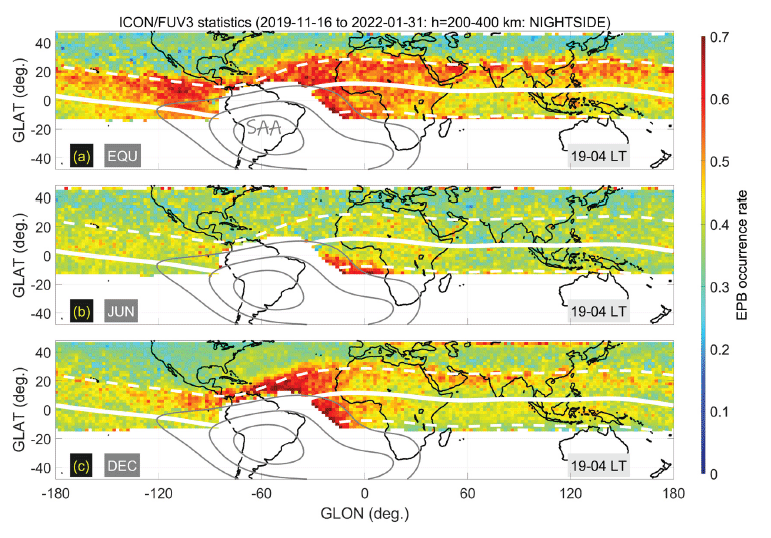
In this Subsection we statistically investigate [O+] fluctuation levels, which we obtain by applying a highpass filter (specifically, ‘adjacent differences’ along the ICON orbit) to the [O+] readings from the ICON/FUV Level 2.5 product [see, for example, Fig. 1(b)]. Fig. 5 is similar to Fig. 4, but the color palette represents the fluctuation level of [O+], which is derived from absolute values of the high-pass-filtered ICON/FUV [O+] at 200–400 km altitude. In the following discussions, as a conservative approach, we neglect the dark red regions within the outermost gray contour (e.g., the dark red regions surrounding the white data gaps near the SAA), which may be contaminated by high-energy particles in the SAA and exhibit stronger [O+] fluctuations than real.
We first address the seasonal-longitudinal distribution of ICON/FUV [O+] fluctuation. During equinoxes [Fig. 5(a)] strong fluctuations (reddish/yellowish regions) emerge over a wide GLON range with the global maximum located above the Atlantic Ocean. For June solstice [Fig. 5(b)] the fluctuation levels are overall lower (mostly bluish) than in the other seasons. There are two maxima during June solstice located above Africa and the Pacific Ocean. During December solstice [Fig. 5(c)] intense fluctuations are concentrated above the Western Atlantic Ocean and South America. All these features agree with the EPB climatology reported in existing literature: e.g., Stolle et al. (2006, Fig. 5), Xiong et al. (2010, Figs. 5 and 6), and Aol et al. (2020, Fig. 9).
Next, we turn our attention to the latitude dependence of [O+] fluctuation. During equinoxes [Fig. 5(a)] and December solstice [Fig. 5(c)], fluctuation levels are higher around +20° MLAT (white dashed line in the NH) than at the dip equator. As the conjugate region in the SH (–20° MLAT) is at the border of the FOV or even outside of it, we do not discuss them in detail. The strong fluctuation at off-equatorial regions along +20° MLAT agrees with the Carter et al. (2013, Fig. 5), who used Radio Occultation (RO) technique based on Global Navigation Satellite System (GNSS) signals. Note that some previous studies based on in situ plasma diagnoses reported peak EPB occurrence around ±10° (Stolle et al. 2006, Fig. 7; Jin et al. 2020, Figs. 5–7). The discrepancy between +20° (Carter et al. 2013) and +10° MLAT (Stolle et al. 2006) can be explained by the different altitudes they investigated. Most in situ observations are conducted above 400 km altitude (Stolle et al. 2006;Jin et al. 2020). On the contrary, our study and Carter et al. (2013, Fig. 5) can deal with the altitude range below 400 km. Because EPBs are largely field-aligned, they appear at higher MLAT when observed at lower heights. For June solstice [Fig. 5(b)], regions of strong fluctuations (green areas) are located more equatorward than in the other seasons. This feature is also consistent with Carter et al. (2013, Fig. 7). To sum up, fluctuation levels of ICON/FUV [O+] generally exhibit the known climatology of EPBs (i.e., their seasonal-longitudinal-latitudinal variation), which indicates that ICON/FUV data are suitable for EPB detections.
For completeness, Fig. 6 presents EPB occurrence rate in a similar format to that of Fig. 5. For every bin in Fig. 6, the EPB occurrence rate is defined as the ratio between (1) the number of ICON/FUV Level 2.5 data points having [O+] fluctuation levels above a threshold (2.5 × 104 cm–3) and (2) the total number of data points. The threshold of 2.5 × 104 cm–3 is selected based on visual inspection of Fig. 5, which represents average [O+] fluctuation levels. In Fig. 6, the dark red regions surrounding the SAA-related data gap [especially in Fig. 6(b)] might be affected by the SAA and are neglected in the following discussions. The EPB occurrence rate in Fig. 6 is largely consistent with the [O+] fluctuation levels in Fig. 5. For instance, the EPB occurrence rate is lower in June solstice [Fig. 6(b)] than in the other seasons [Figs. 6(a) and 6(c)]. The EPB occurrence is widespreadduring equinoxes [Fig. 6(a)] and mostly concentrated in the Atlantic Ocean during December solstice [Fig. 6(c)]. These climatological behaviors also agree with previous studies on EPB occurrence rate, such as Su et al. (2006, Fig. 3).
4. DISCUSSIONS AND CONCLUSIONS
In the preceding Section, we have confirmed the capability of ICON/FUV to monitor both the ambient plasma and irregularities in the nighttime ionosphere. First, distribution of ambient [O+] in the ICON/FUV data (Fig. 4) reproduces several well-known characteristics of the tropical ionosphere, such as (1) lower density during June solstice than in the other seasons, (2) wavenumber-4 structures during equinoxes and June solstice and (3) signatures of inter-hemispheric plasma transport by zonal wind, which is outstanding around the Caribbean Sea. Second, seasonallongitudinal- latitudinal distribution of high-pass-filtered [O+] measured by ICON/FUV (Fig. 5) conforms to the EPB climatology in existing literature. Hence, we can conclude that Fig. 5 gives the first ever EPB statistics based on FUV limb images.
The merit of the ICON/FUV data over conventional topside in situ plasma diagnoses (e.g., observations with Langmuir probes or ion traps; e.g., Lee et al. 2002;Stolle et al. 2006;Min et al. 2009;Huang et al. 2014) is that the former covers the F-region density peak (around 300–350 km in altitude) while the latter usually cannot. Although GNSS/RO can also probe EPBs at those altitudes (Ma et al. 2019, Figs. 5 and 6;Kepkar et al. 2020, Fig. 7), RO is heavily constrained by availability of GNSS signals (i.e., occultation geometry). For example, the RO technique cannot regularly take a seamless 2D limb image over several thousand kilometers. On the other hand, ICON/FUV observes natural (and everpresent) FUV emissions from terrestrial plasma itself and can conduct continuous 2D imaging of the ionospheric limb. Therefore, EPB identification using ICON/FUV can be a useful complement, to say the least, to the RO-based EPB detections. Another merit of ICON/FUV is its coordination with the Ion Velocity Meter (IVM) onboard ICON. Though the former is a remote sensor with the latter being made for in situ diagnosis, the two observations can be combined into one broad context when they are connected through geomagnetic field lines (i.e., when the two data are magnetically conjugate to each other).
We note that ICON/FUV also has some inherent limitations, mainly due to the constraints from the spacecraft orbit and attitude. First, the FOV has been biased to the NH and left unobserved a large part of the Southern tropical ionosphere: see Figs. 4–5. The existence of the SAA and concomitant data gaps exacerbates the situation. Second, ICON/FUV is not an optimal means for tracking temporal evolution of an EPB. LEO spacecraft such as ICON passes through a region with a high speed (~7.5 km/s). Adjacent orbits are unlikely to observe the same EPB because their equator crossings are separated by more than 2,500 km, which is much larger than typical EPB sizes (Choi et al. 2017, Fig. 5). Therefore, irregularity speed estimation, as was done by Immel et al. (2003) or Karan et al. (2020), is hardly achievable with ICON/FUV. These limitations should be carefully considered when we design new analyses or campaigns incorporating ICON/FUV.
The limitations can be partly alleviated by potential synergy between ICON/FUV and another contemporaneous 2D FUV imager, the GOLD mission. First, the ICON/FUV data gap at the SAA and in the SH can be complemented by GOLD which monitors the Atlantic region. Second, at least inside the GOLD FOV, temporal evolution of plasma irregularities that ICON/FUV records can be tracked. Furthermore, we may even try 3D reconstruction of [O+] using ICON/FUV and GOLD because their LOS directions are nearly perpendicular and beneficial for tomography. The reconstruction can additionally incorporate in situ [O+] observations by ICON/IVM.
In conclusion, for EPB studies ICON/FUV data can be a useful complement to other observations, such as in situ plasma probes and FUV disk imagers. As we approach to the next solar maximum, both the natural EPB activity (Stolle et al. 2006) and the signal-to-noise ratio of ICON/FUV (i.e., overall ionospheric density level or FUV nightglow strength) would increase. During the coming years, therefore, FUV imaging by ICON/FUV will be a more and more attractive tool for studying EPB climatology.