1. INTRODUCTION
Thermospheric winds are an important parameter for understanding the ionosphere. Because of magnetosphereionosphere interaction, thermospheric winds are affected by magnetospheric inputs, particularly during geomagnetic storms. One challenge in understanding the magnetospheric effects on thermospheric winds is the lack of a fully coupled magnetosphere ionosphere model. Observations of the thermospheric wind have a long history; most of the ground based Fabry Perot interferometers (FPI; e.g., Biondi & Feibelman 1968;Hernandez 1974;Wu et al. 2004) make routine nightly observations. Given that geomagnetic storms can be hard to predict, long term routine observations are essential for capturing these geomagnetic storm events.
Thermospheric wind observations during geomagnetic active periods have been compared with first principles models like the Thermosphere Ionosphere Electrodynamics General Circulation Model (TIEGCM; e.g., Richmond et al. 1992;Smith et al. 1994;Hernandez & Roble 2003;Wu et al. 2015). While the TIEGCM is a first principles model, it is still driven at high latitudes by empirical ion convection models. Hence, it has been challenging to simulate fast variations during geomagnetic active times with previous models.
Recent progress in the development of Multiscale Atmosphere Geospace Environment (MAGE) (Lin et al. 2021;Pham et al. 2022) provides a useful tool for this kind of study. MAGE directly couples a magnetosphere model [GAMERA, Grid Agnostic Magneto Hydro Dynamic (MHD) with Extended Research Application] with the TIEGCM and is capable of simulating rapid ionospheric and thermospheric responses to magnetospheric and solar wind inputs.
In this paper, we examine a recent geomagnetic storm event on Nov 4, 2021 to investigate how the thermospheric wind responds to the solar wind parameters. We will examine thermospheric winds inside the polar cap at Resolute (75N, 95W, MLAT 83), Eureka (80N, 86W, MLAT 88) and at a mid-latitude location, Boulder (40N, 105W, MLAT 48). Thermospheric winds in the polar cap are affected strongly by the magnetospheric input via the cross polar cap potential (CPCP) and ion drifts. Mid-latitude thermospheric winds will feel the effect of the storm event due to the polar cap expansion and possibly by SAPS (Sub-Auroral Polarization Streams). The MAGE model simulations help interpret the observations; on the other hand, observations can validate the simulations. At high latitudes, the observations can help gauge the performance of the magnetospheric inputs in the model. Combined high and mid-latitude observations will be used to track the storm effects from the polar cap to lower latitude and examine the ability of the MAGE model to simulate the expansion of the storm event in the thermosphere and ionosphere from high to low latitudes. This will be the first comparison between the MAGE and high latitude thermospheric winds.
The paper is organized as follows. We first give a brief description of the model and instrument. Then we show the Interplanetary Magnetic Field (IMF) condition of Nov 4, 2021 geomagnetic storm and thermospheric wind observations from Resolute, Eureka and, Boulder along with the simulation of the winds for comparison. The paper concludes with a discussion and summary of the results.
2. MODEL
The MAGE model has been developed at the NASA Drive Science Center for Geospace Storms. It combines the magnetosphere model GAMERA (Zhang et al. 2019), Rice Ring Current model (RCM; Toffoletto et al. 2003) and National Center for Atmospheric Research (NCAR) TIEGCM (Richmond et al. 1992). The RE-developed Magnetosphere-Ionosphere Coupler/Solver (REMIX; Merkin & Lyon 2010) connects the GAMERA with the TIEGCM. Having a magnetospheric driver for the TIEGCM allows the TIEGCM to simulate dynamic responses of the ionosphere and thermosphere to the magnetosphere and solar wind changes at a much higher cadence. MAGE also includes the RCM to simulate the ring current effect. The TIEGCM uses a 1.25 degree resolution latitudinal and longitudinal grid. It has 57 vertical steps from ~97 km to ~600 km. The time step is 5 second and results are saved at 1-minute intervals. IMF and solar wind data are from CDAWeb OMNI with 1 minute resolution.
3. OBSERVATIONAL INSTRUMENTS
The FPI is commonly used for thermospheric wind observation (Biondi & Feibelman 1968;Hernandez 1974;Wu et al. 2004, 2016, 2019). The instrument uses Doppler remote sensing of the O 630 nm emission from thermosphere to extract thermospheric winds. The Resolute and Boulder instruments are built by NCAR with similar design and specs (Wu et al. 2004). The two FPIs have a 10 cm aperture etalon, 9-position filter wheel, a two-axis sky scanner, control computer, and environment control box. The instrument runs automatically and takes observations at four cardinal directions with an elevation angle of 45 degree and in the vertical direction. The integration time for the Resolute and Boulder instruments is 5 minutes. The wind error is about a few meters per second depending on the nightglow intensity. Dark images are obtained regularly. Data are processed on the control computer and sent back to data server daily. The Eureka FPI is also built by NCAR with a 5 cm aperture etalon. It is a compact instrument with single 630 nm emission capability. A rotating stage is used to scan the sky at four cardinal directions with a tilting mirror (45 degree elevation angle). The integration time is 10 minutes.
4. IMF AND SOLAR WIND PARAMETERS
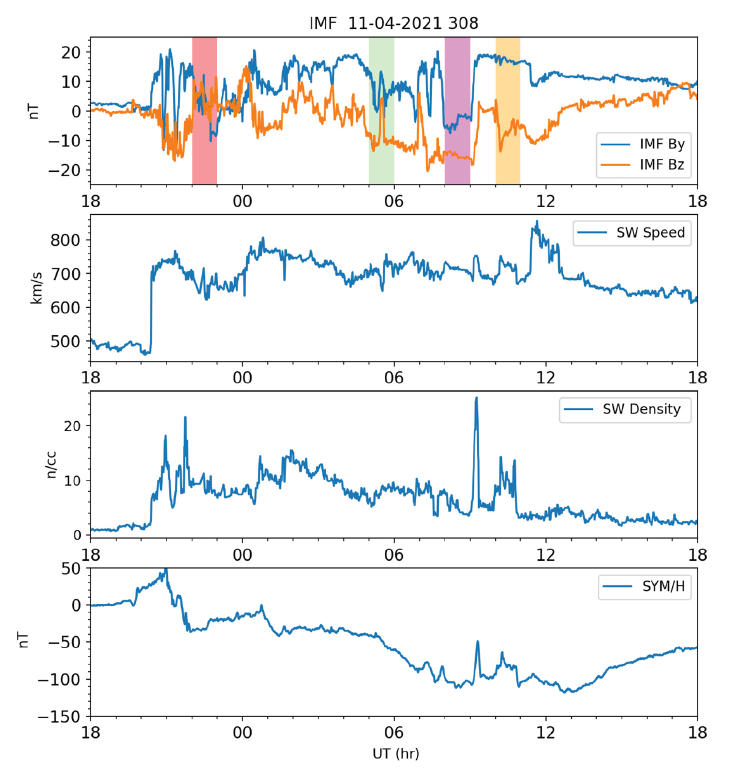
Fig. 1 shows the IMF Bz and By (first panel), solar wind speed (second) panel, solar wind density (third) and the SYM/H (last panel). The data interval is from Nov 3, 18 UT to Nov 4, 18 UT. The IMF southward turning arrived around 2030 UT on Nov 3, 2021, which was accompanied by an increase of the solar wind speed and density (the second and third panels). Afterward, the disturbance lasted for about 12 hours. Four short intervals of special interest are highlighted in the first panel. These will be discussed more in later data analysis and model comparison.

5. RESOLUTE FABRY PEROT INTERFEROMETER (FPI) DATA COMPARISON WITH MULTISCALE ATMOSPHERE GEOSPACE ENVIRONMENT (MAGE)
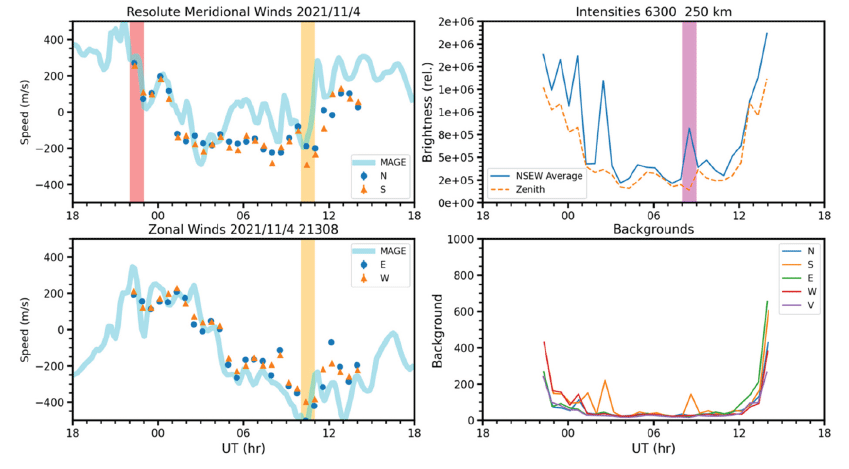
Fig. 2 shows the Resolute FPI data of meridional and zonal winds. The 630 nm emission intensity and background is also plotted. A Boltwood cloud detector provided sky temperature during the night, which ranged from –40℃ to –30℃ indicating clear sky (not shown). The data interval covers the same period as the solar wind parameter data. The MAGE simulation results are also shown in the figure. Because Resolute is inside the polar cap, the thermospheric wind should be more directly affected by magnetospheric input at high latitude particularly the CPCP. CPCP is controlled by the IMF Bz component. The local midnight at Resolute is at 6 UT (middle of the plot). The polar cap thermospheric winds are in the anti-sunward direction due to the day/night pressure gradient (Wu et al. 2016). Consequently, the meridional winds will have mostly equatorward winds at midnight and poleward winds near noon. The zonal winds will be 90 deg out of phase with the meridional winds. The Resolute observed winds are mostly consistent with this pattern. However, there are many small variations in the winds.

The MAGE simulation is mostly consistent with observations. The agreement is better in the zonal winds than in the meridional winds. More importantly, the model captured some of the fast-varying features in the observations. The highlighted regions in Fig. 1 that are relevant to the specific Resolute data are marked in the plot. In the first highlighted interval (red) around 22 UT, Nov 3, both MAGE and FPI showed a reduction of poleward meridional wind by ~200 m/s corresponding to a northward turning of IMF Bz and a reduction of IMF By to zero (Fig. 1). In another highlighted interval (orange) at 10 UT Nov 4, 2021, the meridional winds turned poleward and the zonal wind became less westward. This coincided with the IMF Bz turning southward (Fig. 1). The zonal wind from the FPI did not show changes as large as in the first highlighted interval although these did occur in the MAGE simulation. In the second highlighted region the zonal wind reaction to the southward turning is as strong as in the meridional winds in both observations and MAGE simulations. We should note the wind errors are too small to be seen in the plot. The 630 nm emission intensity shows a strong enhancement at 08 UT Nov 4. The timing for this enhancement matches an IMF By switch from positive to negative.
6. EUREKA Fabry PEROT INTERFEROMETER (FPI) DATA COMPARISON WITH MULTISCALE ATMOSPHERE GEOSPACE ENVIRONMENT (MAGE)
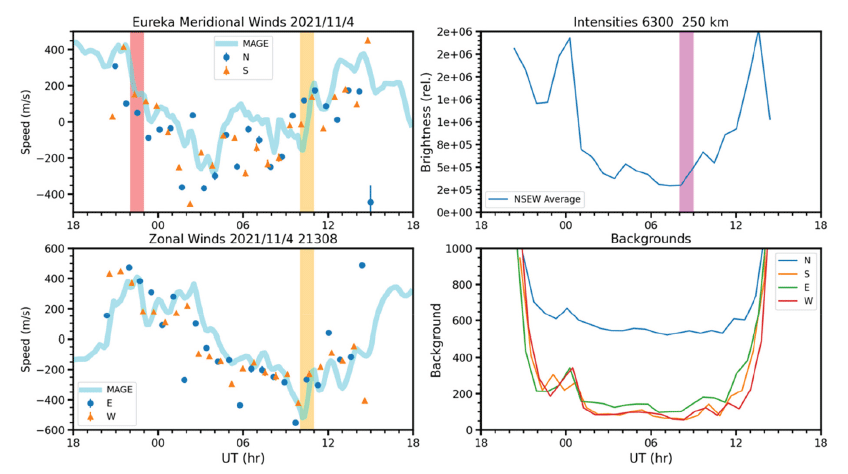
Fig. 3 shows the Eureka FPI data along with the MAGE simulation results in the same format as Fig. 2. The agreement between the observation and simulation is very good. We see the similar variations related to the IMF changed in highlighted intervals. Only the FPI zonal wind change in the first highlighted interval (22UT Nov 3) is more apparent than that at Resolute. The 630 nm intensity enhancement at 08 UT Nov 4, 2021, shown in Resolute is not clear in Eureka, though there is a smaller increase between 9 and 10 UT Nov 4. The backgrounds from three directions are low. The northern viewing direction has a higher level due to a nearby light source. The Boltwood cloud detector was not operational at the time hence no sky temperature is available. Had the sky been cloudy, the neutral winds from all directions will be close to zero as the cloud mixed the nightglow emission from all directions and the Doppler shift will be averaged to zero. That is not the case on Nov 4, 2021, the meridional and zonal winds both have strong diurnal variations similar to that of Resolute, which is an indication of mostly clear sky.

7. BOULDER FABRY PEROT INTERFEROMETER (FPI) WIND COMPARISON WITH MULTISCALE ATMOSPHERE GEOSPACE ENVIRONMENT (MAGE)
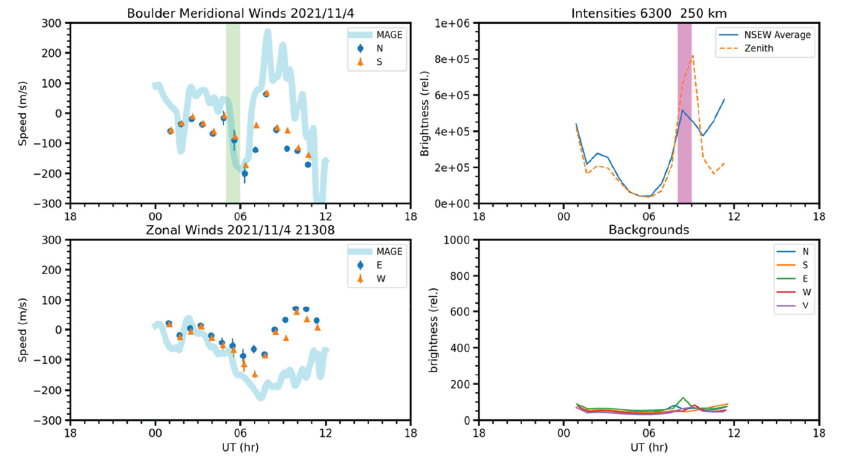
The Boulder FPI data with the MAGE simulations are plotted in Fig. 4 in the same format as Fig. 2. Because Boulder is at mid latitudes, the nighttime is shorter than in Resolute and Eureka. The simulated winds mostly agree with the observation before 06 UT (local midnight). After 06 UT, the simulated winds have much larger meridional winds. The simulated zonal winds are much more westward than the observations.

While we have some discrepancy between the observation and model, one feature is common in both the observation and simulation at 05 UT, which is highlighted (green). The meridional winds turned equatorward both in the observational data and model simulation. This highlighted interval followed a southward turning of the IMF Bz and reduction of the IMF By from positive to zero. At 08 UT, the 630 nm emission enhanced as at Resolute (Fig. 2). The background is low. The sky temperature is stable (not shown) indicating clear sky as in the case of Resolute.
8. DISCUSSIONS
We are fortunate to record this Nov 4, 2021 geomagnetic storm event with optical observations at multiple locations with good weather conditions. The MAGE simulation provides some guidance to help interpret how the thermospheric winds vary in response to the IMF and geomagnetic storm event at high and mid latitudes. Unlike earlier comparisons between observations and simulations (Hernandez & Roble 1976;2003;Smith et al. 1994), we aim to examine some fast variations in the thermospheric winds. We picked a few selected intervals to associate the thermospheric winds variations with possible IMF changes. While we did not catch the start of the storm event, which occurred during daylight time of our observatories, the variations during the storm event still reveal a great deal.
The meridional winds at Resolute and Eureka both responded with a strong reduction of the poleward wind. The local times for both stations are just before dusk. Hence the two locations are in the dusk convection cell. It is possible that the reduction in the poleward wind is related to the decrease on the CPCP related to the northward turn of the IMF Bz.
It is interesting that this southward turning of the IMF Bz did not show much response at high latitudes. It may be because the two high latitude stations are near mid-night. The mid-latitude station shows a strong enhancement in the equatorward wind, which could be due to expansion of the polar cap associated with the storm event.
Followed by negative turning of the IMF By, both Boulder and Resolute observed appear to be the occurrence of aurora, which are seen as the enhancements of 630.0 nm intensity. We should also note that at 08 UT, the SYM/H reached lowest point indicating the peak of the substorm. It also can be the reason for seeing aurora near Boulder and at Resolute at this time.
Resolute and Eureka saw enhancement of poleward meridional winds. Both stations are near dawn. We suspect that the enhancement in the meridional winds is associated with increase of the CPCP resulted from the IMF Bz southward turning. This is a case when the IMF By was positive (~15 nT) and the IMF Bz changed to roughly –10 nT. Under this condition, there is a large dusk convection cell and small dawn cell. As pointing out by a reviewer of the paper, the response to the IMF Bz change is nearly instantaneous in the simulation. In the observation, the response at Eureka was prompt whereas at Resolute there is a delay (~1 hour). A neutral wind delay can be understood by the time takes for ion neutral interaction (Billett et al. 2019). The delay time ranges from 10 to 360 minutes (Billett et al. 2019). It is interesting to see there is almost no delay in the simulation and in observation at Eureka and significant delay at Resolute. The delay can be locally dependent on ion density and ion drift variation. Since the dawnside convection cell is small for this IMF orientation, any derivation between the model and the real condition can lead to very different ion drift variation. We also cannot rule out that the ion drift at Eureka responses to the IMF faster as it is near the magnetic pole. All these unresolved questions call for more observations inside the polar cap.
It is encouraging to see that the MAGE model can capture some of the thermospheric wind fast variations in connection with the IMF and is supported by observations. The agreement between the model and observation seems to be better at high latitudes than at mid latitudes. At high latitude the thermosphere is more directly connected to the magnetosphere. Consequently, the coupling between the magnetosphere and ionosphere is better presented in the model. In the mid-latitudes, on the other hand, the MAGE model has high and low latitude boundaries, which is imposed and therefore may not represent the real condition. Consequently, the discrepancy between the model and observation is not unexpected.
Because of the MAGE simulation, we were able to provide some confirmation of the possible link between the thermospheric wind feature at high and mid-latitude with IMF variations. Simultaneously, the observations help to validate the simulations. It is not easy to link the thermospheric wind variations to those in the IMF. During the geomagnetic storm, the evolution of the storm can also change thermospheric winds. How the thermospheric wind respond to the IMF changes depends on the location and local time. Further analysis of global model output will be very helpful to put the local variations in the global perspective. It is critical that we have multi-station observations and these possible responses occurred at more than one location verify each other. We should also note that MAGE comparison is better than the SuperDARN data driven TIEGCM (Wu et al. 2015) comparison with Resolute observation during geomagnetically disturbed period. At the same time, there are still noticeable discrepancies between observations and simulations and further studies are needed.
9. SUMMARY
Using three FPI observations from high to mid latitudes, we examined thermospheric wind response to IMF changes during a geomagnetic storm event on Nov 4, 2021 in conjunction with the magnetosphere ionosphere coupled model MAGE. We were able to identify thermospheric poleward wind reduction possibly linked to a northward turning of the IMF around 22 UT on Nov 3 and an enhancement to a southward turning near 10 UT on Nov 4 at high latitudes. An IMF southward turning also probably led to an enhancement of equatorward winds at Boulder near midnight. Simultaneous occurrence of aurora may be associated with IMF By turning negative. The MAGE model wind simulations are consistent with observations in those cases. These results show that the MAGE can be a very useful tool to further study the magnetosphere and ionosphere coupling effect on the thermospheric winds.