1. INTRODUCTION
Severe ionospheric turbulences occur at night in the equatorial F region through the phenomenon known as “plasma bubbles.” Plasma bubbles are produced by the transport of low-density plasma from the bottomside of the F region to the topside, where the plasma density is higher. As a result, plasma bubbles appear as plasma depletions with respect to ambient plasma in the topside. The generation mechanism of a bubble and its threedimensional structure are discussed in the review by Kil (2015) and references therein. Equatorial plasma bubbles (EPBs) have been observed for about a century by using various techniques on the ground and from space. A distinguishing behavior of EPBs identified from a range of observations is that EPB activity systematically varies with season and longitude. The data also show a dependence on the solar cycle. These three factors (season, longitude, and solar cycle) provide a basic framework with which to understand the climatological behavior of EPBs.
This review focuses on the climatological behavior of EPBs and its drivers. Occasionally, deviations from the usual climatological behavior are caused by known natural phenomena, such as geomagnetic activity, volcanoes, earthquakes, and tropical storms. The EPB climatology is not affected by these deviations because the aggregate anomalous days make up only a small portion of the total observation days. Because the physical processes underlying the EPB climatology are generally applicable to any conditions, the deviations can also be explained on the basis of the driving mechanisms of the climatology.
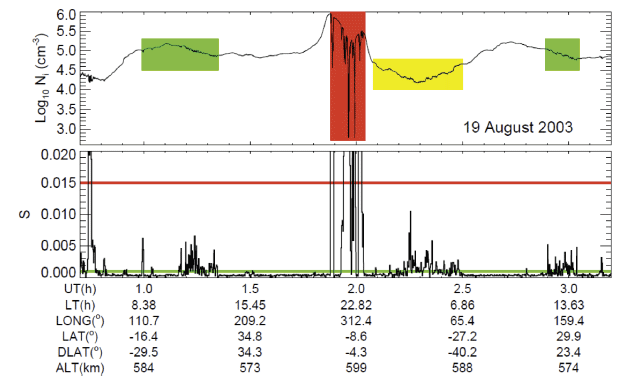
The sample measurement of plasma density in Fig. 1 shows the development of different types of irregularities in the low-latitude F region (Kil et al. 2020). The observation was made by the first Republic of China satellite (ROCSAT-1) at an altitude of 600 km on 19 August 2003. The red shading indicates typical nighttime EPBs. The plasma density for some of the EPBs is more than an order of magnitude lower than the background. Small amplitude irregularities (yellow shading) also develop at night, but their morphology is different from the EPB morphology in red shading. The different characteristics of the irregularities can be related to differences in the detection time, latitude, or generation mechanism. The green shaded areas indicate the irregularities detected on the dayside. The bottom plot is the irregularity index S defined as
Here Ni is the electron density, Li is the linear fit of log10 Ni, and n is the number of data points. S was calculated for n = 10 (10-second data).
Because large-amplitude EPBs are of primary interest, many studies used a threshold similar to the one indicated by the red line (S = 0.015) for the EPB detection. The currently established EPB climatology is primarily based on intense EPBs, such as those indicated by red shading. The baseline of the S value is ~0.0005. The small-amplitude irregularities above this baseline can be detected by using the threshold 0.001 (green line). Daytime irregularities in Section 4 are detected by using this threshold. The small amplitude irregularities at night (yellow shading) are also interesting phenomena, but this review does not address these irregularities because we do not yet know enough about their behavior and origin to establish their climatology.
2. CLIMATOLOGY OF NIGHTTIME EQUATORIAL PLASMA BUBBLEs (EPBs)
The observation of radio scintillations at stations in proximity to the magnetic equator revealed different seasonal behavior at different longitudes (Basu & Basu 1981;Aarons 1982, 1993;Tsunoda 1985 and references therein). In South America, for example, strong scintillations occurred frequently around December solstices, whereas they rarely occurred around June solstices. The opposite annual behavior was observed in the Asian sector. The electron density irregularities in the topside ionosphere also showed similar seasonal behavior (Hanson & Sanatani 1971;Basu et al. 1976;Burke et al. 1979). Because EPBs are the primary source of scintillations and electron density irregularities in the equatorial region, these observations illustrate the seasonal and longitudinal behavior of EPBs.
The ground-based scintillation observations and early satellite detection of irregularities provided only partial information about EPB behavior because scintillation observations were not available over the ocean and satellite observations were only made for limited periods. The global morphology of irregularities (or EPBs) and their seasonal variation were first derived from a topside sounding experiment by the Ionosphere Sounding Satellite b (ISS-b) (Maruyama & Matuura 1984). ISS-b had a nearly circular orbit at an altitude of around 1,100 km, with an inclination angle of 70°. Although the ISS-b altitude was quite high for the detection of EPBs, the EPB distributions derived from the ISS-b observations from April 1978 to December 1980 (around the solar maximum) are similar to those derived from other satellite observations at lower altitudes (Watanabe & Oya 1986;Kil & Heelis 1998;McClure et al. 1998;Burke 2004;Henderson et al. 2005;Stolle et al. 2006;Su et al. 2006;Kil et al. 2009;Park et al. 2009;Gentile et al. 2011;Huang et al. 2014;Smith & Heelis 2018;Wan et al. 2018;Yizengaw & Groves 2018;Aa et al. 2019).
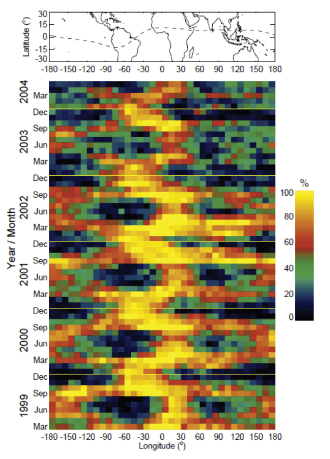
Fig. 2 shows the distribution of irregularities as a function of longitude and month derived from the measurements of the plasma density by ROCSAT-1 from March 1999 to June 2004 (Kil et al. 2009). ROCSAT-1 orbits were near circular at an altitude of 600 km, with an orbital inclination of 35°. Irregularities were detected by using a parameter similar to S, but the occurrence probability of irregularities was derived by smoothing the parameter for 100 data points. The occurrence of irregularities was determined when the ROCSAT-1 observations were available within ±10° dip latitudes and 20:00–00:00 local solar time (LT). These latitude and LT intervals were chosen because EPBs develop near the magnetic equator and preferentially at premidnight. The solar activity was maximum around 2001 and started to decline beginning in 2003. The occurrence rate of irregularities decreased as the solar activity declined. Irregularities occurred most frequently in the African sector (0°–30°E longitude) in most months. In the South American sector (90°–30°W longitude), irregularities occurred frequently around December solstices, but they rarely occurred around June solstices. In the Asian sector (around 150°E longitude), irregularities rarely occurred around December solstices. The recurrence of a similar pattern year after year indicates the systematic seasonal and longitudinal behavior of EPBs. The EPB distribution shown in Fig. 2 is the representative EPB climatology identified from many other observations. When we discuss the EPB climatology, the main interest is the seasonal and longitudinal pattern. Because the occurrence probability depends on the detection parameter, detection threshold, and calculation method of the probability, values found in different reports are not directly comparable.
3. DRIVERS OF THE NIGHTTIME EQUATORIAL PLASMA BUBBLE (EPB) CLIMATOLOGY
Just after sunset, the formation of a steep vertical plasma density gradient at the bottomside of the F region, the vertical motion of the ionosphere, and the reduction of E region plasma density provide favorable conditions for the development of EPBs at the magnetic equator by the generalized Rayleigh-Taylor (GRT) instability. Two essential elements for the development of EPBs under these conditions are initial seed perturbations on the bottomside of the F region and the growth of these perturbations. The seasonal and longitudinal behavior of EPBs appear to be determined by a combination of these two factors. However, their relative significance is difficult to identify because information on both factors is not available most of the time. This is in part because observations of the atmosphere and ionosphere at the bottomside height (below an altitude of 300 km) are rare. Also, the calculation of the growth rate of the GRT instability requires simultaneous observations of many atmospheric and ionospheric parameters.
Atmospheric gravity waves (AGWs) have long been suspected as the source of initial seed perturbations for EPBs (Whitehead 1971;Röttger 1973, 1976, 1982;Beer 1974;McClure et al. 1998;Makela et al. 2010;Tsunoda 2010;Huang et al. 2013a;Abdu et al. 2015). AGWs derive the up and down motions of plasma along magnetic field lines by neutral-plasma collisions that result in the modulation of plasma density. The changes in the neutral composition and temperature at a given height by AGWs also affect the plasma density. When the phase velocity of AGWs matches the horizontal plasma drift velocity (spatial resonance), the density perturbations produced by AGWs persist (Whitehead 1971;Klostermeyer 1978;Huang & Kelley 2009). In addition, the electric fields generated by neutral winds accompanying AGWs can affect the ionospheric dynamics and, consequently, the generation of EPBs. The important role of AGWs in the generation of EPBs has been emphasized, but there is still no good way to trace the propagation of AGWs from lower atmosphere to the bottomside of the F region. For this reason, the presence of AGWs is inferred from the observations of wave-like modulations in the ionospheric height or plasma density (Singh et al. 1997;Kelley et al. 1981;Tsunoda & White 1981;Thampi et al. 2009;Tsunoda 2010).
The observations of the ionosphere by the 50 MHz incoherent backscatter radar at Jicamarca in Peru (12.0°S, 76.9°W) show the development of EPBs in the presence of large-scale modulations of the bottomside F region. The radar detects the backscatter echoes from thermal fluctuations of electrons, but electron density irregularities of 3-m scale produce strong echoes. The wave-like modulation of strong echoes (dark structures) in the backscatter maps in Kelley et al. (1981) represents the unstable bottomside F layer. The vertically extended and tilted backscatter plumes are the signatures of EPBs. During four consecutive days, from 19 to 22 March, the modulation of the bottomside F region was most significant on 21 March, which was also when the most intense EPBs were detected. These observations were interpreted as evidence of the role of AGWs in the generation of EPBs.
The existence of AGWs is also inferred from EPB spacing. Series of EPBs in satellite observations (Singh et al. 1997;Huang et al. 2013a) and airglow images (Takahashi et al. 2009;Makela et al. 2010) often appear to be spatially quasiperiodic. The measurements of ion density by the Communication/Navigation Outage Forecasting System satellite on two days in April 2012 are shown in Fig. 3 (Huang et al. 2013a). EPBs are indicated with yellow shading. Huang et al. (2013a) hypothesized that spatially periodic EPBs could be generated by temporal periodicity of seeding AGWs; EPBs appear to be spatially periodic, if EPBs continuously develop at the sunset terminator in the presence of AGWs. Following this hypothesis, a few tens-of-minutes periods of AGWs produce several-hundred-kilometer distances between EPBs. However, Choi et al. (2016) showed that the manner in which EPBs occur in satellite observations is not represented by waves in general, because spacing between EPBs is not represented by a specific wave. Although a series of EPBs appears to be periodic, their spatial distribution is represented by many wave components. Radar observations in Kelley et al. (1981) show the development of multiple EPBs from one side of a wave-like modulation. Because the generation of EPBs is not limited to the crest locations of a wave, the characteristic of AGWs is difficult to identify from the EPB spacing.

The wave-like modulation of the bottomside F region before the development of EPBs has been given different names: large-scale wave structure (LSWS) (Tsunoda 2010;Tsunoda et al. 2010) and bottomtype layer (Hysell et al. 2005). These phenomena can be understood in terms of AGWs, but the modulations in the ionosphere can also be produced by the Kelvin-Helmholtz instability in the presence of the shear in the zonal plasma motion (Hysell et al. 2005). Traveling ionospheric disturbances can also be the source of seed perturbations (Krall et al. 2011;Yokoyama et al. 2011a, b;Taori et al. 2015;Takahashi et al. 2018). The seeding mechanism of the bottomside F region is still an open question. The main drawback in the study of the seeding mechanism is the lack of the observations of the ionosphere and atmosphere at the height of the bottomside F region. Therefore, the interpretation of the EPB climatology by seed perturbations is limited.
AGWs can provide seed perturbations in the bottomside of the F region, but the perturbations can grow to EPBs when they are amplified by the GRT instability. The linear growth rate of the GRT instability (γGRT) (Zalesak et al. 1982;Sultan 1996) is given as
and are flux-tube integrated Pedersen conductivities in the E and F regions, respectively. VP is the flux-tube integrated plasma velocity perpendicular to the magnetic field, which is equivalent to the zonal electric field. is the Pedersen conductivity-weighted neutral winds in the radial direction. ge is an effective gravitational acceleration, and is an effective F region ion-neutral collision frequency weighted by number density along the flux tube. KF is the F region flux tube electron content height gradient. RT is the flux-tube integrated recombination rate. Among these parameters in the growth rate, the key factor that enables the development of EPBs after sunset is the reduction of in the dark by the rapid loss of molecular ions in the E region. Because is the flux-tube integrated conductivity, it is minimal when the magnetic conjugate E regions in both hemispheres are simultaneously in the dark. The simultaneity varies with season and longitude because the solar zenith angle varies with season and the magnetic declination varies with longitude. The idea that magnetic declination controls EPB activity was based on the similar seasonal and longitudinal behaviors of the sunset time at the conjugate E regions and the EPB occurrence.
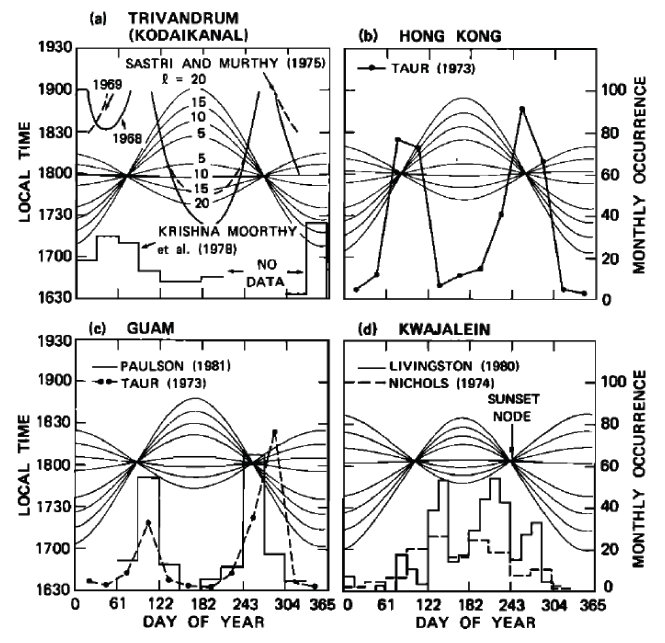
Abdu et al. (1981) reported the differences in vertical plasma motions around the sunset terminator and the occurrence of EPBs at two stations in South America where the magnetic declinations were different. These differences were consistent with the difference in the simultaneity of the sunset times at the conjugate E regions. Tsunoda (1985) calculated the annual variation of sunset times at the magnetic conjugate E regions at different longitudes and investigated its correlation with the scintillation occurrence. The calculation results at some selected locations are shown in Fig. 4. Sinusoidal curves are the sunset times at the conjugate E region for four latitudinal distances (l) from the dip equator. The nodes of the curves are formed when the LTs of the sunsets at the conjugate E regions are identical. The days of the nodes vary systematically depending on the magnetic declination and the displacement of the magnetic equator from the geographic equator. For a comparison, the plots show the scintillation data from different reports. The occurrence rates of scintillations peak around the nodes. Thus, the magnetic declination is a good indicator of the global-scale scintillation (or EPB) morphology.
An important phenomenon associated with the simultaneity of the conjugate E region sunset is the uplift of the ionosphere just before the sunset. This phenomenon, often referred to as pre-reversal enhancement (PRE) or post-sunset rise (PSSR), represents a local upward plasma motion for roughly a couple of hours around 18:00 LT before the transition of the daytime upward plasma motion to nighttime downward plasma motion. The critical role of the PRE in the generation of EPBs has been demonstrated by a range of observations (Farley et al. 1970, 1986;Abdu et al. 1981, 1992, 2006;Tsunoda & White 1981;Basu et al. 1996;Fagundes et al. 1999;Fejer et al. 1999;Anderson et al. 2004;Li et al. 2008;Su et al. 2008;Smith et al. 2015). The PRE can promote the growth of EPBs by reducing the ion-neutral collision rate, producing a steep vertical gradient in the plasma density, and increasing the F region conductivity. Therefore, PRE is recognized as the single most important parameter for the generation of EPBs. Because the generation of the PRE is determined by various E and F region parameters, including magnetic declination, and E and F region conductivities, and F region dynamo, PRE is a comprehensive parameter that represents the growth condition of EPBs.
Fig. 5 presents the maps of the (middle) EPB occurrence probability and (bottom) PRE as a function of longitude and month (Kil et al. 2009). The dashed line in the top panel indicates the magnetic equator. The EPB occurrence probability was derived by using the ROCSAT-1 data around the solar maximum (1999–2002) for Kp ≤ 3+. PRE was calculated by using the data within ±5° dip latitudes at 17:30–19:30 LT. The distributions of EPB and PRE show good agreement. On average, EPBs occur frequently at all longitudes during equinoxes. The annual variation of the EPB occurrence probability is pronounced in the Indian and American-Atlantic sectors. PRE shows a similar behavior. Therefore, a significant portion of the seasonal and longitudinal behavior of EPBs is explained by the PRE.
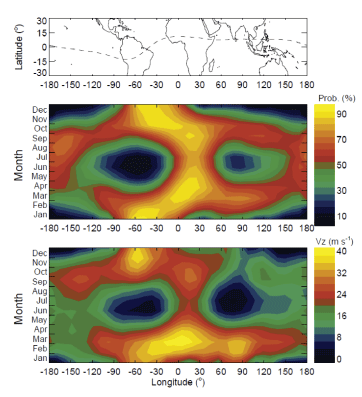
The maps in Fig. 5 provide an opportunity to examine the role of the magnetic declination in EPB and PRE generation. Their annual behaviors at 30°–60°W longitude (negative magnetic declination) show higher EPB occurrence probability and greater PRE value around the December solstice than around the June solstice. This observation is consistent with the idea that magnetic declination controls EPB and PRE. However, their annual behaviors around 90°W longitude (positive magnetic declination) are not explained by the magnetic declination. The annual distributions of EPB and PRE vary largely in 0°–120°E longitude, although the magnetic declination does not change much in this longitude region. These observations are not explained by the E region conductivity or magnetic declination. In addition to the E region conductivity, many other factors, including the F region plasma distribution, neutral winds, and background electric and magnetic fields, affect the PRE and growth rate of the GRT. The combined effect of these factors are not yet fully understood.
4. DAYTIME EQUATORIAL PLASMA BUBBLEs (EPBs)
EPBs are nighttime phenomena because photoionization after sunrise rapidly fills plasma depletions. Because of the rapid decay of EPBs in sunlight, little attention has been paid to the evolution of EPBs on the dayside. However, recent studies of daytime irregularities in the equatorial region show the persistence of EPBs even after sunrise (Huang et al. 2013b;Kil et al. 2019, 2020). The daytime irregularities noted in these studies were detected in regions where EPBs were detected on the previous night. Therefore, daytime irregularities in the equatorial region are interpreted as fossils of nighttime EPBs.
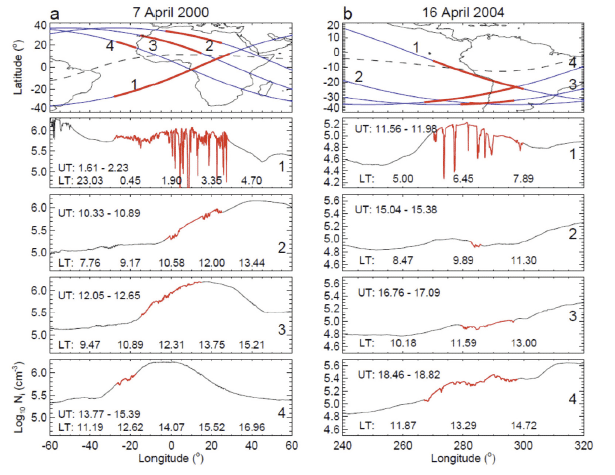
Because ROCSAT-1 had low-inclination orbits, it revisited the same longitude region several times a day. These observations enable tracing of the evolution of nighttime EPBs into the dayside. In the ROCSAT-1 observations in Fig. 6 (Kil et al. 2019), small amplitude irregularities are detected on the dayside along the satellite orbits (2, 3, and 4). Irregularity locations are indicated by red in the satellite orbits. The observations on the previous nights (orbit 1) reveal the development of strong EPBs at postmidnight at the longitudes where daytime irregularities were detected. The connection of daytime irregularities to nighttime EPBs is further supported by the similar seasonal and longitudinal behavior of the nighttime and daytime irregularities (Kil et al. 2020).
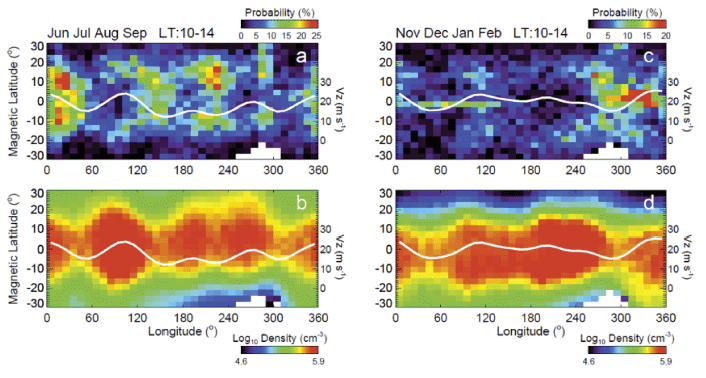
A distinguishing characteristic of daytime irregularities is their latitudinal distribution. Nighttime irregularities are concentrated near the magnetic equator, but the concentration of daytime irregularities moves from the magnetic equator to high latitudes with time (Kil et al. 2019). This behavior is attributed to the vertical motion of the ionosphere on the dayside; the vertical motion induces the transport of the fossil EPBs at the magnetic equator to higher latitudes, as if equatorial plasma is latitudinally redistributed by the fountain effect. The role of the fountain effect in the evolution of daytime irregularities is further manifested by the longitudinal distribution of daytime irregularities. Fig. 7 shows the longitudinal distributions of daytime (10:00– 14:00 LT) irregularities and plasma density for two seasons derived from the ROCSAT-1 data in 1999–2004: (a, b) June– September, (c, d) November–February (Kil et al. 2020). The white lines in the plots are the vertical ion velocity. June– September is the period during which longitudinal wave number 4 pattern develops in the plasma density and vertical plasma motion by nonmigrating zonal wave number 3 tide. The wave number 4 pattern is identified from the daytime irregularity distribution and from the plasma density in June– September. The morphologies of the daytime irregularities and plasma density are also similar in November–February. Their seasonal and longitudinal behaviors are consistent with vertical plasma motion. In addition to the latitudinal redistribution of fossil EPBs, the fountain effect can also affect the lifetime of fossil EPBs. Because the photoionization rate decreases with increasing altitude, fossil EPBs can survive longer at higher altitudes. The latitudinal redistribution also influences the fossil EPB lifetime because the variation of the solar zenith angle affects the photoionization rate.
5. CONCLUDING REMARKS
The importance of the uplift of the F region by the PRE for the generation of EPBs was demonstrated by many observations and numerical simulations. A significant portion of the EPB occurrence climatology and the dayto- day variability of EPB activity is explained in terms of the PRE. The high chance of EPB detection under a strong PRE regardless of the presence of AGWs may indicate the prevalence of seed perturbations. In that case, the role of seed perturbation is minor compared with the role of the PRE in the generation of EPBs. Seed perturbations may play a role when the growth condition of EPBs is marginal. The role of AGWs is often confined to the source of seed perturbations, but AGWs can be understood as a component of the growth condition of EPBs because AGW winds would affect the dynamo process in the E and F regions.
The characteristics of irregularities around June solstices and during solar minimum are different from those during other periods. Around June solstices and during solar minimum, small amplitude irregularities frequently occur around midnight. One of the reasons for the different behavior of the irregularities during these periods can be attributed to the different behavior of the PRE. The phenomenon of the “midnight temperature maximum” in the thermosphere has also been suggested to explain the generation of irregularities around midnight (Fang et al. 2016). In addition, the generation of equatorial irregularities by medium-scale traveling disturbances (MSTIDs) is worth investigating. Because MSTIDs preferentially develop near midnight and around June solstices and during solar minimum, some of the irregularities during these periods may be associated with MSTIDs.
The morphology of daytime irregularities indicates the latitudinal redistribution of fossil EPBs by the fountain effect. In addition to the latitudinal redistribution, the fountain effect affects the lifetime of fossil EPBs by transporting them to higher altitudes and higher latitudes. EPBs can survive longer at higher altitudes and at higher latitudes because the production rate decreases under these conditions. Numerical simulations are desired for the evaluation of this hypothesis.