1. INTRODUCTION
Auroras, occasionally referred to as polar lights or northern (Aurora Borealis) and southern lights (Aurora Australis), are luminous phenomena appearing in the polar upper atmosphere in the forms of arcs, bands, coronas, curtains and faint glow mostly in green and red colors but also in various different colors such as blue, yellow, pink and ultraviolet/infrared at the bottom of the auroral display. Although it has been observed and studied for many decades - perhaps, for many centuries - even before the space research began (Schröder 1979;Eather 1980;Akasofu 1981;Elphinstone et al. 1996;Stephenson et al. 2004), the physical processes behind the phenomena have only recently begun to be understood and new auroral phenomena also continue to appear as the observational capability is vastly improved and expanded from both the ground and the space. Furthermore, the aurora is not a stand-alone phenomenon but accompanied by various changes in the ionosphere and magnetosphere, which are far from being understood well (Heelis 1982;Newell et al. 2001;Akasofu 2015;Lu et al. 2016;Karlsson et al. 2020).
The auroral phenomena in the polar upper atmosphere occur with various spatial and temporal scales and structures depending on where and when they are observed. Typically, the aurora can be categorized into diffuse and discrete auroras (Akasofu 1974;Newell et al. 2009;Karlsson et al. 2020;Nishimura et al. 2020). Diffuse aurora is a broad and often featureless glow produced by electrons and protons lost into the upper atmosphere by the pitch-angle scattering of the particles due to resonant wave-particle interactions in the magnetosphere. Discrete aurora, on the other hand, is a bright and dynamic glow in the forms of arcs or vertical curtains produced by energetic electrons that are accelerated downward from the magnetosphere by electric fields parallel to the magnetic field. The origin of the auroral particles seems to be explained by physical processes in the magnetosphere such as wave-particle interactions and electron acceleration by electric fields (Newell et al. 2009) but it is also known to be strongly associated with the state of the ionosphere, which may explain the variations of the aurora with season and solar activity (Swift 1981;Elphinstone et al. 1996;Newell et al. 1996;Borovsky 1998;Newell et al. 2001;Newell et al. 2010).
The aurora is a phenomenon occurring over the entire auroral oval and in the polar cap and cusp regions with significant temporal and spatial variations in the highlatitude upper atmosphere. Therefore, it is not possible to observe the whole picture of the aurora from a single ground station but requires simultaneous observations from multiple stations distributed over the entire polar region or space-based observations. Furthermore, the opposite day-night condition in the northern and southern hemispheres prevents conducting simultaneous ground observations of the aurora for the interhemispheric study of the phenomena. One good example of the collaborative auroral observations from the ground and space is the Time History of Events and Macroscale Interactions during Substorms (THEMIS) project that was aimed to investigate magnetospheric substorm phenomena by using five insitu satellites and ground-based 20 all-sky imagers and 30 magnetometers (Donovan et al. 2006;Angelopoulos 2008;Mende et al. 2008). The THEMIS ground all-sky imager network consists of 20 stations located along the auroral oval to simultaneously observe the auroras over the North American continent, which allows monitoring the temporal and spatial evolutions of the auroral substorm events over an extended portion of the auroral oval. There is also a similar satellite mission called Arase [also known as Exploration of energization and Radiation in Geospace (ERG)] developed by the institute of Space and Astronautical Science of the Japan Aerospace Exploration Agency (JAXA). Shiokawa et al. (2020) reported the simultaneous observational results from Arase satellite and ground instruments at Nain, Canada to investigate auroral arcs or diffuse auroras and the characteristics of their source plasma and fields in the magnetosphere. Ozaki et al. (2018) studied the detailed spatiotemporal characteristics of pulsating auroras by the coordinated observations between the Arase satellite and the ground-based network for dynamical variations of particles and waves in the inner magnetosphere.
However, such auroral observations require extensive resources such as funding and organizations participated in the observations and long-term routine monitoring of aurora may not be economically or logistically feasible. In addition to these ground-space coordinated campaign observations, a routine single-site observation could still be useful especially in the southern hemisphere where the ground stations are sparse. In particular, it would be much more useful with the auroral observations accompanied by other simultaneous observations for the upper atmosphere and the magnetosphere at the observation site. Historically, the ground-based auroral observations have been performed mostly in the northern hemisphere (Syrjäsuo & Donovan 2004;Sangalli et al. 2011;Rao et al. 2014;Yang et al. 2021), explaining why the aurora was initially called a northern light, but relatively few observations in the southern hemisphere mainly due to the limited accessibility to the region. The auroral observations in the southern hemisphere are mostly performed in the sparsely distributed Antarctic stations in the coastal line of East Antarctica. In the meanwhile, there are only a few stations in West Antarctica, which includes the US McMurdo station (and New Zealand Scott base) and the Italian Mario Zucchelli station near the Ross Sea in the westside of the transantarctic mountains (TAM). Rather recently, a new station was added to the West Antarctica by Korea Polar Research Institute (KOPRI) near the Italian station in 2014, which is called the Jang Bogo Station (JBS). KOPRI and their collaborators have launched various observations related to the aurora and the polar upper atmosphere since the station was established. These include a Fabry-Perot Interferometer (FPI) for the thermosphere, Vertical Incidence Ionospheric Radar (VIPIR) and GPS TEC/scintillation monitor for the ionosphere, magnetometers for the magnetosphere, All Sky Cameras (ASCs) for airglow emissions and aurora, and neutron monitor for cosmic rays (Kim et al. 2018;Kwon et al. 2018;Ham et al. 2020). In the present study, the auroral observation by the v-ASC will be introduced with the image analysis procedure to recognize the aurora from the observed image data, as well as the initial results on the temporal and spatial characteristics of the auroral occurrence over the station for the last three years (2018– 2020). In the following sections, the characteristics of the auroral observations will be described in terms of the location of the station with respect to the auroral oval and the polar cap. The results of the study will be then presented.
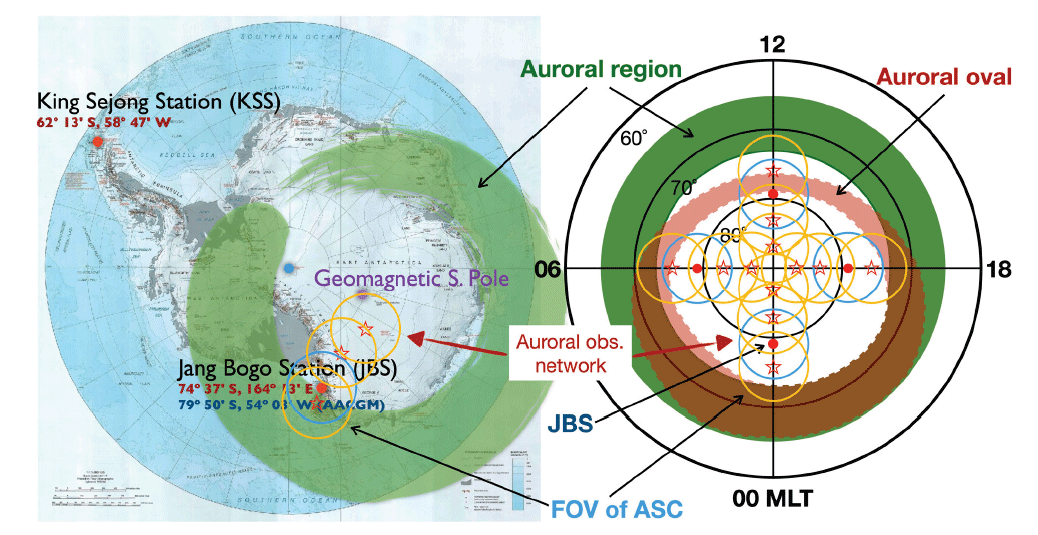
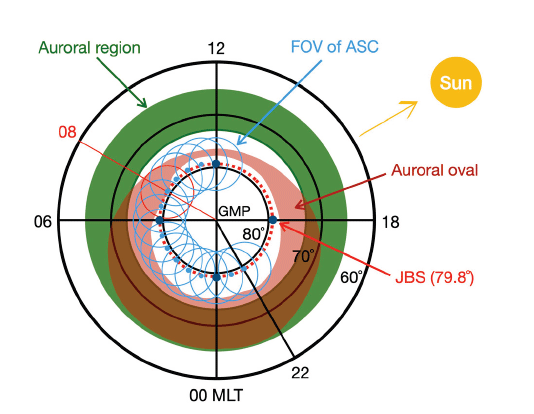
2. LOCATION OF Jang Bogo Station (JBS) WITH RESPECT TO THE AURORAL OVAL
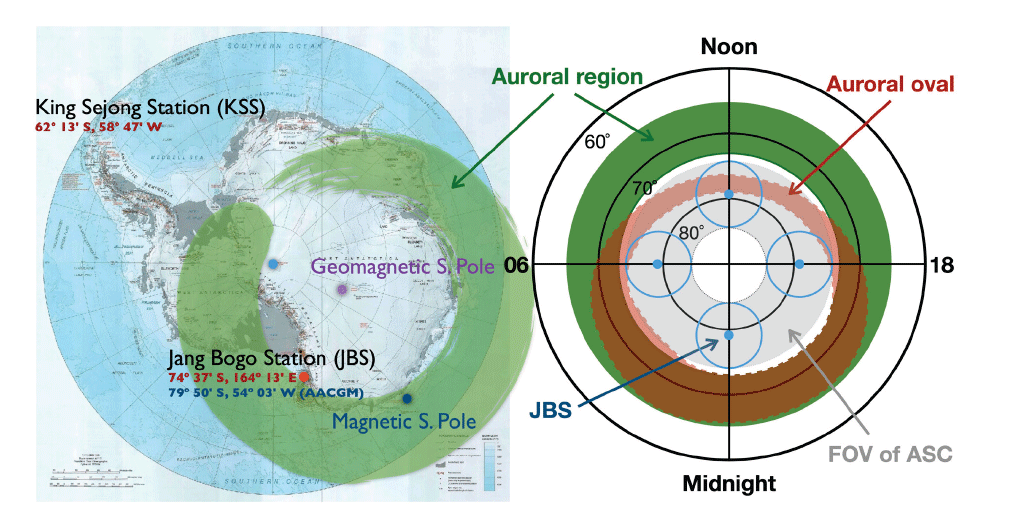
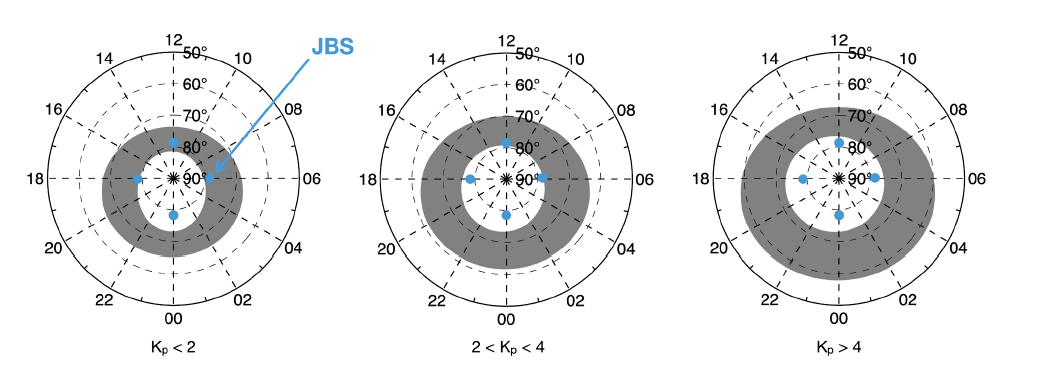
Aurora is known to generally occur in the auroral oval (or the auroral zone) but also occurs in the polar cap and cusp regions. The auroral oval is the upper atmospheric footprint of the boundary region between the open geomagnetic field lines, stretched out to the magnetotail and eventually to the solar wind, and the closed field lines forming a dipole field at lower latitude. The boundary region is connected to the plasma sheet on the nightside and the cusp on the dayside in the magnetosphere. The auroral oval itself is connected to the closed field lines on the nightside, which maps into the plasma sheet in the equatorial magnetosphere. In other words, the auroral oval is the region of a mapping of the magnetosphere onto the upper atmosphere. Another commonly used term for the region of the auroral occurrence is the auroral zone, which is a circumpolar region with the width of about 5° to 10° in latitude around the geomagnetic poles. However, the auroral zone does not necessarily represent the region of the auroral occurrence at a moment of time but it generally refers to the region in which one can expect to observe the aurora when it occurs usually during nighttime (Akasofu 1981; Akasofu 2007; Milan et al. 2009;Feldstein 2016). The dayside of the auroral oval is connected to the cusp region of the magnetosphere where the magnetosheath plasma has direct access to the upper atmosphere. The region poleward of the auroral oval is the polar cap in which the field lines are open to the solar wind and directly connected with the interplanetary magnetic field (IMF). The center of the auroral oval is displaced toward the midnight sector by about 3°–5° in latitude from the geomagnetic pole. The auroral oval is fixed with respect to the direction towards the Sun and the Earth rotates under the oval. Its spatial extent around the geomagnetic pole has a dynamic characteristic with magnetic local time (MLT) and magnetic activity. Overall, both the equatorward and poleward boundaries of the oval expand equatorward as the magnetic activity increases except for the poleward boundary near the magnetic local noon and midnight which hardly varies with magnetic activity (Xiong et al. 2014;Feldstein 2016;Wagner & Neuhäuser 2019).
Considering the spatiotemporal characteristics of the auroral oval, JBS seems to be located mostly in the polar cap during the nighttime, close to the poleward boundary of the auroral oval at dawn and dusk, and near the polar cusp region at magnetic local noon as shown in Fig. 1, allowing us to observe the aurora in the various regions of the polar ionosphere. Fig. 2 shows the auroral oval varying with magnetic activity and the corresponding locations of JBS. The relative locations of JBS with regard to the auroral oval are presented from quiet to moderately disturbed conditions using the variations of the auroral oval adopted from Xiong et al. (2014). In fact, the spatial and temporal distributions of the auroral oval may reflect the states of the magnetosphere being compressed by solar wind on the dayside but extended along with the solar wind streams on the nightside. It is located around the geomagnetic pole (but shifted toward the nightside) and the latitudinal ranges are relatively narrow about 5° around 80° magnetic latitude (MLAT) near the magnetic noon but much wider existing at about 65°–75° MLAT on the nightside during quiet periods. As the magnetic activity increases or substorms occur it expands to lower latitudes with broader latitudinal ranges of about 70°–80° MLAT at magnetic noon and 60°–75° MLAT near the magnetic midnight. Note that the poleward boundary of the auroral oval near the midnight shows almost no dependence on the magnetic activity, while the equatorward boundary tends to expand equatorward with increasing activity. It can be assumed from these variations of the auroral oval that JBS at about 79.8° MLAT is mostly located near the poleward boundary of the auroral oval. The MLAT and the MLT for this study is computed from the Altitude-adjusted corrected geomagnetic (AACGM) coordinates (Shepherd 2014). Please refer to review papers on the auroral oval for more details (Eather 1973;Feldstein 2016).
3. AURORAL EVENTS OBSERVED AT Jang Bogo Station (JBS)
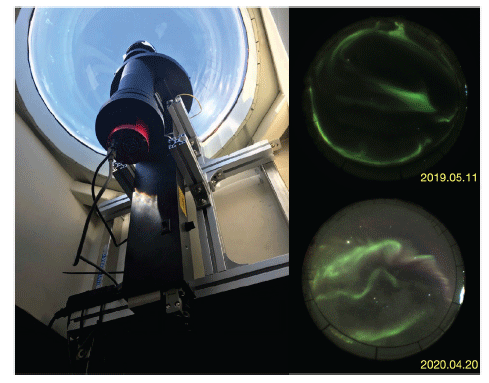
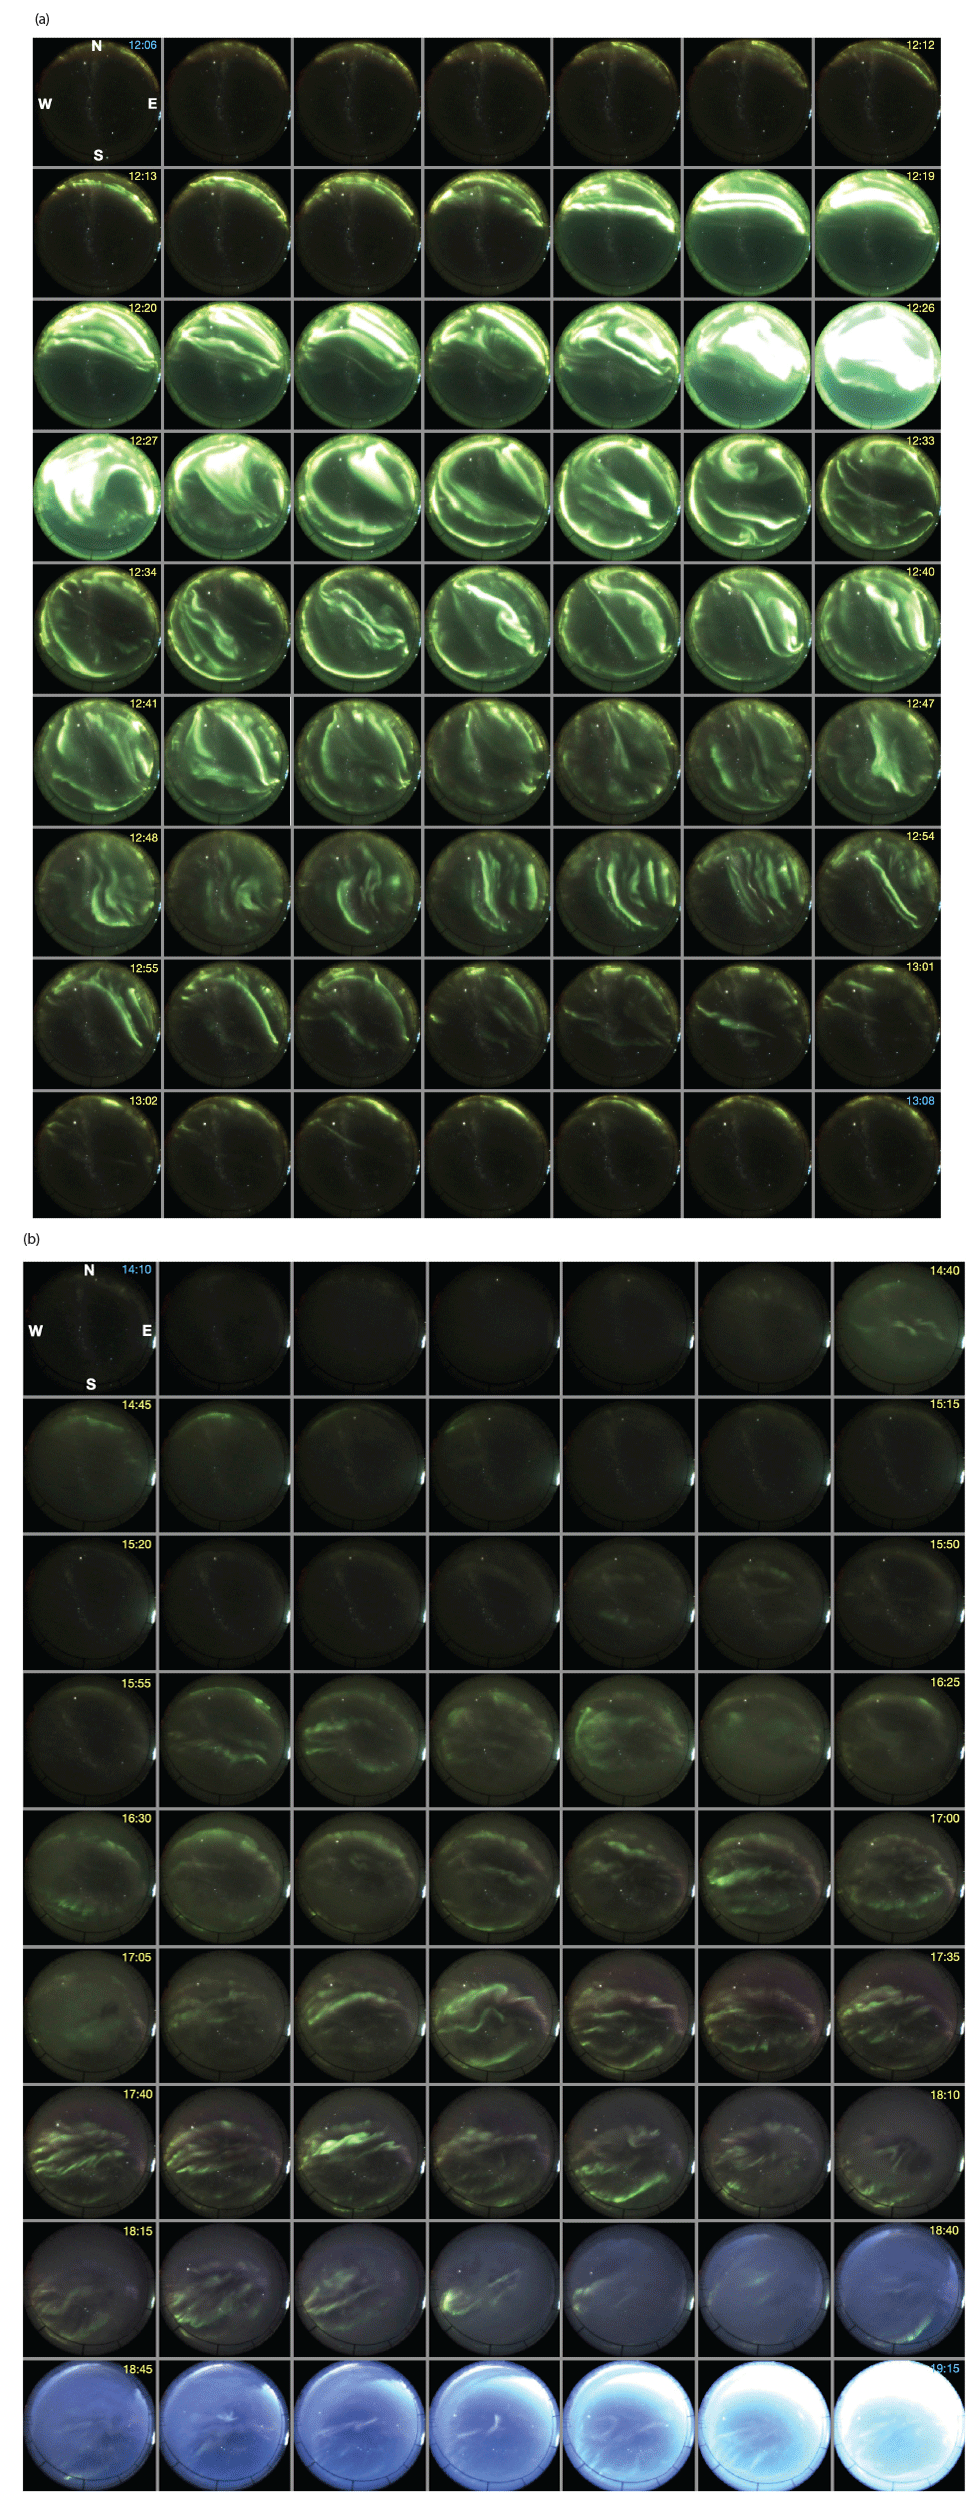
With these characteristics of JBS in relation to the auroral oval, the auroral observation by the v-ASC has been started in March 2018 to routinely monitor the aurora in the visible portion of the spectrum. There have been a few visible auroral observations in the northern polar region (Rao et al. 2014) but it is the first visible auroral observation in the southern polar region. Fig. 3 shows the v-ASC and its sample images on May 11, 2019 (top) and April 20, 2020 (bottom). The v-ASC developed by Keo Scientific (Calgary, AB, Canada) has a full 180 degrees field of view and 3-inch telecentric optics with fast f/0.95 re-imaging onto a ZWO ASI174MC thermoelectrically cooled camera head. The camera’s sensor is a Sony IMX174 color CMOS sensor with global shutter. The v-ASC has been collecting auroral images with 1-min intervals with 5-sec exposure time during nighttime but the exposure time was increased to 10 seconds on June 3, 2020 to enhance the intensity of the captured auroral images. Fig. 4(a) shows the auroral images with 1-min. interval from 12:06 UT (top-left) to 13:08 UT (bottom-right) during the auroral substorm associated with the arrival of the coronal mass ejection on May 11, 2019. It began to appear in the north-eastern horizon (top-right of the sky disk), expanded to the zenithal direction (i.e., southward), and peaked at around 12:26 UT, filling almost the entire sky disk over JBS with the auroral emissions and then gradually subsiding for about half an hour. The entire event seems to last less than an hour. Note that the auroral images are presented in the geomagnetic orientation as indicated at the top-left panel of Fig. 4. The auroral event on April 20, 2020 shown in Fig. 4(b) was quite different. Not only does the event show a different morphology and intensity of the aurora but it also lasts much longer, for about three hours, and continues to exist even after the sunrise. The geomagnetic activities for the auroral events are Kp = 4 – 5 for the 2019 event and Kp = 2 – 4 for the 2020 event, which is relatively moderately disturbed conditions. During the auroral events in Fig. 4, the sky disk over JBS is fully filled with auroral emissions, which indicates that the aurora occurred in the zenithal direction of the JBS. This implies that the location of JBS must be within the auroral oval during the events. The relative location of JBS in relation to the auroral oval will be discussed further with the auroral occurrence in Section 5. The occurrence times of the events are 12-13 UT (i.e., 23-24 LT or 04-05 MLT) for the 2019 event and 14-19 UT (i.e., 01-07 LT or 06-12 MLT) for the 2020 event. During these local times (LTs), the location of the JBS is very close to or within the auroral oval as will be shown later in Fig. 12.
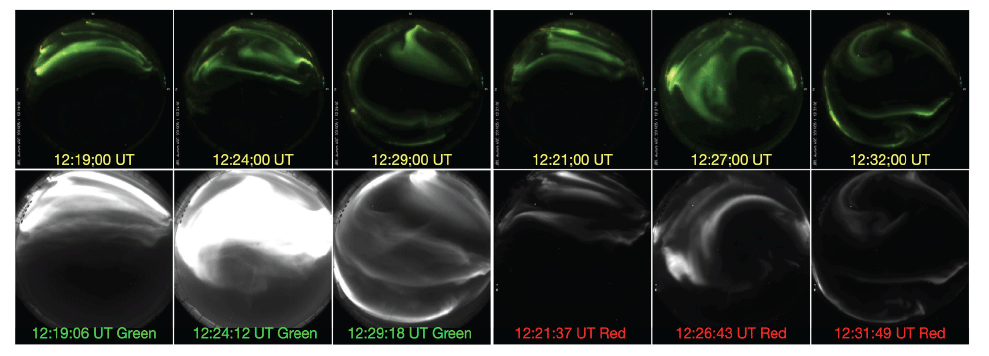
Note that the aurora on May 11, 2019 appears purely green but reddish on April 20, 2020 in the middle of the event (also shown in Fig. 3). Does it mean that the 2019 event occurred only with green emission at the location of JBS? The auroral images at 6 different UTs from the v-ASC were compared with the images nearly simultaneously taken from the airglow all-sky imager at JBS with green (557.7 nm) and red (630.0 nm) line filters in Fig. 5. As expected, the overall morphology in the green line images from the airglow imager is very similar to the corresponding v-ASC images but the ‘red’ line images are also close to the corresponding v-ASC images. This comparison indicates that although the auroral images appear green in the visible frequency range, there must be red aurora at higher altitudes, merely not being captured by the camera probably due to the relatively low intensity at higher altitudes. In other words, this result implies that the green aurora at lower altitudes is usually accompanied by the red aurora at higher altitudes. The auroral electrons collide with atmospheric constituents to excite (or ionize) them throughout their passage in the upper atmosphere along the geomagnetic field lines and cause the green and red auroral emissions simultaneously in the ionosphere although it largely appears green from the ground observations.
4. AURORA RECOGNITION PROCEDURES
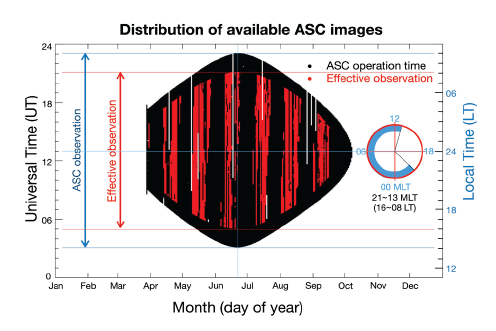
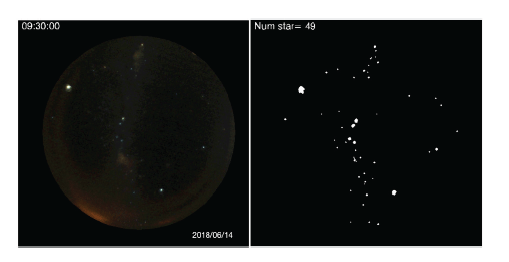
Fig. 6 shows the data distribution of the v-ASC observations during the nighttime condition in 2018. Note that 12:00 UT corresponds to 23:00 LT (~04:00 MLT) at JBS. The data coverage is maximized in winter around the June solstice but no data in summer around the December solstice. In the magnetic coordinate, the temporal coverage of the auroral observations at JBS ranges from late evening (21 MLT) to the local noon (13 MLT), enabling us to observe the cusp aurora when it is available. The data used for this analysis are selected under the following criteria for the sun and moon: elevation of the sun < –15°, elevation of the moon < 5°, and moon phase < 0.25. For the selection of clear nights, the number of stars is counted from the B-channel images among the RGB channels. It is assumed to be clear when the number of stars in the observed images is greater than 30 as shown in Fig. 7. The 2D FFT is applied in this process to reduce noise from the images. The resulting effective data coverage is shown as the red-shaded area in Fig. 6. The selected images for clear nights from the process are used for the ensuing procedure to remove light contaminations in the back ground and to recognize the aurora in the observed images.
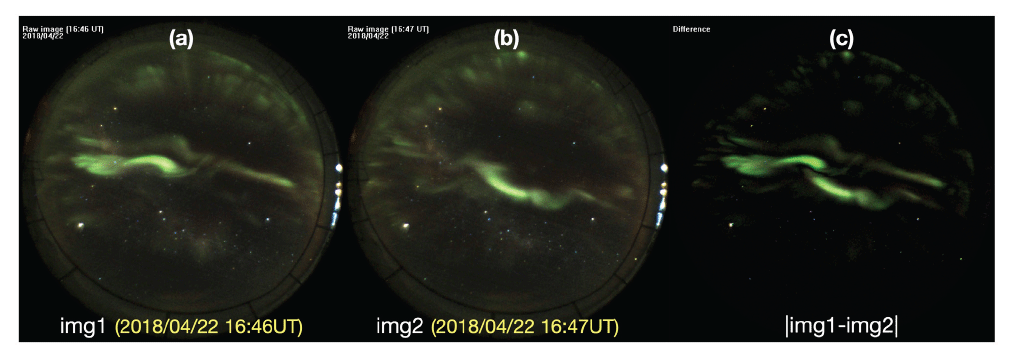
There are a number of light sources to contaminate the observed auroral images such as moon, stars, Milky Way, and lights from the JBS station, which needs to be removed to recognize the aurora. The moon light, the brightest contaminating light, can be removed by excluding the images with the moon visible in the night sky from the criteria of the elevation and the phase described earlier. The other light contamination sources include the Milky Way, stars and planets, and various background lights from the station or electronics under the dome within the observation hut. These contaminating light sources are removed by subtracting two consecutive images with a 1-min. interval as presented in Figs. 8(a)–8(c) since the aurora are assumed to vary within the interval while the contaminating light sources are stationary. The resulting image in Fig. 8(c) displays the auroral form combined by the two consecutive auroral images [Figs. 8(a) and 8(b)]. However, note that the stationary parts of the auroral emissions for the 1-min. interval are inevitably removed in the resulting image, which is a clear limitation of the procedure affecting the result of the occurrence of the aurora.
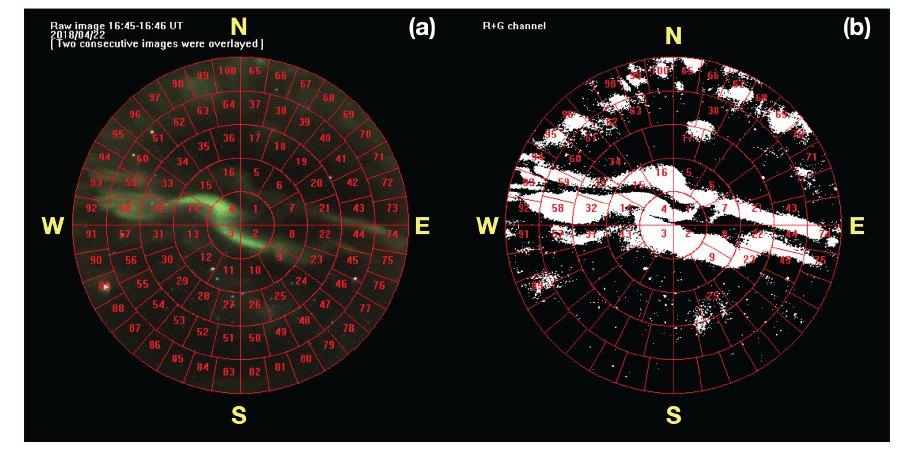
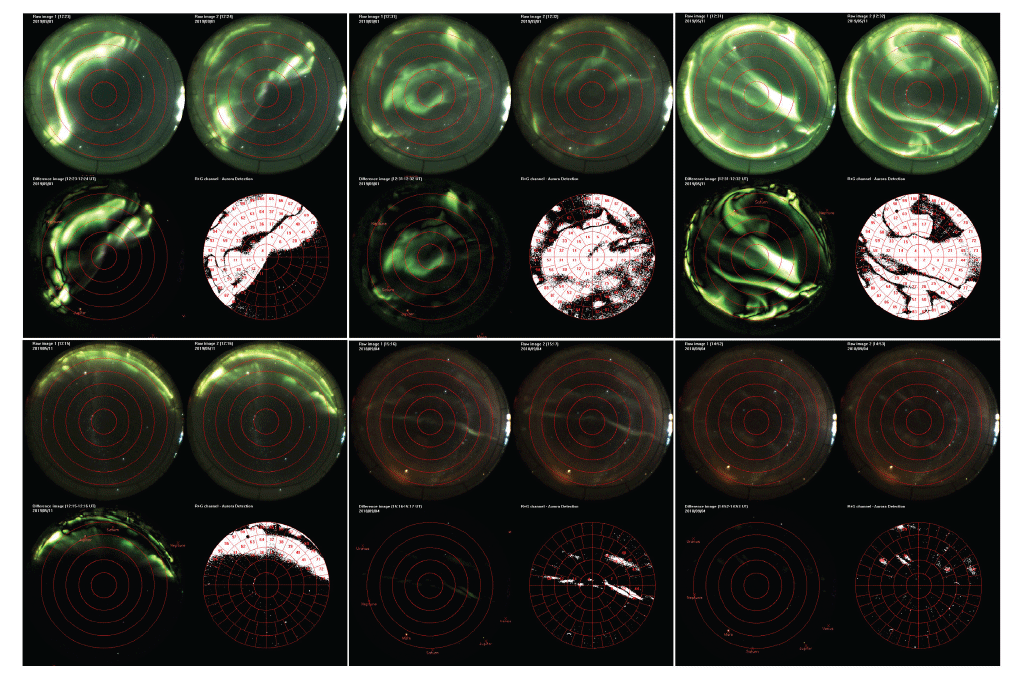
In order to investigate the auroral occurrence at JBS from the observed all-sky images, the sky disk over JBS with an elevation angle greater than 20° is divided into 100 equal-area cells as shown in Fig. 9(a) (Beckers & Beckers 2012). Fig. 9(b) shows the image produced from the R- and G-channel images of the CCD camera sensor for auroral images. The auroral occurrences are determined for each cell by the ratio of the number of pixels with auroral emissions to the total number of pixels within the cell from the R- and G-channel images as shown in Fig. 9(b). If the ratio is greater than or equal to 0.1 (i.e., 10% of the total pixels within a cell), it is identified as the ‘auroral’ cells in which the cell numbers appeared in Fig. 9(b). More sample images of the auroral occurrences are presented in Fig. 10 for various types of the observed aurora. It should be noted that no distinction between diffuse and discrete aurora (or any other types of aurora) was made in the above processes to compute the auroral occurrence.
5. TEMPORAL AND SPATIAL DISTRIBUTIONS OF THE AURORAL OCCURRENCES OVER Jang Bogo Station (JBS)
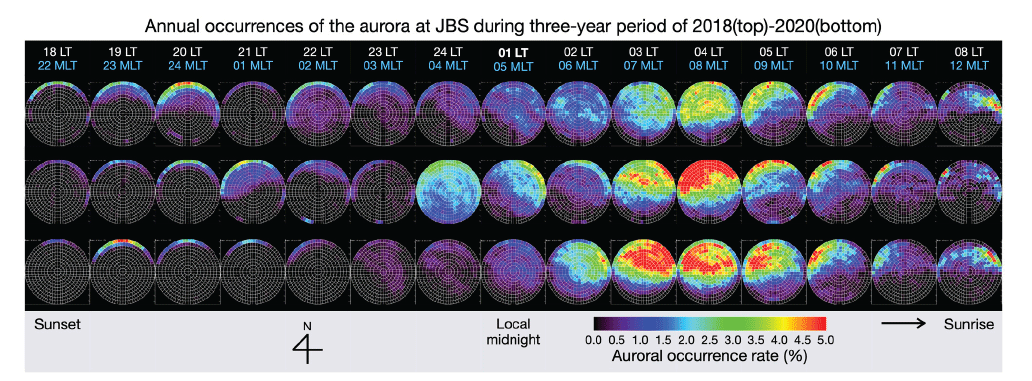
The resulting auroral occurrences during the threeyear period of 2018–2020 are presented in Fig. 11. The sky disk was expanded to lower elevation angle of 10° from 20° to cover the aurora occurring near the horizon and the number of cells within the sky disk was also increased from 100 to 400 to enhance the spatial resolution of the auroral occurrence in Fig. 11. The colors of the cells in the figure indicate the auroral occurrence rate for each 1-hour LT during a year period, which ranges from 0% (no occurrence in black) to 5% (maximum occurrence in red). For each year, the auroral occurrences are displayed for the nighttime at JBS from 22 MLT (18 LT) to 12 MLT (08 LT). Each hourly auroral occurrence represents the occurrence rate for an hour with ± 30 minutes around the specified time. Note that there is about a 4-hour difference between the solar LT and MLT. This 5-hour difference allows us to observe the aurora in the cusp region at around the magnetic local noon (12 MLT). The auroral occurrences for each year are fairly similar across the board, showing maximum auroral occurrences at around 08 MLT except for the unexpected high auroral occurrences at 04-05 MLT in 2019, presumably associated with the auroral substorm occurred at 04-05 MLT on May 11, 2019 (Fig. 4). It was found from Fig. 11 that the aurora is barely observed near the northern horizon in the evening (22~01 MLT) but the occurrence moves towards the zenith from the north-east to reach the peak at 08 MLT (04 LT), covering almost the entire sky over the JBS except for the southern horizon. Then it moves away from the zenith to the north-west (not to the north-east!) in the 09-11 MLT (05- 07 LT) sector. At around the magnetic local noon (12 MLT), the auroral occurrence is horizontally and rather narrowly distributed in the north when JBS is located near the cusp region. It can be concluded from these LT behaviors of the auroral occurrence that the JBS is located within the polar cap at night but approaches to the poleward boundary of the auroral oval near the dawn. In particular, at around 08 MLT (04 LT), the JBS must be well within the auroral oval as shown in Fig. 12.
6. SUMMARY AND FUTURE OBSERVATION PLAN
In this paper, we have introduced auroral observations by the visible all-sky camera (v-ASC) during the period of 2018–2020 at JBS, Antarctica and presented the initial results on the spatial and temporal distributions of the auroral occurrence over JBS. It was found that the auroral occurrences are mostly confined to the northern horizon in the evening and extend to the zenith near the local midnight (03-05 MLT), peaking at around 04 LT (08 MLT). At this time, the auroral occurrences cover almost the entire sky disk over JBS and then subside back to the northwest. The auroral occurrences are horizontally and narrowly distributed near the magnetic local noon in the northern sky disk, which is deemed the cusp aurora. The LT variations of the auroral occurrences indicate the relative location of JBS with respect to the auroral oval: JBS is located most of the time within the polar cap in the nightside but approaches closer to the auroral oval in the morning sector. At around 08 MLT (03 LT), JBS finally enters the auroral oval and then moves away from it at 09 MLT (05 LT). In particular, at around the magnetic local noon, JBS seems to be at the cusp region.
It turns out that the field of view (FOV) of the v-ASC observation has brought the JBS to be ideally located to observe the variabilities of the poleward boundary of the auroral oval. In order to continue the auroral observations in the auroral oval and the polar cap/cusp region in the southern hemisphere, we will expand the observation to the central part of the polar cap as well as to the auroral oval as shown in Fig. 13. Furthermore, in these new additional observation sites, the ASCs will be equipped with two filters, 557.7 nm and 630.0 nm to enhance the observation capability of the aurora.