1. INTRODUCTION
The Next Generation Small Satellite-1 (NEXTSat-1), a 100-kg-class small satellite developed by the Korea Advanced Institute of Science and Technology Satellite Technology Research Center (KAIST SaTReC), was launched on December 4, 2018 on the Falcon 9 rocket, from the Vandenberg Air Force launch site (Shin et al. 2014). The NEXTSat-1 has a sun-synchronous orbit with an altitude of 575 km and an orbital inclination angle of 97.7°. Its orbital speed is 7.57 km/s, and the orbital period is 96.17 min. Two scientific payloads are aboard the spacecraft, in addition to seven core technology payloads. The first scientific payload is the Near-infrared Imaging Spectrometer for Star formation history (NISS), and the second is the Instrument for the study of Stable/Storm-time Space (ISSS). The first month in orbit was spent checking the spacecraft systems, and the following three months were spent calibrating the scientific payloads. Consequently, normal operations of these two scientific instruments only began in April 2019. Fig. 1 shows the NEXTSat-1 spacecraft with the integrated NISS and ISSS payloads, and a detailed view of the ISSS instrument set.
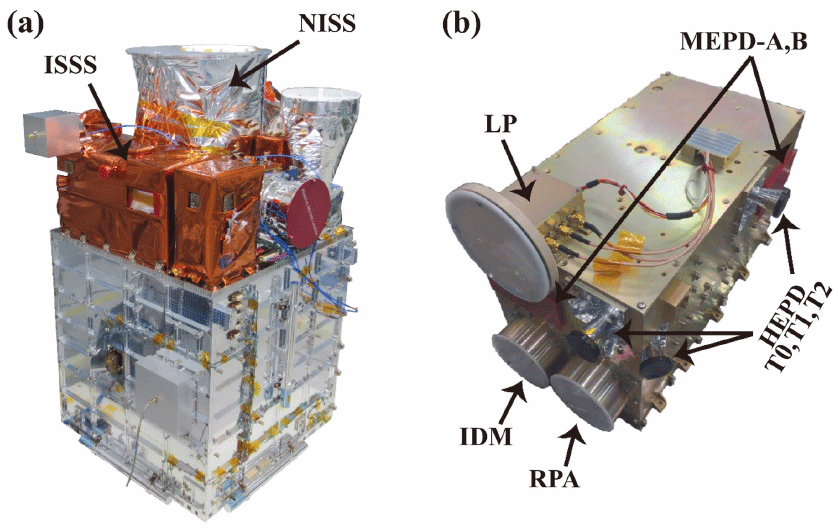
The ISSS is a space-science payload that consists of Space Radiation Detectors (SRD) and Space Plasma Detectors (SPD): SRD measure the energy and flux of medium and high-energy particles precipitating from the terrestrial radiation belts, while SPD observe disturbances in the topside ionosphere by measuring the plasma density and temperature. SRD are composed of a High-Energy Particle Detector (HEPD) and a Medium-Energy Particle Detector (MEPD). The HEPD detects electrons with energies ranging from ~350 keV to above ~2 MeV, with a time resolution of 32 Hz, and determines the pitch angle information with three telescopes that are positioned at 0°, 45°, and 90° to the local geomagnetic fields. The HEPD can also detect high-energy protons. The MEPD measures electrons, ions, and neutral atoms of ~20 to ~400 keV, with a time resolution of 1 Hz, and determines pitch angle information using two telescopes that are positioned at 0° and 90° to the local geomagnetic fields. SPD are composed of a disk-type Langmuir Probe (LP) for measuring electron density and temperature, a Retarding Potential Analyzer (RPA) for measuring ion density/ composition and temperature, and an Ion Drift Meter (IDM) for measuring ion drift. SPD have a temporal resolution of 10 Hz. Detailed information about the HEPD and MEPD can be found in Sohn et al. (2018), Choi et al. (2014), and Seo et al. (2015), respectively, while Lee et al. (2018) provides information on SPD.
The two scientific payloads, the NISS and ISSS, share orbits for their nighttime operations. Hence, the ISSS makes observations during only four orbits per day. Nominally, SRD are operated at high geomagnetic latitudes, while SPD are operated in the mid- to low-latitude regions. The observed data are downloaded to a ground station at SaTReC and preprocessed before they are distributed to users. For SRD data, the particle counts are converted into specific fluxes, and for SPD data, the appropriate fitting procedures are applied to extract physical parameters from the observed electrical signals. These preprocessed data are then combined with a variety of other information, such as the local time, universal time, geomagnetic field, and the geographic and geomagnetic longitudes and latitudes at which the observations were made. The final data files of space radiation and space plasma observations are archived separately in a hierarchical data format (HDF), with filenames that include the orbit numbers.
This paper describes the initial operations and results of observations made during the period. Section 2 briefly describes the initial operations and the subsequent preprocessing schemes, and Section 3 discusses the preliminary results of the initial space radiation and plasma observations. A short summary is given in Section 4.
2. INITIAL OPERATIONS AND PREPROCESSING SCHEMES
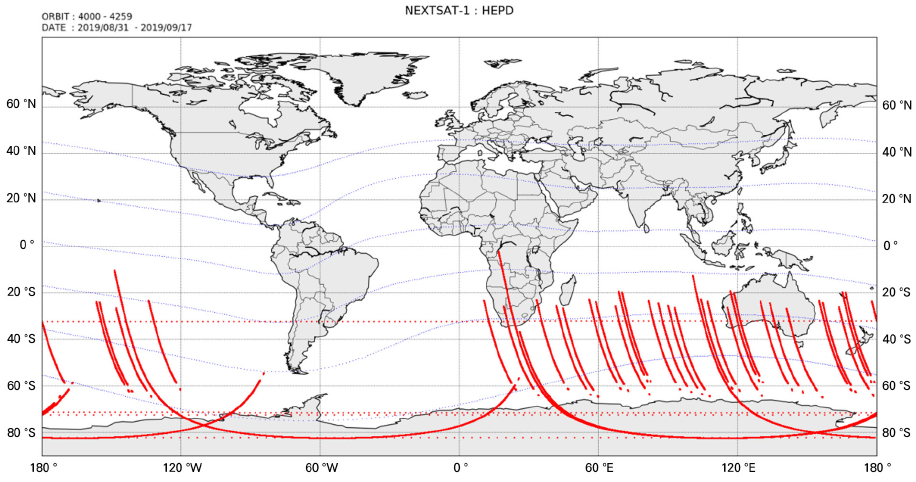
The ISSS makes space radiation observations at high latitudes and space plasma observations at mid-low latitudes. These scientific tasks are performed in the eclipse region of satellite orbits. In the initial operation period, the ISSS operated the SRD and SPD sequentially along the same path. For space radiation observations, the spacecraft attitude is controlled so that the HEPD T0 and MEPD A telescopes are aligned along geomagnetic field lines, and observe particles penetrating from the radiation belts at high latitudes (between geomagnetic latitudes of 60°S and 40°S), past the southern polar region, where the satellite enters the eclipse. During the northern winter, when the northern hemisphere is eclipse-laden, space radiation measurements are also made for ~300 s, between the geomagnetic latitudes of 40°N and 60°N. Space plasma observations are performed for ~1,400 s, between the geomagnetic latitudes of 40°S and 40°N, with the sensor faces of the SPD maintained in the ram direction. During weekdays, the ISSS is operated with four orbits a day, as the eclipse orbits are shared with the NISS, while on the weekend, only space radiation observations are performed, with five orbits a day (Jeong et al. 2014). From August 2019, the ISSS has operated the SRD and SPD on separate paths, since the duration of the SRD operation increased to 600 s. A new scenario mode has been added, whereby the SRD observe the sunlit region for ~1,800 s without attitude control, before the spacecraft enters the southern polar region. This is intended to maximize the operations, with the view that even these data may be of value in future studies. Fig. 2 shows a map of the SRD operations between August 31 and September 17, 2019 (orbit numbers 4000–4259), as an example. During this period, most of the HEPD operations were made in the region of 60°S and 40°S (in geomagnetic latitudes), although three operations were made with longer periods, corresponding to observations on the sunlit side.
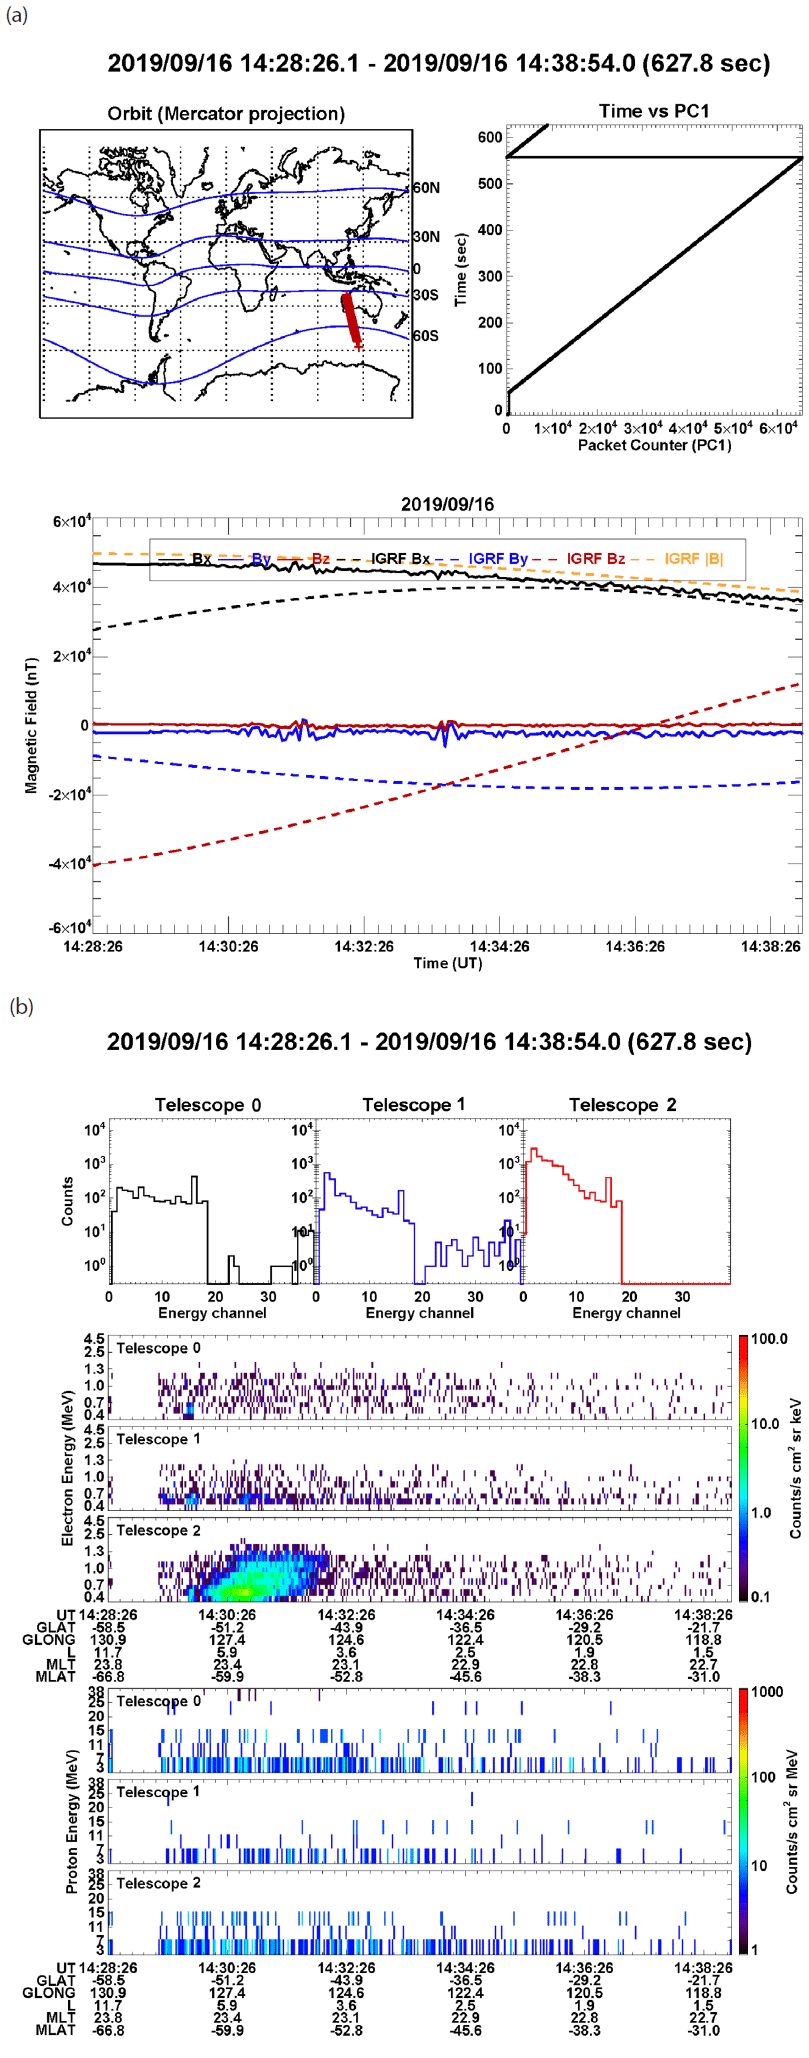
The time-tagged data of ISSS observations and the corresponding spacecraft attitude information are received at the SaTReC ground station. The raw HEPD, MEPD, and plasma data are archived in separate data files, together with the attitude information and the estimated ephemeris data. Since the ephemeris and attitude data are recorded at 3-second intervals, they are interpolated to match the time resolution of the payloads. Finally, these data files are transformed into HDF files for distribution. Quick-look plots can be made from these HDF files, before further physical analysis is conducted, and the validity of the observations is readily checked from the quick-look plots. Fig. 3 is an example of the HEPD quick-look plots. Fig. 3(a) shows the observation location on the world map with geomagnetic latitudes, the HEPD clock time plotted against the packet counts, and the observed magnetic field (Bx, By, Bz) compared with the total magnetic field (International Geomagnetic Reference Field, IGRF |B|) estimated from the IGRF model. The plot of continuous packet counts confirms that the observations were conducted without interruption. The observed magnetic field components (Bx, By, Bz) were fixed to the satellite body coordinates, while the IGRF model results (IGRF-Bx, By, Bz) were calculated in the geocentric coordinate system. In the plot of the observed geomagnetic fields, it can be seen that the By and Bz components are close to zero, while the magnitude of Bx is close to the total IGRF field, indicating that the x-direction of the spacecraft is well aligned with the local geomagnetic fields. Fig. 3(b) shows the total counts measured by each of the three telescopes during the whole observation period, as well as the time series of the electron and proton spectra observed by the three telescopes. Since Telescope 2 is perpendicular to the local geomagnetic fields, the figure shows that most observed electrons are trapped particles. Furthermore, the proton flux for the observed energy band is much smaller than the electron flux, which is the total count measured by each of the three telescopes over the entire observation period. The middle and bottom figures show time series of electron and proton spectra, respectively, measured with the three telescopes.
3. PRELIMINARY RESULTS
In order to verify the HEPD data, we compared the elec-tron data observed by the HEPD with those from the Space Environment Monitor-2 (SEM-2) and the Medium Energy Proton and Electron Detector (MEPED) instruments onboard the ESA Meteorological Operational-02 (MetOp-02) satellite of the European Organization for the Exploitation of Meteorological Satellites (EUMETSAT) (Cohen et al. 2006). MetOp is comprised of three meteorological satellites with sun-synchronous orbits at altitudes of 817 km. SEM-2 of MetOp (hereafter, MetOp-02) is one of the instruments shared with the Polar-orbiting Operational Environmental Satellite (POES) of the National Oceanic and Atmospheric Administration (NOAA). For the HEPD, we used the integrated flux measured by Telescope 2, which detects electrons with a 90° pitch angle, for the energy range of 0.98 to 2 MeV. For MetOp-02, we use the integrated flux of the P6 channel of Telescope 90. This telescope detects particles having a 90° pitch angle, and the P6 channel was designed for protons with an energy range of > 6,900 keV, but also detects electrons with energy > 700 keV as a contamination component (Rodger et al. 2010). However, since protons with energies of > 6,900 keV are rare in the space of the given orbits, unless solar proton events (SPEs) occur, the particles observed by the P6 channel of Telescope 90 are generally regarded as relativistic electrons with energy >700 keV. In fact, this can be verified by comparing the flux of the P6 channel with that of the neighboring P5 channel, which detects protons with energies from 2,500 to 6,900 keV and is not contaminated by electrons.
Fig. 4 shows the two observations made by the HEPD (left panel) and MetOp-02 (right panel) from 04:20 to 04:30 on March 9, 2019. The shaded areas in both plots correspond to the region between L = 3 and L = 7, which includes the outer radiation belt. According to the plots, MetOp-02 crossed this region a few minutes later than NEXTSat-1, and as they were moving northward across the region, the electron fluxes measured by the two instruments gradually increased and then decreased in similar ways. Furthermore, the peaks occurred at L = 4.5 (indicated by arrows) in both observations, with similar levels of ~104 counts/(cm2 · s · sr).
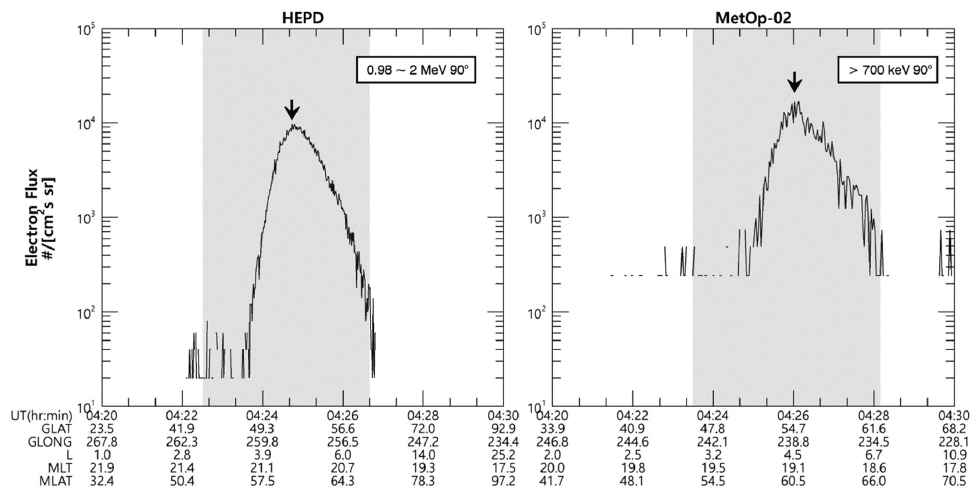
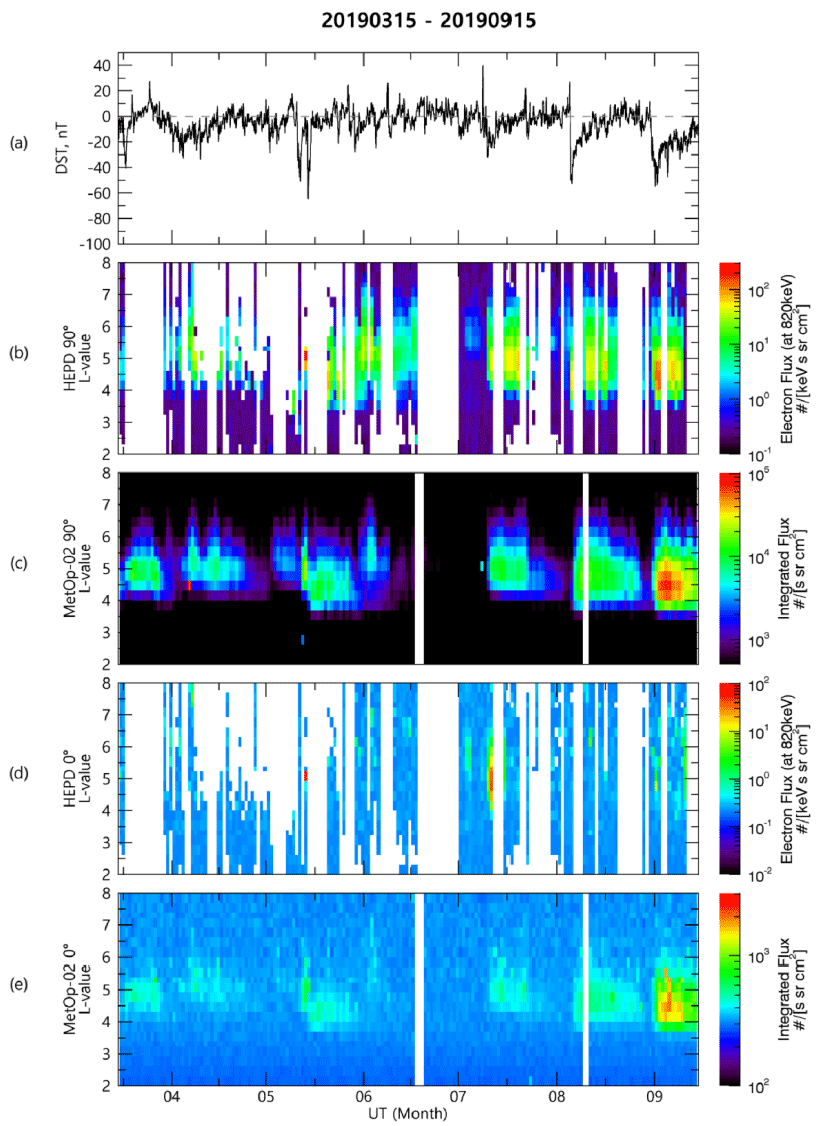
Fig. 5 compares observations from HEPD and MetOp-02 made during the period from March to September 2019. Here, we used the electron fluxes recorded at pitch angles of 0° and 90°. Fig. 5 includes the Dst index, to determine the dependence of electron flux on geomagnetic disturbances. First, there is clearly good agreement between the HEPD observations and those of MetOp-02, in both the 0° and 90° pitch angle data, although the HEPD measurements were intermittent during this initial operation period. In both observations, the electron fluxes were enhanced in the outer radiation belt, corresponding to 4<L<6. This flux enhancement was especially strong at the beginning of September, which corresponds to a modest magnetic storm, as shown in Fig. 5(a). We note that during this storm, large electron fluxes were also seen in the 0° pitch angle data in both the HEPD and MetOp-02 observations, implying that the precipitation of high-energy electrons was also enhanced.
Observations performed by the MEPD from 04:20 to 04:30 on March 9, 2019 are presented in Fig. 6. This observation period corresponds to that of HEPD, shown in Fig. 4. There are eight panels in the figure, each with an energy range of 0–400 keV and an energy bin width of 6.25 keV. The first four panels correspond to pixels 0 to 3 of Telescope A, whereas the next four panels (fifth to eighth) correspond to pixels 0 to 3 of Telescope B. Due to the presence of an electric field of 4,000 V/(3 mm) in front of the detector pixels, the response of pixel 0 is dominated by low-energy electrons below 100 keV, whereas the response of pixel 3 is dominated by low-energy protons below 100 keV. The differential fluxes shown in the spectra were converted from the count rates using geometric factors based on GEometry ANd Tracking 4 (GEANT4) numerical modeling. It was assumed that all the particles for pixels 0 and 1 were electrons, whereas those for pixels 2 and 3 were protons.
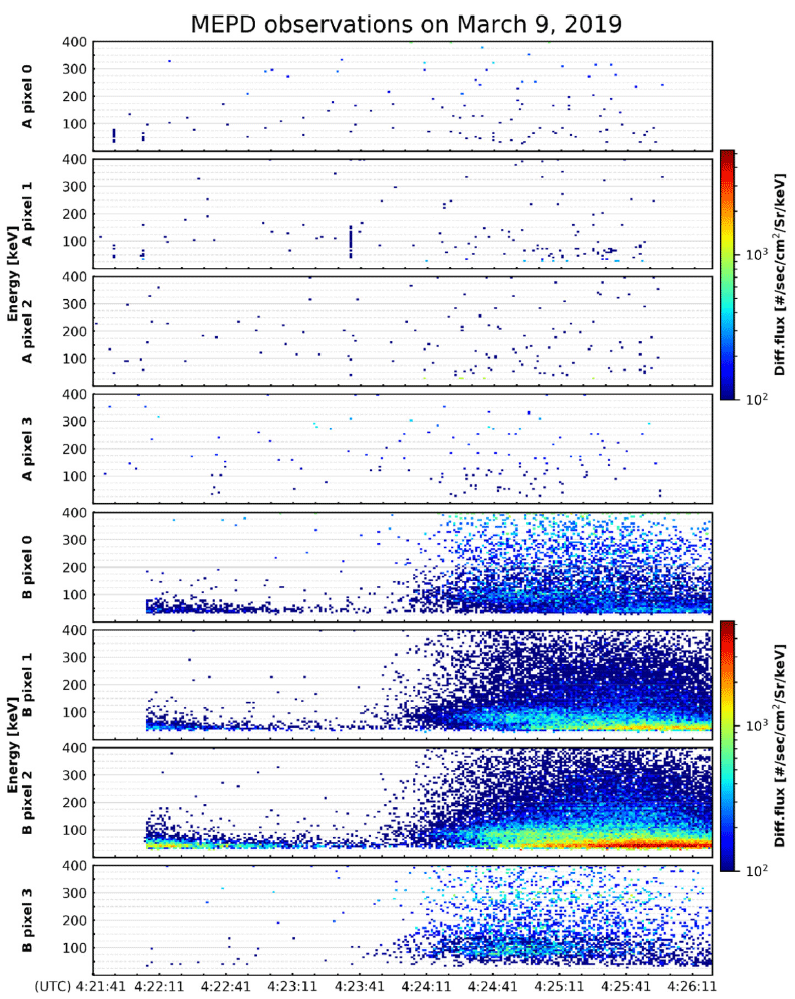
Charged particles were barely observed by Telescope A, which measured precipitating particles along geomagnetic field lines with ~0° pitch angles. On the other hand, Telescope B, which measured the trapped particles, shows enhancement in all four pixels. The enhancement from 04:24:11 UT until the termination of observation at 04:25:41 UT corresponds to the enhancement seen in the HEPD spectra of Fig. 4. These enhancements represent the parti-cles in the outer radiation belt, as discussed in section 3.1. Before 04:23:41 UT, there is an initial flux enhancement of low-energy particles, which has no counterpart in the HEPD measurements of higher energy. Furthermore, the enhancement is most significant in pixel 2, and there is virtually no enhancement in pixel 3, although these two pixels are supposed to measure low-energy protons. In fact, a significant portion of the low-energy electrons that are supposed to be detected by pixel 0 are scattered toward pixel 2, according to the GEANT4 simulations. Hence, we believe that the majority of particles measured by pixel 2 are electrons.
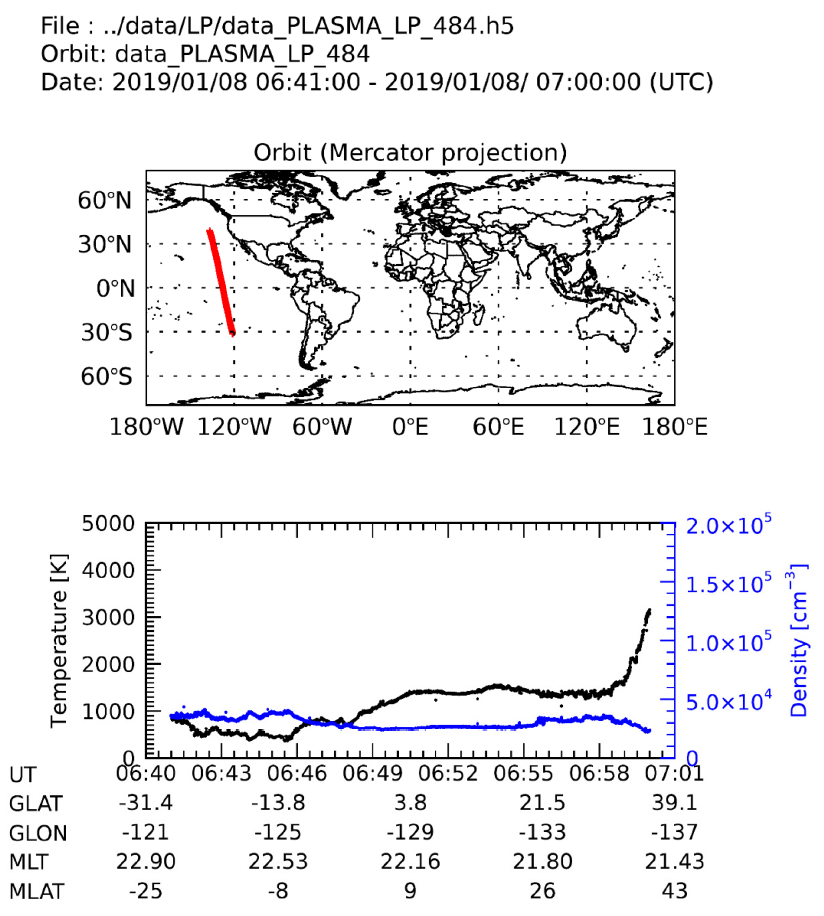
Fig. 7 shows an example of nighttime electron density and temperature measured by the SPD on January 8, 2019 in the low-latitude region, from −31° to 39°. The density is generally below 5 × 10⁴ /cc and decreases with latitude at mid-latitudes, whereas the electron temperature varies from below 1,000 K to above 1,000 K and increases dramatically with latitude in the mid-latitude regions. Furthermore, there is a general anticorrelation between density and temperature.
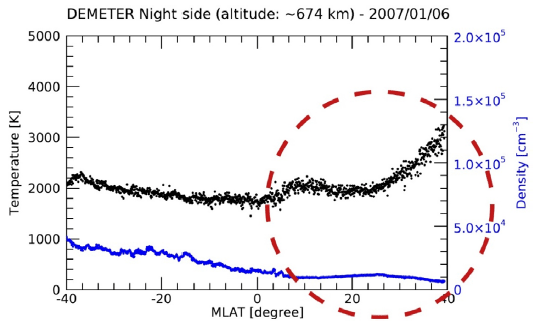
These observations were compared with those made by the Detection of Electro-Magnetic Emissions Transmitted from Earthquake Regions (DEMETER) spacecraft, at an altitude of ~710 km (Lebreton et al. 2006). Fig. 8 shows the nighttime electron density and temperature recorded by DEMETER on January 6, 2007. Note that both spacecraft made observations in almost identical conditions, in terms of the local time, day of the year, and solar activity. We can clearly see a dramatic increase in electron temperature above 20° geomagnetic latitude (MLAT), and anticorrelation between density and temperature, as in Fig. 7 of the NEXTSat-1 observations. The DEMETER electron density is lower than the NEXTSat-1 electron density, whereas the DEMETER electron temperature is higher than the NEXTSat- 1 electron temperature. This is to be expected, because DEMETER was operated at an altitude ~100 km higher than that of NEXTSat-1.
4. SUMMARY
In this paper, we have presented the preliminary results of near-Earth space observations made by NEXTSat-1, which was launched on December 4, 2018. Although both the radiation and plasma environment have been monitored, the observations were intermittent because the spacecraft also carried out many experiments related to technological advancements, as well as nighttime astronomical observations. Hence, we have focused on the verification of observed results by comparing them with those made by other spacecraft under similar conditions.
While the operations over the past one and a half years confirm that the ISSS has been working normally and that the observed data are in agreement with those of other spacecraft, much improvement is required to facilitate qualified scientific contributions. Firstly, continuous observations are required in all of the orbits, because it is difficult to predict when a geomagnetically significant event might occur, especially when solar activity is low (as is currently the case). Fortunately, the experiments for technological advancement and the astronomical observations will be completed after two years of operation, and the ISSS observations will become the main mission of the spacecraft. Secondly, analysis tools need to be improved, to create better scientific products. For example, since pixel 2 of the MEPD detects both the scattered electrons and protons, we need to establish what portion of the incident electrons are scattered by the mechanical structure and detected by pixel 2. Third, as the spacecraft ground potential varies significantly with respect to the ambient plasma, careful analysis of the space plasma data is required. It was found that automatic fitting of the data yielded erroneous results in quite a lot of cases. Hence, careful examination of the fitted results is necessary before they are used.
Geomagnetic events occur globally in space, but their manifestation varies from region to region. Hence, observing the events from many places in space will aid a better understanding of them. Fortunately, there are many spacecraft currently observing the space environment, including the geostationary Geostationary Korea Multi-Purpose Satellite-2A (GK-2A) of Korea, especially for the detection of high-energy particles. Concurrent observations made by these satellites and NEXTSat-1 will contribute greatly to scientific understanding of the near-Earth environment.