1. INTRODUCTION
The near-Earth magnetotail region between ~10 and ~25 RE plays an important role in geomagnetic activities (Baker et al. 1996;Lui 1996). Numerous studies have been devoted to understand the structure and dynamics of the near-Earth magnetotail. Statistical analyses of various satellite data have established the average properties of plasmas in the plasma sheet of the near-Earth magnetotail for both quiet and active times (Baumjohann et al. 1989;Baumjohann 1993;Huang & Frank 1994;Miyashita et al. 2000;Wang et al. 2006). The average density and thermal energy of ions in the quiet time central plasma sheet (CPS) are ~0.2–0.4 cm–3 and ~2–6 keV, respectively (Baumjohann et al. 1989;Huang & Frank 1994), and the density slightly decreases and the temperature increases as the magnetic activity increases.
The properties of the CPS plasmas strongly depend on the properties of the solar wind. Borovsky et al. (1998) showed that the plasma density and pressure in the magnetotail are well correlated to the solar wind density and dynamic pressure. This was later corroborated by the studies of Nagata et al. (2007) and Wang et al. (2007), which also showed the correlations are stronger on the flank than in the midnight region. The good correlation between the properties of plasmas in the solar wind and the CPS implies that a large portion of plasmas in the CPS originates in the solar wind (Lennartsson 1992). On the other hand, the standard deviations of the statistical averages of plasma properties show large fluctuations from the average values (Wang et al. 2006) indicating that the plasma measurements at a specific point and time could have significantly different properties from the average, which could be produced by internal disturbances.
Also, the plasma properties in the plasma sheet are significantly affected by the orientation of the interplanetary magnetic field (IMF). The Geotail observations reported by Terasawa et al. (1997) showed large variations of density (~0.03–2 cm–3) and temperature (~0.3–10 keV) depending on the observation time and location. However, compared with solar wind parameters averaged over ~9 hours prior to the Geotail observations, cold, dense plasma was mainly observed for positive IMF Bz. Similar results were obtained by Øieroset et al. (2003). Generally, the plasma on the flanks is colder and denser than that in the midnight region. The cold, dense plasma could penetrate deep into the plasma sheet across the tail and occupy a substantial part of the plasma sheet. Large-scale temporal variations from hot, tenuous to cold, dense plasma have also been observed when the IMF remained nearly northward for a long period (Øieroset et al. 2003, 2005).
Kelvin-Helmholtz instability at the flank magnetopause (Fujimoto et al. 1998;Fairfield et al. 2000;Hasegawa et al. 2004), magnetic reconnection at the high-latitude cusp (Li et al. 2005;Øieroset et al. 2005), and direct entry through the cusp (Fritz & Chen 1999;Parks et al. 2008) have been suggested as major candidates for the transport mechanism of the cold, dense magnetosheath plasmas into the magnetosphere. Wing et al. (2006) estimated the plasma sheet filling rates by diffusion through the flank magnetopause and reconnection at the high-latitude cusp, but could not determine which one is more suitable because the filling rates from different mechanisms were comparable to each other. Recently, Parks et al. (2008) showed that the magnetosheath plasmas could directly penetrate deeply into low-altitude cusp and suggested that direct entry through cusp could be an efficient transport mechanism of magnetosheath plasmas into the magnetosphere. The transport mechanism is still under investigation.
The transport of plasmas with different properties into the plasma sheet can lead to a spatially structured plasma sheet. The transient plasma jets in the plasma sheet can form narrow channels with a cross-tail (dawn-dusk) width of a few RE (Sergeev et al. 2000). Such transient jets can bring the plasma from farther down the tail that possibly have different properties from the plasma in the near-Earth tail. This can produce a structured plasma sheet along the dawn-dusk direction. Øieroset et al. (2003) reported an observation of spatial gradients in the plasma density and temperature in the north-south (latitudinal) direction, which were embedded in large-scale temporal variations. The existence of a layer of cold plasmas in the high latitude region (large Bx) has also been reported by Parks et al. (1992) and Phan et al. (1998). The properties of plasma can affect the excitation and growth conditions of plasma waves and instabilities and the existence of spatial structures is important for the dynamics of the plasma sheet and geomagnetic activities.
In this paper, we present the results of a case study of a transition boundary observed between cold, dense and hot, tenuous plasmas in the CPS close to the midnight meridian. The properties of the boundary are investigated in detail by using multi-point data from the Cluster spacecraft. In Section 2 we briefly describe the instruments used and the observations and analyses are presented in Section 3. Section 4 summarizes the findings and discusses the implications of the results on the dynamics of the magnetotail and geomagnetic activities.
2. INSTRUMENTATION
Ion measurements from Cluster ion spectrometry (CIS) (Rème et al. 2001) and magnetic field measurements from fluxgate magnetometer (FGM) (Balogh et al. 2001) were primarily used in this study. The CIS instrument detects ions with energies from 5 eV to 40 keV and consists of hot ion analyzer (HIA) and ion composition and distribution function analyzer (CODIF). The HIA instrument provides ion moments at spin-resolution (4 sec) and full 3D ion distributions averaged over 1–3 spins. The CODIF instrument provides the moments and full 3D distributions at the same resolutions as the HIA instrument for different ion species. Data from HIA onboard the Cluster spacecraft 1 (SC1) and 3 (SC3), and from CODIF onboard the spacecraft 4 (SC4) were used in this study. The FGM instrument provides magnetic field data at 22.5 Hz, but for this study, we used the data reduced to 5 Hz resolution. In addition, we used electron measurements with energies from 0.59 eV to 26.4 keV from plasma electron and current experiment (PEACE) (Johnstone et al. 1997).
For the solar wind parameters, we used the 1 min averaged OMNI data (for the OMNI data, see https://omniweb. gsfc.nasa.gov/html/HROdocum.html). The magnetic field and plasma measurements from the ACE spacecraft located at ~220 RE upstream from the Earth are used as the input for the OMNI data.
3. RESULTS
Cluster observed a transition between cold, dense and hot, tenuous plasmas at ~1909 UT on 21 August 2005 when the spacecraft passed through the near-Earth magnetotail at ~17 RE. Fig. 1 shows a summary plot of a magnetotail crossing observed by Cluster 1 (C1) from 1700 to 2100 UT. From top to bottom shown are the magnetic field (B), ion energy flux spectrogram, ion density (N) and temperature (T), and ion bulk velocity (V). The magnetic field and the velocity are presented in the geocentric solar magnetospheric (GSM) coordinates. Ion energy spectrogram, density and temperature clearly show a transition from cold, dense to hot, tenuous state at ~1909 UT (marked by the arrows). The transition was not a local, transient variation of plasma properties or a shift of the spacecraft from the plasma sheet to the plasma sheet boundary layer (PSBL) or lobe. Before the transition at ~1909 UT, C1 moved across the plasma sheet from the northern hemisphere, where Bx ~ 30 nT (at ~1700 UT), to the southern hemisphere, where Bx ~ –13 nT (at ~1908 UT). Throughout the crossing, the plasma sheet persistently consisted of ions with T ~ 1 keV and N ~ 0.3 cm–3, except for the slight increases of the temperature of ions when the plasma sheet was disturbed at ~1730 and ~1815 UT. After the transition, the temperature increased to ~4 keV and the density decreased to ~0.1 cm–3. Before and after the transition, there was no significant change in |B| except for the small pulse-like enhancement in Bx and Bz. Before C1 moved into the PSBL at ~2025 UT (Bx ~ –20 nT) hot, tenuous ions were continuously detected even when C1 approached close to the center of the plasma sheet. Thus, it can be inferred that there was a large-scale transition of the state of ions in the plasma sheet at ~1909 UT.
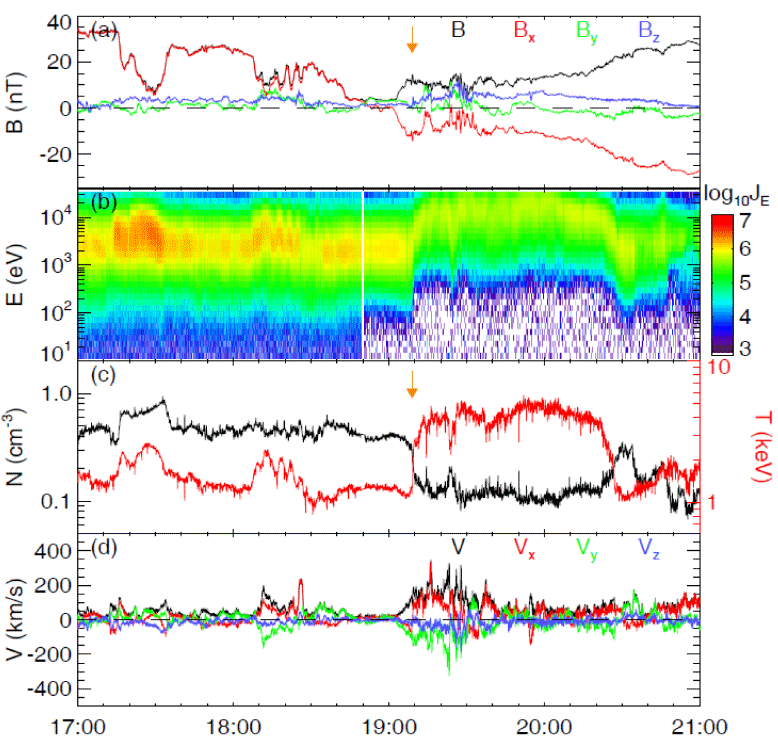
Fig. 2 shows the orbit of Cluster and the configuration of the Cluster tetrahedron in the GSM coordinates. The time interval corresponding to Fig. 1 is represented by the red line segments in Figs. 2(a) and 2(b). During this event, Cluster moved across the plasma sheet from the northern to the southern hemisphere in the post-midnight region of the near-Earth magnetotail. At the transition location, C1 was at ~(–15.9, –6.78, 1.49) RE and the Cluster tetrahedron had a large separation in the X- and Y-directions (Figs. 2(c) and 2(d)). The maximum separation distances between the spacecraft were ~1.49, ~1.25, and ~0.322 RE in the X-, Y-, and Z-directions, respectively. The large separation in the X- and Y-directions can be used to investigate spatial or temporal variations in these directions.
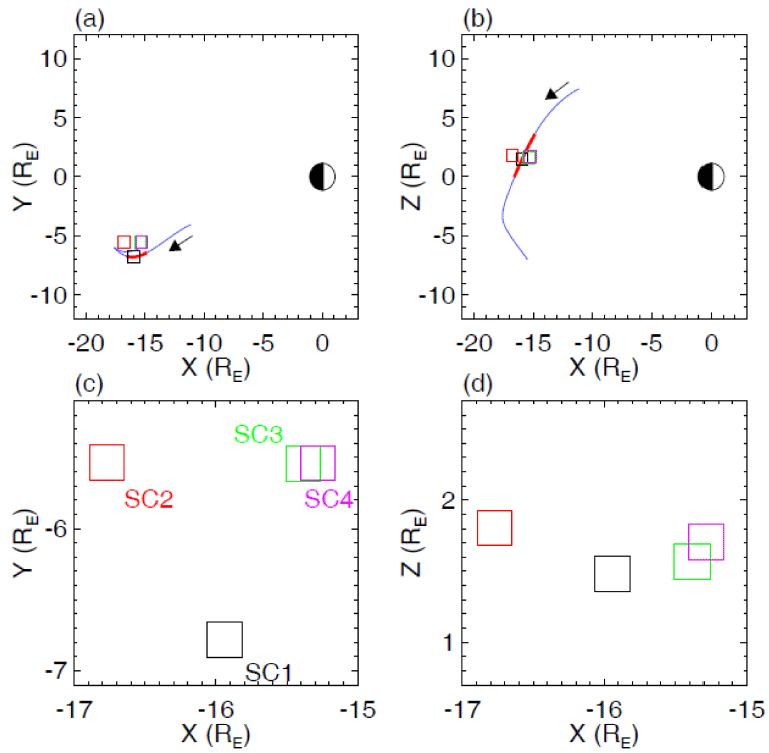
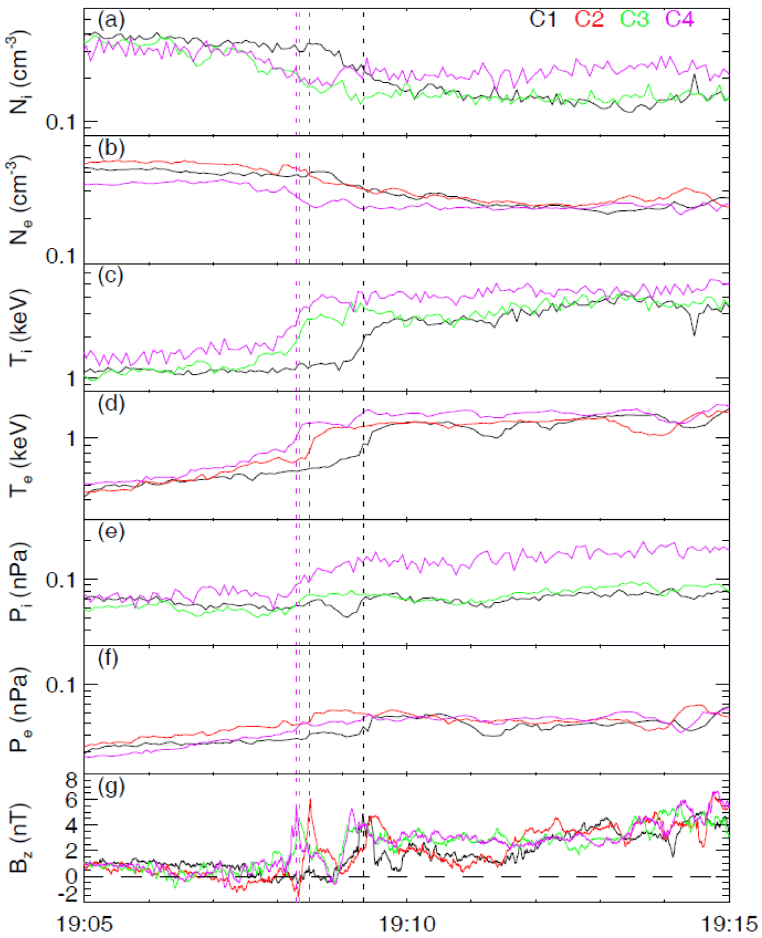
Fig. 3 shows a detailed view of the transition boundary observed by C1. From top to bottom shown are magnetic field, ion energy flux spectrogram, ion density and temperature, electron density and temperature, and ion bulk velocity. The vertical dashed lines indicate the transition boundary. The ion energy flux spectrogram shows that before the transition, a few keV ions were dominant, but after the transition, ~6 keV ions were dominant. Across the boundary layer, a quite sharp increase of energy was observed within the time resolution (12 sec) of the measurement. Also, the ion density (Ni) dropped from ~0.31 to ~0.13 cm–3, and the ion temperature (Ti) increased from ~1.1 keV to ~2.9 keV. Note that the cold (~1.1 keV), dense (~0.31 cm–3) ions in this event are not as cold (< 1 keV) and dense (> 1 cm–3) as the ions observed close to the flank region (Fujimoto et al. 1997). The transitions of density and temperature occurred somewhat gradually over ~1 min. Electrons show similar variations in the density (Ne) and temperature (Te).
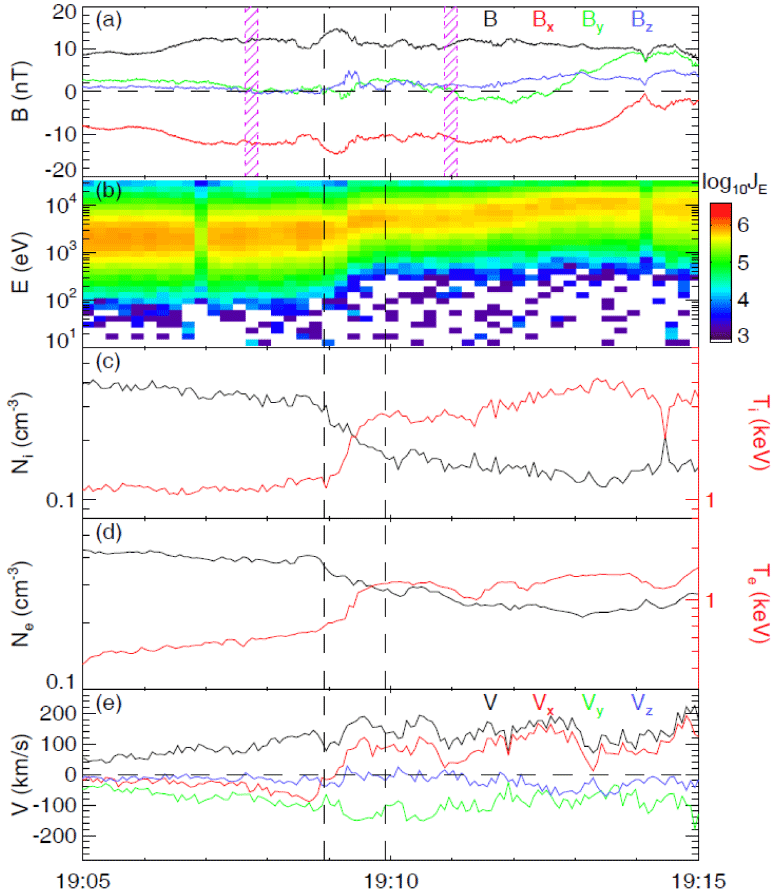
Before and after the transition boundary, the B-field magnitude was almost the same, but within the boundary layer, Bx and Bz components were slightly enhanced. The pulselike increase of the Bx component was observed only on C1. On the other hand, the increase of the Bz component was observed on all four spacecraft suggesting that the pulse-like increase of the Bz component is one of the characteristics of the transition. In addition, the magnitude of Bz is generally larger for the hot, tenuous plasmas than for the cold, dense plasmas. The average of the Bz component over 30 min before and after the boundary was ~0.76 (± 0.45) nT for cold, dense plasmas, and ~4.7 (± 2.0) nT for hot, tenuous plasmas. This suggests that the magnetotail was more dipolar after the transition to a hot, tenuous state.
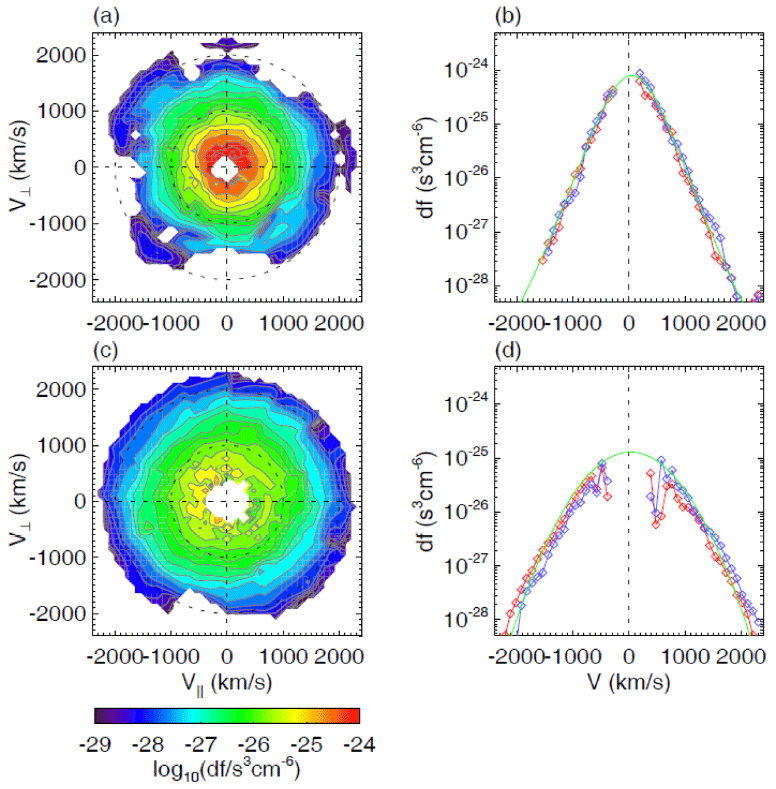
In addition to the differences in the density and temperature across the boundary, the phase space distributions of ions and electrons show distinct differences. Fig. 4 shows the 2D (left panels) and 1D (right panels) cuts of the 3D phase space distributions of ions measured by the HIA instrument onboard C1. The distributions were obtained in the hatched regions in Fig. 3(a). The distributions of both the cold, dense (top panels) and hot, tenuous (bottom panels) ions are almost isotropic with slight differences in parallel and perpendicular directions. Note that the hole in the center of the distribution occurs because the count rate is below the one-count level of HIA. The distribution of the cold, dense ions can be fit well by a Kappa distribution with k = 5, while the distribution of the hot, tenuous ions can be fit by a Maxwellian distribution (green lines in the right panels). These observations indicate that the cold, dense and hot, tenuous ions have different origins or are produced by different thermalization processes.
Using the four-spacecraft timing method (Russell et al. 1983;Schwartz 2000) we estimated the motion and orientation of the transition boundary. Fig. 5 shows the densities and temperatures of both ions and electrons, and the Bz components from all four spacecraft. Note that ion data are available only for C1, C3, and C4, and electron data for C1, C2, and C4. The transition occurred with finite time gaps between different spacecraft, which implies that the transition of the plasma state is not due to large-scale temporal variation but consistent with successive crossings of a spatial boundary by different spacecraft. Furthermore, the transition boundary was maintained for over 1 min as the boundary was crossed by the spacecraft, which were separated by ~1.44 RE. Thus, the boundary was stable and had little temporal variation. We used the Bz component as the primary indicator to obtain the time gaps between the boundary crossings by different spacecraft and compared the results to those obtained with ion and electron data. Because the temperatures had sharper transitions, we used Ti and Te as auxiliary indicators. To determine the time gaps, the cross-correlation method was used. The time gaps obtained from the Bz components and temperatures are almost identical with each other, as indicated by the vertical dotted lines in Fig. 5. The estimated boundary normal vector, n, is ~(–0.24, –0.87, –0.43), and the speed along the normal, Vn, is ~140 km/s. Thus, the transition boundary predominantly separates the region in the Y-direction as well as moving in the –Y (dawnward) direction. The speed Vn is much smaller than the local Alfvén speed (VA ~ 550 km/s). The thickness of the boundary is ~5,000 km, which is much larger than the gyroradius of hot ions, which is ~780 km for protons. This result suggests that the cold, dense ions were “pushed” toward the dawn flank by the hot, tenuous ions, which were filling the inner region. The ion velocity moments show that the hot, tenuous ions flowed earthward and dawnward (Fig. 3(e)). The component of the ion velocity moments along the normal is estimated to be ~100 km/s, which is comparable to the speed of the boundary. Thus, the hot, tenuous ions from farther down the magnetotail flowed into the inner region of the near-Earth magnetotail pushing the cold, dense ions, which previously occupied the region, out toward the dawn flank. The thermal pressures of ions and electrons show that they are a little bit greater for the hot ions than the cold ions, which corresponds to the dynamics of the boundary. Note that a secondary peak of Bz is observed by C2, C3, and C4 at ~1909 UT (Fig. 5(g)), which is not observed by C1. The secondary peak of Bz accompanies the increase of temperature in C3 and C4 although it is not clear in C2. Because the secondary peak is not observed by all four spacecraft, it can be a local or transient structure. At ~1909 UT, C1 was separated from the other spacecraft by more than 1 RE in the Y-direction, which suggests that the secondary peak can be a local structure.
4. DISCUSSION AND CONCLUSION
The observations presented in this paper show that the near-Earth magnetotail can be divided into separate regions with different plasma properties. Previous studies have reported similar spatial variations both in the longitudinal (dawn-dusk) and latitudinal (north-south) directions. In the latitudinal direction, a layer of cold plasmas exists in the high latitude region (large Bx) while the central region (small Bx) consists of hot plasmas (Parks et al. 1992;Phan et al. 1998;Øieroset et al. 2003). In the longitudinal direction, as studied in this study, the tail was structured in the dawndusk direction. This variation has been reported to be associated with the earthward flow events, which form one or multiple, narrow flow channels (Sergeev et al. 2000). In this study, we observed a transition boundary between the two regions. The inner region from the transition boundary (y < ytransition) was filled with hot, tenuous plasma moving earthward, while the outer region close to the flank (y > ytransition) was filled with cold, dense, stationary plasma. The boundary was stable but moved toward the dawn flank side suggesting that the hot, earthward moving plasma is expanding in the dawn-dusk direction. However, it is not clear if this feature is symmetric on the dawn and dusk sides centered around the midnight meridian because our observation was made only on the dawn side. Because Cluster has an elliptical polar orbit, the orbit covers only a narrow region in the dawn-dusk direction, and it was not possible to observe how many regions the tail is divided into along the dawn-dusk direction. Also, the magnetotail frequently flaps in the latitudinal (north-south) direction, which makes it difficult to determine whether the transition boundary lies in the dawn-dusk direction or the north-south direction.
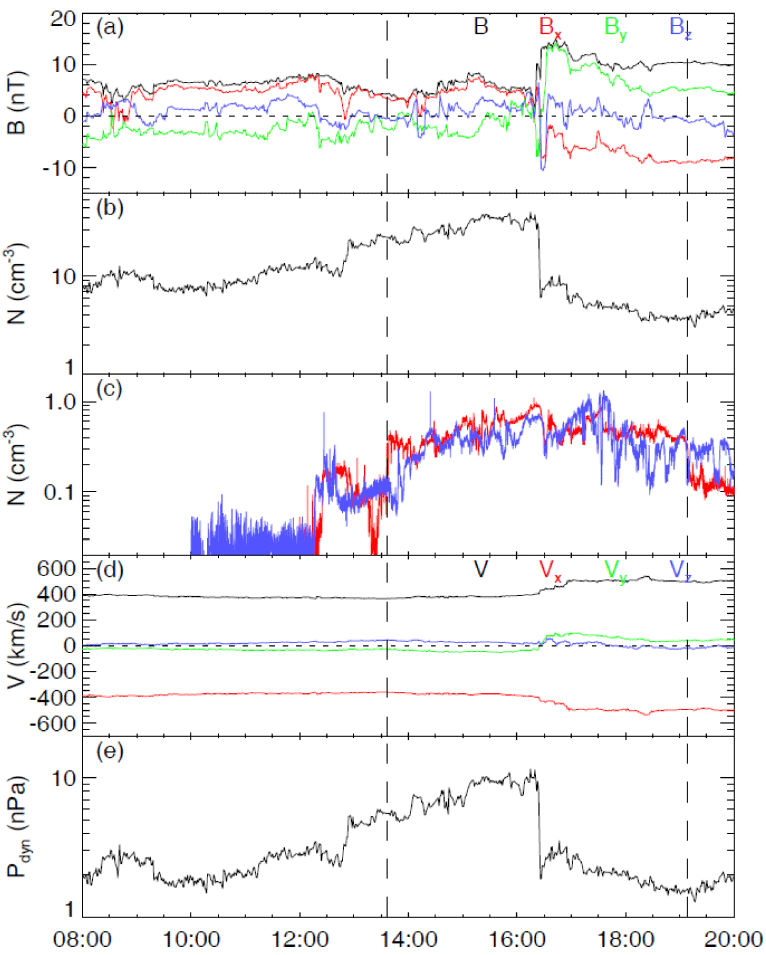
The hot, tenuous plasmas can be originated from farther down the magnetotail. The bulk velocity of the ions mainly had positive (earthward) x-component although the speed, less than ~200 km/s, was not large. Magnetic reconnection could have generated these slow convections, but because the observation was made away from the possible source region, we cannot clearly identify the generation process. Solar wind observations did not show any variations when the transition was detected by Cluster (Fig. 6). Passage of a sector boundary at ~1630 UT could have produced disturbances in the magnetotail a few hours later. After the passage of the sector boundary, the dynamic pressure of the solar wind significantly reduced from ~10 nPa to ~2 nPa, which might have caused the whole magnetosphere to expand. At that time the AE index increased to ~500 nT from ~100 nT and later it varied between ~200 and ~500 nT.
The transition boundary can contribute to the magnetosphere- ionosphere coupling by generating field-aligned current within the boundary layer (e.g., Shin et al., 2019). The magnetic fields in the hot, tenuous plasmas are more dipolar than those in the cold, dense plasmas. The variation of the magnetic fields across the boundary layer can generate field-aligned currents. The Cluster tetrahedron configuration for this event is not suitable to estimate current density directly from four-point magnetic field measurements. However, from a simplified model, it can be found that the variation of the B-field from dipolar (y < ytransition) to more stretched (y > ytransition) in the dawn-dusk direction results in field-aligned current flowing into the ionosphere. If the same boundary is formed in the dusk side, it results in fieldaligned current flowing out from the ionosphere. This has the same sense with the region-1 field-aligned current system, implying that the ionospheric field-aligned current system could be mapped to a boundary layer formed in the plasma sheet near the flank magnetopause. Moreover, the expansion of the boundary along the dawn-dusk direction suggests the foot points of the field-aligned current on the ionosphere also move along the dawn-dusk direction.
In this study, we presented in detail the properties of a boundary separating magnetotail into regions with different plasmas in the dawn-dusk direction. The properties of plasmas show that the near-Earth magnetotail can consist of plasmas with different origins. It is expected that different dynamical processes occur in regions with different plasmas, which can affect the development of geomagnetic activities. Moreover, the boundary layer can contribute to the magnetosphere–ionosphere coupling by generating field-aligned currents.