1. INTRODUCTION
Near-equatorial magnetosonic waves (MSWs hereinafter) are among the frequently observed plasma waves in the inner magnetosphere (radial distance < ~10 RE, where RE is Earth radius) and have the largest amplitudes in the frequency range between a few and ~100 Hz (Santolík et al. 2004;Meredith et al. 2008;Ma et al. 2013;Hrbáčková et al. 2015;Posch et al. 2015;Boardsen et al. 2016). Theoretical studies have suggested that MSWs can significantly affect the dynamics of radiation belt electrons through resonant and non-resonant wave-particle interactions (Horne et al. 2007;Bortnik & Thorne 2010;Chen et al. 2015;Li et al. 2015).
MSWs are also phenomenologically referred to as equatorial noise after the initial discovery by Russell et al. (1970) who reported noise-like emissions in the aforementioned frequency band when the satellite passed through the equatorial region of the inner magnetosphere. Soon after, it was found that the noise-like emissions near the equator can be described as the very oblique (with wave normal angle close to 90°) whistler mode or the high-frequency extension of the magnetosonic mode in a cold proton-electron plasma model (Boardsen et al. 1992;Němec et al. 2006;Walker et al. 2015;Boardsen et al. 2016). Theoretically, waves propagating in this mode exhibit both the electrostatic and electromagnetic character so that the fluctuating magnetic field has the dominant compressional component and the fluctuating electric field has the dominant longitudinal component. This propagation nature of MSWs has been confirmed observationally (Boardsen et al. 2016), and the polarization of the electric field is often used to infer the wave propagation direction experimentally (e.g., Santolík et al. 2004;Němec et al. 2013;Boardsen et al. 2018). MSWs are also well-known for their discrete spectral peaks in frequency space around the harmonics of the proton cyclotron frequency, fcp, between fcp and the lower hybrid frequency (Balikhin et al. 2015). This suggests that the ion Bernstein instability, which produces unstable waves at the proton cyclotron harmonics is the likely mechanism of MSW wave excitation (Gul'elmi et al. 1975;Gurnett 1976;Perraut et al. 1982;Boardsen et al. 1992;Horne et al. 2000;Chen et al. 2010;Liu et al. 2011). The instability is driven by energetic protons of a ring-like velocity distribution with positive slope in the perpendicular velocity direction, ∂f/∂v⟂ > 0. The simultaneous observations of the proton ring-like velocity distributions and MSWs have been reported in numerous studies (e.g., Ma et al. 2013;Balikhin et al. 2015;Min et al. 2018).
Statistical observation studies (Gurnett 1976;Perraut et al. 1982;Laakso et al. 1990;Kasahara et al. 1994;André et al. 2002;Santolík et al. 2004;Němec et al. 2005, 2006, 2015; Hrbáčková et al. 2015;Boardsen et al. 2016;Yuan et al. 2019;Zou et al. 2019) have shown that MSWs occur most frequently at latitudes within about 10° from the magnetic equator and their amplitudes likewise exhibit a narrow latitudinal distribution with a maximum at the magnetic equator. So, the general consensus has been that the wave source (that is, energetic protons with a ring-like velocity distribution) should also be similarly confined near the magnetic equator. MSWs excited there with a wave normal angle off 90° leave the equatorial source region and propagate poleward before being refracted back toward the equator (e.g., Boardsen et al. 1992), leading to the wave confinement. Ray tracing studies (Boardsen et al. 1992;Horne et al. 2000;Xiao et al. 2012, 2013;Shklyar & Balikhin 2017) have shown that rays launched at the equator thread the equatorial plane, and the corresponding wave normal angle varies between a minimum angle, e.g., 89° at the equator and 90° at the wave turning point (see Figs. 2–3 in Shklyar & Balikhin 2017), supporting the equatorial- source mechanism. Recently, Chen et al. (2018) carried out full particle-in-cell (PIC) simulations of the excitation and propagation of MSWs in the dipole magnetic field. Consistent with the aforementioned consensus, their simulation showed that MSWs are excited near the equatorial plane by the energetic proton ring distribution and subsequently propagate nearly perpendicular to the background magnetic field, both radially inward and outward.
While many of the previous studies were focused on the generation from an equatorial source region, the present study is concerned with whether the plasma conditions away from the equatorial region along the magnetic field line are unstable to the excitation of MSWs. According to Liouville’s theorem, if the loss cone angle is not too wide, the velocity ring feature, a necessary condition for the MSW excitation, can extend to high latitudes. As an example, Boardsen et al. (1992) estimated that even for the loss cone angle of 40°, most of the protons comprising the ring velocity distribution bounce back toward the equator within a magnetic latitude range of ~±26°. Since the loss cone angle of 40° is quite large for typical conditions of the inner magnetosphere, a ring-like proton velocity distribution will likely spread across a wide latitudinal range. It is possible that the plasma conditions off the equator can still excite MSWs locally. In fact, Boardsen et al. (1992) investigated linear theory growth rates up to 8° latitude along the field line at L = 4 (L being the magnetic L-shell number), assuming plasma conditions constant along the field line. In their calculation, not only is wave growth shown up to 8° latitude, but the maximum growth rate actually occurs at that latitude. In addition, the unstable frequency range also changes with latitude. Ray tracing simulations with simultaneous wave gain calculation also account for the contributions of wave growth off the equator as wave packets bounce between two hemispheric reflection points (e.g., Horne et al. 2000;Shklyar & Balikhin 2017). However, due to the limited number of wave packets being traced the coverage in latitude and frequency space is typically limited.
The present study takes an approach similar to that of Boardsen et al. (1992): Given a (dipole) magnetic field line and a reasonable description of a ring-like proton velocity distribution at the magnetic equator, the linear theory dispersion relation is solved along the field line to obtain wave growth rates and full PIC simulations are then carried out to investigate local wave saturation amplitudes. A critical assumption here is that plasmas and the background magnetic field at different locations along the field line are treated as being local and approximated as being uniform. Evidently, it lacks the inherent background plasma and magnetic field inhomogeneity in the Earth’s magnetosphere which is important for the evolution of plasma waves. Nevertheless, the approach taken here and the results of the present study can illuminate the generation process of MSWs and are an important intermediate step upon which more complete later analyses can be executed.
The organization of the paper is as follows: Section 2 briefly describes the methodology; section 3 presents the linear dispersion analysis results together with the one- and two-dimensional PIC simulations; and section 4 concludes the paper.
2. METHODS
The parameters used in the present study are derived from the event of Min et al. (2018): L = 5.6 RE; the equatorial plasma number density ne,eq = 24 cm–3; and the equatorial magnetic field strength Beq = 131 nT. The subscript “eq” signifies that these quantities are equatorial values. These conditions result in the ratio of the electron plasma frequency to the electron cyclotron frequency ωpe,eq/Ωce,eq = 12, the ratio of the light speed to the Alfvén speed c/vA,eq = 514, and the Alfvén energy is keV. However, reduced values for c/vA,eq = 40 (equivalent to ωpe,eq/Ωce,eq = 4) and the proton- to-electron mass ratio mp/me = 100 are utilized instead in order to reduce the computational cost for PIC simulations. As shown by Min et al. (2018) and Min & Liu (2016), the major consequence of using these reduced parameters is the reduced number of proton Bernstein wave harmonics. Nevertheless, because the essential physics of wave-particle interactions can still be emulated (e.g., Liu et al. 2011;Sun et al. 2016, 2017;Gao et al. 2017;Chen et al. 2018), it has been customary to use the reduced values to save the computational cost. On the other hand, it should be emphasized that the field line geometry at L = 5.6 RE is kept.
Similar to the analysis of Boardsen et al. (1992), the proton-electron plasma is assumed to be made of three components: tenuous, energetic proton population responsible for the MSW excitation and the cold, charge-neutralizing background proton and electron populations. The energetic proton population at the magnetic equator is assumed to follow the partial shell velocity distribution given by
where v = |v| is the velocity modulus; α is the pitch angle; is the effective temperature anisotropy; vs and θs are the ring (or shell) speed and the thermal spread of the shell, respectively; ns,eq is the equatorial number density; and C(x) is the normalization constant given by
Here, erfc and Γ are the complementary error function and the Gamma function (e.g., Arfken 1985).
Making use of the conservation of particle kinetic energy and the magnetic moment, Liouville’s theorem (Xiao & Feng 2006) states that velocity distributions along the field line have the same form as Eq. (1) except that the density is determined by , , where λ is latitude. Apparently, the number density of any isotropic (A = 0) distributions should be constant along the field line. For the dipole magnetic field, magnetic latitude and the field strength have the following relation: . For the present analysis, ns/ne,eq = 0.025 (i.e., 2.5% energetic protons), vs = 1.7 vA,eq (equivalently keV), θs = 0.43 vA,eq (equivalently keV), and A = 0.5, similar to those in the event of Min et al. (2018).
Given the distribution function of Eq. (1) and the parameters necessary to describe the local plasma system, the kinetic dispersion relation is solved using the method described in Min & Liu (2015). The same dispersion solver was also used in Min et al. (2018) and its validity was crosschecked by Xie (2019). For propagation perpendicular to the background magnetic field (i.e., wave normal angle θk = 90°), an approximate expression for the growth rate (Gul'elmi et al. 1975) is available and provides a much quicker way to get growth rates. (The formula can be also found in Min & Liu (2016), Eq. (A41).) Since solving the kinetic dispersion relation without approximation is time-consuming, the approximate formula is used to obtain the overall trend of the growth rate along the field line, while the exact solutions are obtained at selected latitudes for validation and comparison.
For PIC simulations, the code developed by Liu (2007) and subsequently used in, e.g., Liu et al. (2011) and Min et al. (2016) are utilized. One- and two-dimensional simulations are carried out for the present study at the selected latitudes. For one-dimensional simulations, the spatial variation (say, the x direction) is chosen to be perpendicular to the background magnetic field. The number of grid points is 500 and the number of particles per cell for the shell proton population is 2500. For two-dimensional simulations, the number of grid points is 500 × 175 in the directions perpendicular and parallel to the background magnetic field, respectively. The number of particles per cell for the shell proton population is still 2,500. For both one- and two-dimensional simulations, the periodic boundary conditions are used and the integration time step is (where Ωcp,eq is the equatorial proton cyclotron frequency). As shown in Table 1, the simulation grid size varies with latitude in accordance with the varying background magnetic field strength (i.e., the field strength gets stronger at higher latitude). Table 1 also lists the parameters for the shell proton population at the selected latitudes. It is important to stress that all simulations are local in that the plasma and background magnetic field are uniform and homogenous.
3. RESULTS
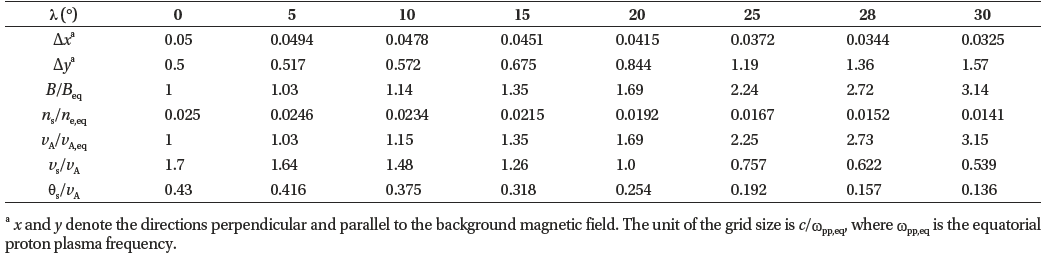
Figs. 1(a)–1(c) display the latitudinal variation of several parameters. In Fig. 1(a), the curves of the Alfvén speed (given by , where nc is the number density of the background proton population) and the magnetic field strength (normalized to the respective equatorial values) nearly overlap each other. This is because ns ≪ nc, even though the number density of the energetic proton population changes with latitude. In Fig. 1(b), because vs and θs are invariant with latitude, their values normalized to vA are a decreasing function of latitude. Particularly, the ratio vs/vA is an important parameter because it determines the unstable frequency range; typically, a ratio larger than unity leads to the MSW excitation in a wider frequency range (e.g., Boardsen et al. 1992;Horne et al. 2000;Chen et al. 2010;Min & Liu 2016). In Fig. 1(c), the ratio of the lower hybrid frequency to the local proton cyclotron frequency () starts at around 9.7 and monotonically falls below 8° at 30° latitude. This ratio determines the maximum number of the proton Bernstein harmonic modes that the system can support. That is, there can be up to nine discrete harmonic modes of MSWs at the equator and up to seven harmonic modes at 30° latitude.
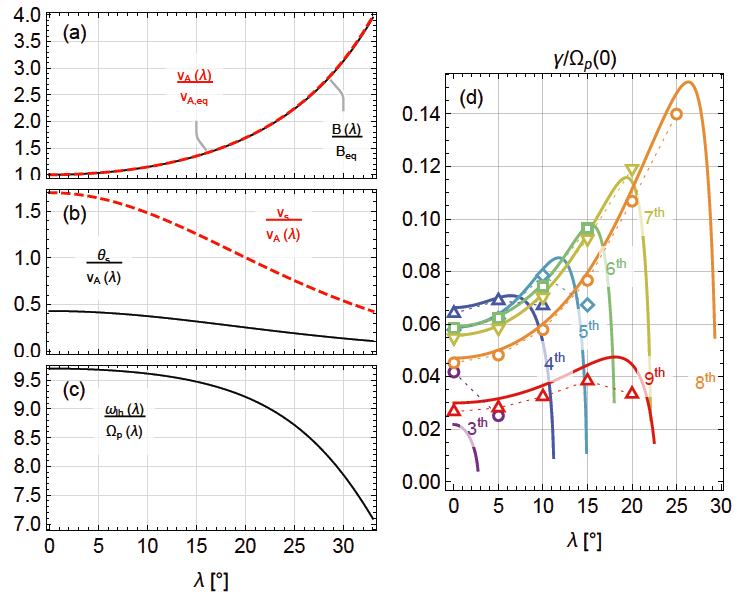
Fig. 1(d) presents the calculated MSW growth rates (normalized by Ωcp,eq) at wave normal angle θk = 90°. The results from the approximate formula are shown with solid curves, and the solutions of the full dispersion relation at the selected latitudes (Table 1) are displayed with open symbols. There appear some deviations for the 3rd and 9th harmonics, but overall the results from the two different methods agree with each other well. A rather startling result is the steep increase of the growth rates with an increasing latitude, followed by a rapid descent. The maximum growth rate occurs at around 25° latitude for the 8th harmonic. It is worth mentioning that the maximum growth rate normalized by the local proton cyclotron frequency is relatively steady (γ/Ωcp~0.07; not shown), which means the growth rate is primarily scaled by the background magnetic field strength. Another noteworthy feature is the shift of the frequency range of unstable modes with latitude: At the equator, harmonics from the 3rd to 9th are unstable (with the 4th harmonic being the fastest growing mode), but above 23° latitude, it is only the 8th harmonic that remains unstable. As stated in the previous section, this is due to the changing vs/vA shown in Fig. 1(b).
In order to investigate the nonlinear saturation of MSWs at different latitudes, one-dimensional PIC simulations using parameters corresponding to the local conditions given in Table 1 are performed. Fig. 2(a) shows the initial growth rate estimated (using total wave energy from the simulations) and the MSW saturation energy from the simulation results at different latitudes. First, looking at the red closed symbols, the growth rate does increase (albeit only moderately) with latitude, reaches peak around 20° latitude, and falls down rapidly thereafter. (Although not shown here, the saturation time becomes shorter when the growth rate is larger.) The initial growth rates estimated from the simulation results seem to be smaller than the theoretical ones shown in Fig 1(d). The reason is likely that the growth rate estimation takes into account all harmonic modes. Unlike the initial growth rate, the saturation energy of MSWs exhibits a monotonic decrease with latitude, signifying that the relationship between the linear growth rate and the saturation amplitude is more than linear (cf. Bortnik et al. 2011;Fu et al. 2016). A comparison between the magnetic and electric saturation energy suggests that the excited MSWs become more electrostatic at higher latitude. This is in accordance with the fact that the unstable frequency range shifts toward the lower hybrid frequency at high latitude shown in Fig. 1 and consistent with the statistical observation results (Boardsen et al. 2016).
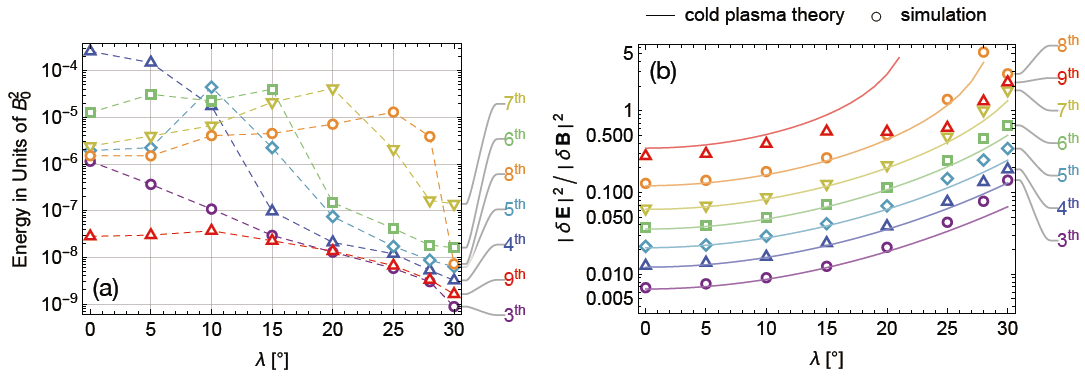
Fig. 3(a) shows the comparison of the magnetic field saturation energy for the harmonics from 3rd to 9th. Comparing with Fig. 1(d), the relative strength of the various harmonic modes at a given latitude is consistent with the linear theory implication and is a result of the varying vs/vA ratio. Fig. 3(b) shows the comparison between the theoretical and simulated δE2 / δB2 ratio (electric-to-magnetic energy ratio) and explains the relative strength between the electric and magnetic energy in Fig. 2(a).
Given that the unstable MSWs are not limited to the 90° wave normal angle, two-dimensional PIC simulations using plasma parameters corresponding to the local conditions given in Table 1 are also carried out. Fig. 2(b) shows the saturation energy and initial growth rate versus latitude from the two-dimensional simulations. The overall trend is qualitatively consistent with the results from the one-dimensional cases. On the other hand, both the saturation energy and the growth rate from the two-dimensional cases exhibit a quite substantial elevation at high latitude (above ~20°). In comparison with observations (for example, Fig. 3 of Zou et al. (2019)), the amplitudes of excited MSWs also maximize near the equator and decrease monotonically with latitude, but the rate at which they decrease is not as steep as what the observation results suggest.
Fig. 4(top) shows the magnetic field power spectra in two-dimensional wavenumber space at the time of MSW saturation and at latitudes λ = 0°, 10°, 15°, 20°, 25°, and 28°. Similarly, Fig. 4 (bottom) shows the linear growth rates obtained by solving the full kinetic dispersion relation. Overall, the simulation results agree well with the theoretical prediction. It is worth mentioning that near the equator, the wave power is concentrated in the region of vanishing parallel wavenumber (k|| ≈ 0), but at high latitude, it occupies a relatively wide region in parallel wavenumber space. In other words, at least for the parameters chosen here, MSWs propagating perpendicular to the background magnetic field no longer dominate for the conditions at high latitude and consequently, the one-dimensional simulations do not appropriately represent the MSW excitation at that location. This explains the substantial discrepancy between the saturation energies shown in Figs. 2(a) and 2(b) at high latitude.
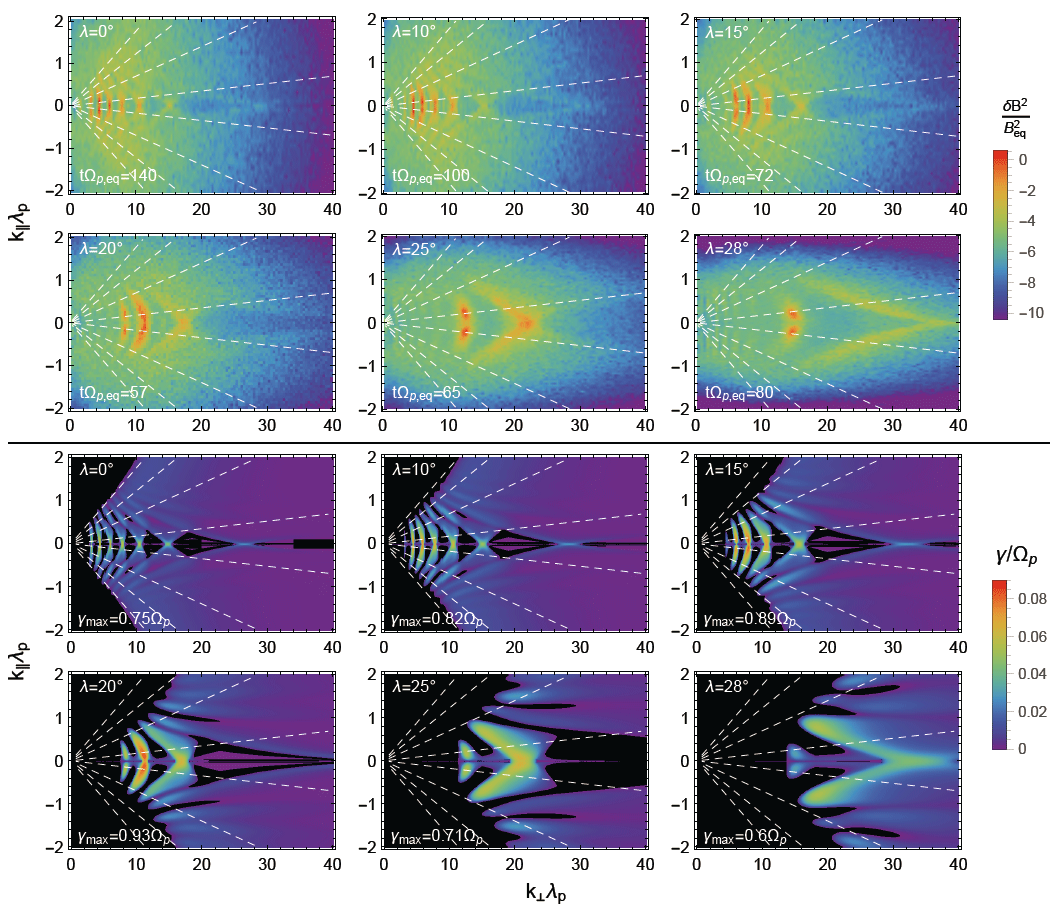
From Fig. 4, the distribution of wave power (or the wave distribution function) in wave normal angle space can be easily obtained. Fig. 5 shows the power-weighted average wave normal angles plotted as a function of latitude. On average, θk of the dominant wave modes remains around 89° with a slight tendency (albeit smaller than the error bars) of increase for the conditions at high latitudes.
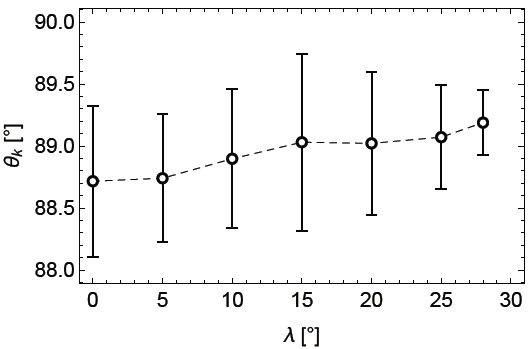
Recently, Zou et al. (2019) reported the latitudinal dependence of the median wave normal angle by compiling MSW events from the Van Allen Probes mission (Mauk et al. 2012). Their analysis (Fig. 6 in their paper) showed that the median of the wave normal angle maximizes at the equator and monotonically decreases with latitude—the median wave normal angles are around 88° and 85.5° at the equator and 15° latitude, respectively. Before interpreting this observational result, it should be emphasized that the experimental determination of the wave normal angle of MSWs is known to introduce quite large uncertainty (Boardsen et al. 2016, 2018). This is because MSWs are characterized with strong linear polarization and the fine frequency structure, whereas the typically used methods for wave normal angle determination (Means 1972;Santolík et al. 2003) expects well defined wave polarization for accuracy. It appears that the error analysis in Zou et al. (2019) only involves that of the statistical distribution of the average wave normal angles of the events, but not the uncertainty of the wave normal angle determination itself for individual events they analyzed. Having said that, if the decreasing wave normal angle trend does hold as shown in Fig. 6 of Zou et al. (2019), the opposite trend in our simulations further indicate that assuming a uniform plasma and background magnetic field at high latitudes is an oversimplification.
4. CONCLUSIONS
The present study set out to investigate the generation process of MSWs and specifically the reported latitudinal confinement of wave energy and occurrence in a narrow vicinity of the magnetic equator. To achieve this goal, linear instability analysis and one- and two-dimensional full PIC simulations were carried out to understand the linear growth and quasilinear/nonlinear saturation characteristics of MSWs along a dipole magnetic field line, given an unstable plasma distribution at the magnetic equator. The plasma conditions at different locations along the field line were obtained by mapping the equatorial source distribution using Liouville’s theorem, assuming conservation of kinetic energy and magnetic moment. To facilitate the analyses, plasmas and the background magnetic field at the chosen locations were considered to be local and approximately uniform. To simplify the analyses further, a three-component proton-electron plasma was considered to model the free energy source. Some important parameters, such as temperature anisotropy, proton ring speed, and the relative concentration of the energetic proton population, were derived from an event study to ensure some level of realism.
The results show, for the parameters assumed here, that MSWs initially grow fastest at high latitude (20°–25°) rather than near the equator, but their saturation amplitudes indeed maximize within ±10° latitude and decrease monotonically with latitude, in agreement with the reported statistical observation results. However, the rate at which the saturation amplitudes decrease is not as steep as what the observation results suggest. Furthermore, the average wave normal angle of the excited MSWs in the simulations is relatively independent of latitude as opposed to a monotonic decrease as in the recent statistical observation results. The large deviation of the present results at high latitudes from the observations seems to suggest that assuming a uniform plasma locally is an oversimplification, and that spatial inhomogeneity of the background magnetic field and plasma conditions (neglected in the present study) plays an important role in further surpressing the saturation level and refracting the wave vector away from the direction perpendicular to the background magnetic field.
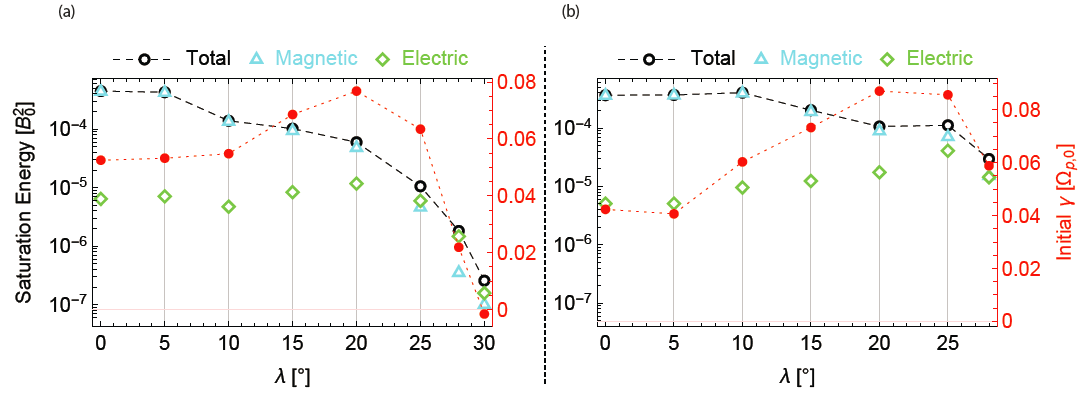
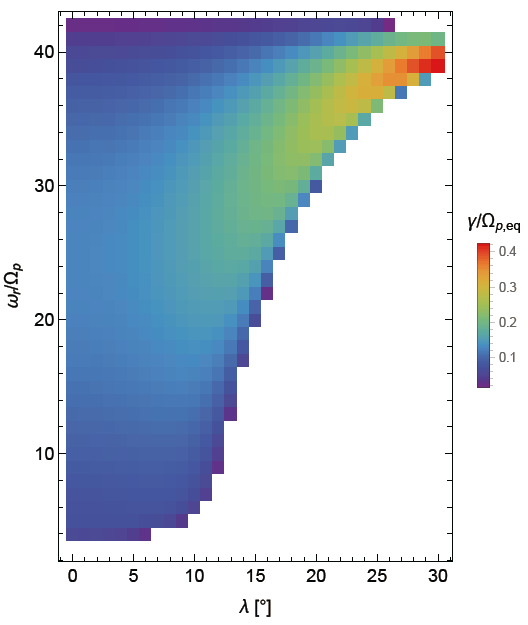
As a final note, the use of the reduced proton-to-electron mass ratio, mp/me = 100, have effectively limited the number of proton Bernstein harmonic modes in the present analyses. So, one may wonder whether using the real mass ratio will drastically alter the present conclusion. Fig. 6 shows the linear growth rates assuming the real mass ratio (and the observed value of c/vA,eq = 514). It appears as though Fig. 6 is a blown-up version of Fig. 1(d). That is, the maximum growth rate occurs at high latitude and near the lower hybrid frequency; the lower harmonic modes become stabilized at an intermediate latitude. Again, this is mainly controlled by the ratio of the ring speed of the energetic proton ring-like distribution to the local Alfvén speed. Therefore, a similar conclusion would be reached even if one uses the full-scale parameters.