1. INTRODUCTION
The ionospheric mid-latitude trough (IMT) is a wellknown large-scale ionospheric electron density depletion phenomenon at mid-latitude region during nighttime (Muldrew 1965;Sharp 1966;Moffett & Quegan 1983). The trough structure is mainly developed in the night sector and was suggested to be a result of complex plasma processes coupled to the plasmasphere and magnetosphere (Yizengaw et al. 2005). Due to the merge of westward ion convection flow and eastward co-rotating plasma flow near midnight sector, very slow movement or stagnation of plasma causes the region to have sufficient time for its plasma density to reduce through chemical recombination processes. Thus, the stagnation region becomes the IMT which has lower electron density than higher latitude region. The stagnation model was suggested as a main process by Knudsen (1974) and Spiro et al. (1978). Generally, the IMT has a gentle slope at equatorward edge and relatively steep gradient at poleward edge due to auroral region, and the latitude of its minimum location moves equatorward as geomagnetic activity increases.
Because the ionospheric condition could significantly affect high frequency (HF) communication or Global Navigation Satellite System (GNSS), it is practically important to characterize the ionospheric morphology and irregularities in the mid-latitude region including the Korea peninsula. For example, Kim & Hegai (2015) investigated mid-latitude ionospheric responses to geomagnetic condition. Hong et al. (2017) reconstructed the ionospheric electron density over Korean Peninsula by using a tomographic technique with total electron content (TEC) data from the Korea GNSS receiver network. Recently, Lee et al. (2011) and Yang et al. (2015) investigated climatological feature of the IMT in both hemispheres during the extreme solar minimum period of 2009 and inspired to carry out more research on the climatology of the IMT. However, the IMT feature has not been analyzed from the topside due to lack of recent measurements.
In this study, we analyzed topside ionospheric sounding data of Alouette-1/2 and ISIS-1/2 in 1960s and 1970s. The topside sounding system is an ionosonde onboard spacecraft that can detect the electron density by using sweep frequencies from the altitude of satellite to the ionospheric peak density height (Chapman & Warren 1968). Unlike common ionospheric observation methods, such as ground ionosondes and in-situ rocket or spacecraft measurements the topside sounder has an advantage to investigate topside ionospheric profiles above the F2 peak. Although Lee et al. (2014) and Park et al. (2015) investigated the topside ionosphere by using in-situ spaceborne measurements, the measurements are not enough to cover the whole altitude range of the topside ionosphere. However, the topside sounding systems on Alouette-1/2 and ISIS-1/2 have produced abundant datasets of the topside ionosphere over the globe for two solar activity cycles. Although the data are 40–50 years old, the topside sounders provided valuable topside ionospheric electron density profiles from the electron density peak height, which are not currently available. Muldrew (1965) used the topside sounding data to study the IMT only by focusing on specific IMT structure with consecutive electron density profiles along the satellite orbit. On the other hand, we here concentrate on the climatological characteristics of the IMT because the topside sounding period has covered at least one solar cycle and was more than two solar cycles ago. We paid special attention to unveil the climatological feature of the IMT by comparing the IMT structures during solar maximum and minimum periods. In addition, we calculated transition heights from each electron density profiles to characterize the topside vertical structure of the IMT. Incoherent scatter radar (ISR) data from Millstone Hill and St. Santin were also used to investigate possible interacting processes between the ionosphere and the magnetosphere.
2. DATA AND ANALYSIS
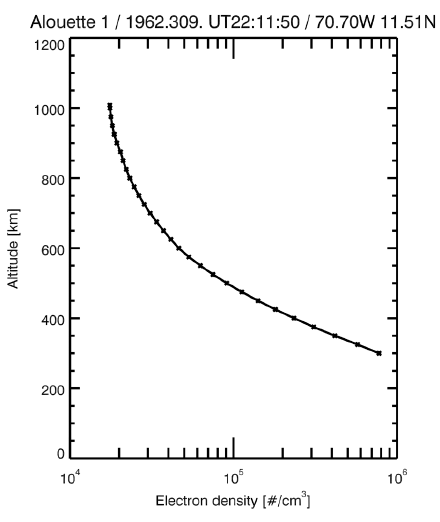
The topside sounding system is simply an ionosonde on board an artificial satellite. Two series of topside sounding system, Alouette and International Satellites for Ionospheric Studies (ISIS) were launched in 1960s and 1970s, respectively. Alouette-1 and ISIS-2 had almost circular orbits with altitudes of ~1,000 km and ~1,400 km, respectively, while Alouette-2 and ISIS-1 had elliptical orbits from ~500 km to 3,000 km in altitude. These four satellites had collected topside ionospheric electron density profiles from the satellites to the F2 peak height (Chan & Colin 1969;Jackson & Warren 1969). The topside sounder data can be obtained from an archive: NASA Goddard Space Flight Center, Space Physics Data Facility (https://omniweb.gsfc. nasa.gov/ftpbrowser/ftphelper.html). Fig. 1 shows a topside ionospheric electron density profile measured by Alouette 1 on day of year 309 in 1962. The cross signs represent actually measured electron density values. Even though the entire operating period covered from 1960s to 1990s, very few data are available after 1980s. In addition, there was a technical limitation to data storage in satellites at that time. Therefore, topside sounders had to immediately transmit observed data to ground-based storing stations and thus the stored data tend to be concentrated on certain longitudes where downlink stations were available, although the satellites covered almost whole magnetic latitudes and magnetic longitudes. Alouette-1 and Alouette-2 collected total number of 85,772 and 9,301 topside electron density profiles, respectively. ISIS-1 and ISIS-2 sounded 38,953 and 42,596 profiles, respectively. The data coverage of the topside sounder satellites has been presented in detail with a map format by Lee et al. (2016), which analyzed the same dataset to study the boundary between the ionosphere and the plasmasphere.
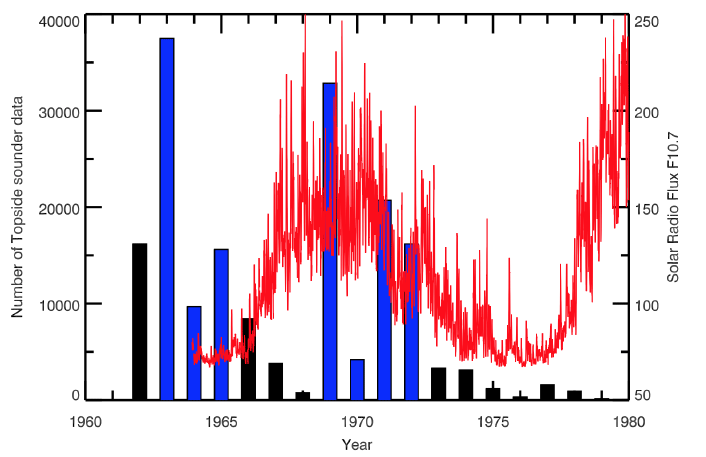
The histogram shown in Fig. 2 indicates the number of topside sounding electron density profiles obtained from Alouette-1/2 and ISIS-1/2 satellites over the period. As an indicator of solar activity, daily solar 10.7cm radio fluxes (F10,7) are also presented with a red line. The F10.7 fluxes were obtained from NASA OMNI Web service (https:// omniweb.gsfc.nasa.gov/form/dx1.html). To characterize climatological aspects of the IMT between solar minimum and maximum, we choose two data periods, 1963–1965 for solar minimum and 1969–1972 for solar maximum. Two periods are emphasized with blue histograms in Fig. 2. The number of used topside electron density profiles in this study are 62,784 and 73,908 for solar minimum and maximum period, respectively.
To identify the IMT feature in topside sounding data, we adopt the same method as in Lee et al. (2011). First, we interpolated the topside electron density profiles with an interval of 10 km in altitude. Then, we converted the geographic longitudes and latitudes of topside profiles into magnetic local time (MLT) and magnetic latitude (MLAT) by using Altitude Adjusted Corrected Geomagnetic Coordinates version-2 (AACGM-v2) (Shepherd, 2014), which can be obtained from Thayer School of Engineering at Dartmouth. Electron density data are averaged to a fixed bin with 0.5 h (MLT), 1˚ (MLAT) and 10 km in altitude for four seasons. Then, the mean values at each bin are horizontally smoothed to 3 bins (1.5 h in MLT and 3˚ in MLAT).
Unfortunately, the number of datapoints from the topside sounder was statistically not enough to investigate for high geomagnetic condition. Therefore, we analyze the data only for the low geomagnetic condition (Kp≤2) in this study.
To evaluate the plasma condition inside and outside of the IMT region, we also used Incoherent Scatter Radar (ISR) data from Madrigal database (http://madrigal.haystack. mit.edu/cgi-bin/madrigal/madInvent.cgi). The ISR dataset provides electron temperatures which can be used to compare the IMT plasma with the neighboring ionosphere. We chose two sites, St. Santin and Millstone Hill, to relate to the topside sounding data of IMT. St. Santin is located in 46˚N in MLAT and thus is considered as equatorward side of the IMT region. On the other hand, Millstone Hill is located in 53˚N in MLAT that is usually inside the IMT region. Since the ISR data coverage started from 1969 in St. Santin and from 1963 in Millstone Hill, we had to use the data only for high solar activity period, 1969–1972, in this study.
3. RESULTS
Fig. 3 shows contours of F2 peak density (NmF2) from the topside sounding data on MLT by MLAT planes for four seasons during the solar maximum period (1969–1972) with the low geomagnetic activity (Kp≤2). Electron density depletion region as the IMT appears near MLAT of 60˚ in both hemispheres during nighttime in equinox months, as in Fig. 3(a) and 3(c). On the other hand, the IMT feature is asymmetric in solstice months; it is only visible in the winter hemisphere, as in Fig. 3(b) and 3(d). Although data gaps are large in December, the electron density depletion feature seems not present in the southern hemisphere around the magnetic midnight.
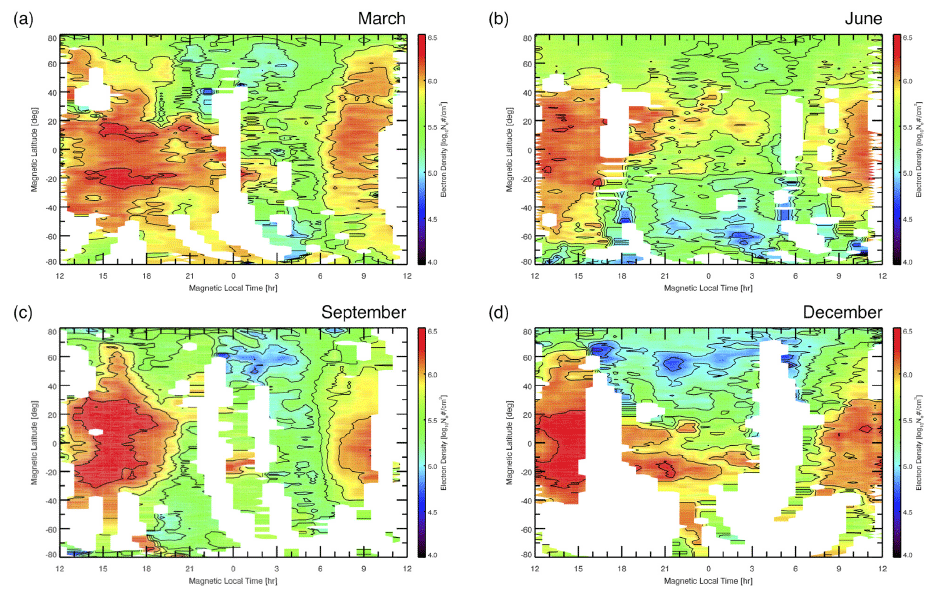
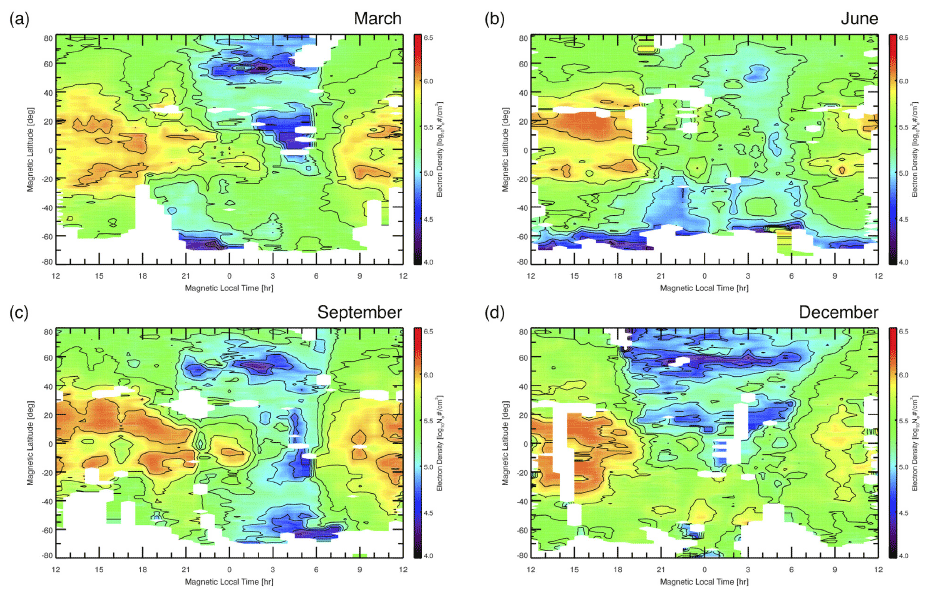
Fig. 4 is similar to Fig. 3 but for the solar minimum period (1963–1965). Generally, electron density depletion features, which are represented by blue color, are more clearly seen in Fig. 4 for all seasons than in Fig. 3. The IMT feature appears symmetrically in both hemispheres, which is similar to that for the solar maximum period, but its occurrence time is slightly different in two hemispheres. In March, the IMT feature in northern hemisphere (spring season) leans toward the post-midnight sector, while southern hemispheric IMT feature (autumn season) seems to start earlier in the pre-midnight sector. On the other hand, the starting time of the IMT seems reversed in September. In June, the electron density depletion region is stretched to almost all mid-latitude area of the southern hemisphere. However, it is difficult to determine the poleward boundary of the southern hemisphere IMT due to the lack of data. In December, two electron depletion regions appear very clearly around 20˚N and 60˚N in northern hemisphere. The depletion region near 20˚N is not the IMT feature, and thus will not be discussed in this paper. The northern IMT started near 19 MLT and lasted almost up to 7 MLT, which is different from the southern counterpart in June.
Figs. 5 and 6 show time series of 2-dimensional (2D) IMT structure in the northern hemisphere for solar maximum and minimum periods, respectively. Due to the lack of data in the southern hemisphere, we consider 2D IMT structure only for the northern hemisphere in this paper. Each panel displays electron density 2D structure of 100 km to 1,000 km in altitude and 45˚ to 75˚ in magnetic latitude. From left to right panels, each row indicates time sequence from 20 MLT to 02 MLT for each season. The IMT feature exhibits a clearer and deeper V-shape depletion between 23 MLT and 02 MLT in September than in March. In December, the IMT has lower background electron density in wider latitudes than in June. In Fig. 6, the structure of the IMT is clearly a V-shape in March and September. In March, the progress of IMT formation over time is remarkably displayed. The depletion area starts to appear in 20 MLT and becomes completely structured on 22 MLT. Then, the depletion grows deeper in altitude during the subsequent 4 hours. In September, the IMT also seems to be generated from 20 MLT, but it fades around midnight. After that, the IMT returns with deeper depletion and lasts till 02 MLT. In summer (June), the depletion feature appears only near the top altitude after 22 MLT. In contrast, deeper and sharper shape of the IMT is already formed from 20 MLT in winter (December). The 2D structure of IMT and its initiation time obviously change with seasons and solar activities, as shown in Fig. 5 and 6. Although Muldrew (1965) already noted the IMT from early data of the topside sounders, they only investigated NmF2 or electron density at a specific altitude.
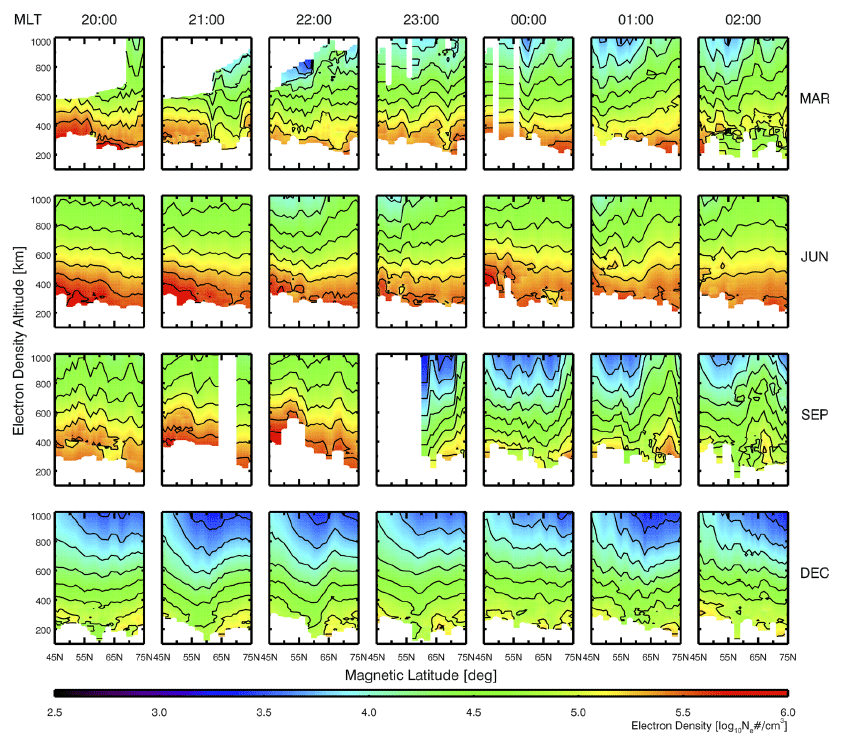
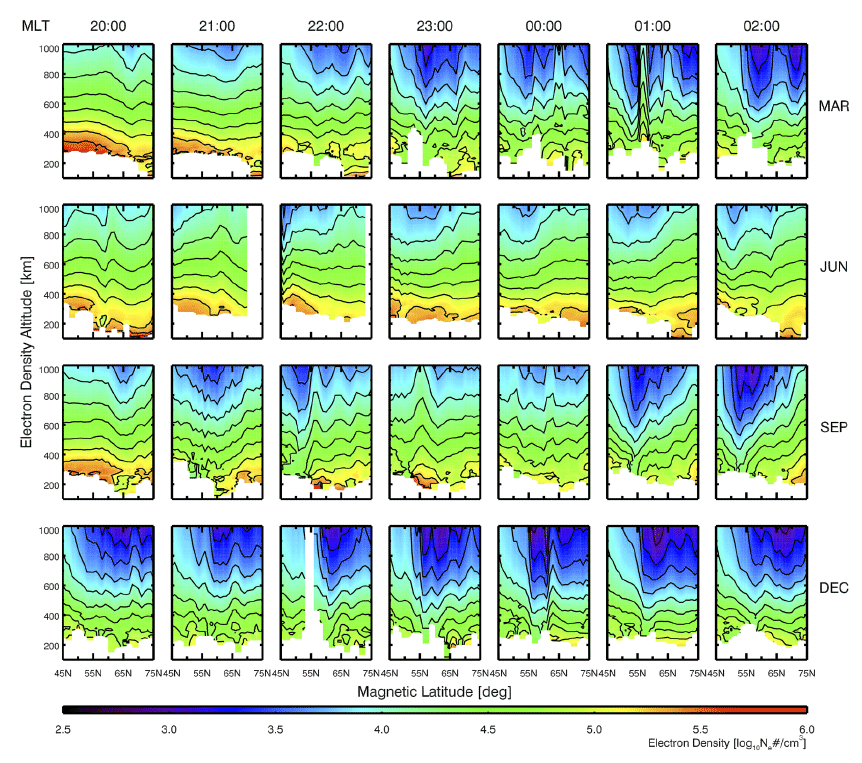
Fig. 7 shows similar 2D structures of IMT to Figs. 5 and 6, but the structure was captured from consecutive satellite trajectories not from statistically averaged profiles. Fig. 7(a) displays the northern hemispheric IMT in winter under the high solar activity and slightly disturbed geomagnetic condition (Kp=2.7). The depletion area has gentle gradients both at equatorward and poleward edges of IMT. Fig. 7(b) and 7(c) show the 2D structure in March and December, respectively, under the low solar activity and undisturbed geomagnetic condition. The IMT manifests as intense and narrow depletion down to about 400 km in altitude unlike Fig. 7(a). In addition, the density gradient is steeper at the poleward edge than at the equatorward edge of IMT, which is consistent with previous studies (Kersley et al. 1997;Pryse et al. 2006;Lee et al. 2011).

From the comparison of 2D IMT structures between the solar maximum and minimum condition, we find that the IMT feature is deeper and steeper in winter and during the solar minimum. To quantify this feature, we computed IMT depth ratios for each season and each solar condition. The IMT depth ratio is defined as follows:
where NeIMT is the lowest NmF2 between 50˚ and 70˚ in magnetic latitude, and NeNormal is NmF2 at 30˚ of magnetic latitude, the region not affected by IMT. The higher value of IMT depth ratio means deep IMT structure because of lower electron density at the IMT position than at the normal midlatitude.
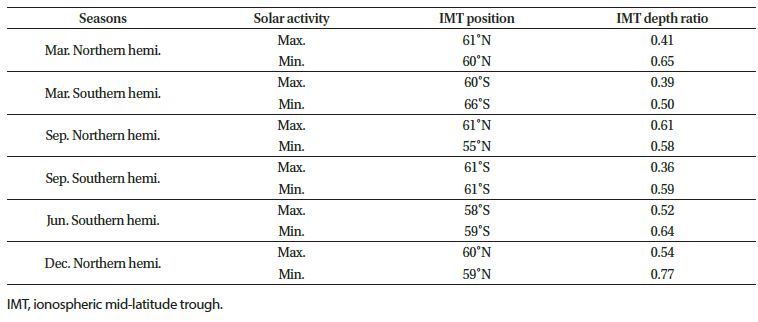
Averaged IMT positions and IMT depth ratios over nighttime (18 MLT–06 MLT) are presented in Table 1 for four seasons and two solar activities under geomagnetic quiet condition. Generally, IMT position seems invariable with solar activity for all seasons; it is located at about 60˚ in magnetic latitude, except September in the northern hemisphere under the solar minimum. However, IMT depth ratios change significantly with both seasons and solar activities. The IMT depth ratios indicate that deeper IMT structure occurs in solar minimum condition, except only one case: September in the northern hemisphere. During winter, the IMT ratio is at least 0.52 under the solar maximum condition, which is comparable to the IMT ratios during equinoxes under the solar minimum condition. In other words, the IMT is generally weak during the solar maximum but during winter it can be as strong as that of equinox months under the solar minimum condition.
|
4. DISCUSSION
Lee et al. (2011) showed 2D and 3D IMT structures from FORMOSAT-3/COSMIC radio occultation data set for the extreme solar minimum period from February 2008 to January 2009. Our study focuses on comparison of IMT structures between the solar minimum and maximum in 1960’s. We find that the IMT structure changes significantly with season and solar activities. During the solar minimum, lower background electron density in the ionosphere seems to make the traditional stagnation model work more effectively, leading to the strong and steep IMT structure, as shown in Fig. 6.
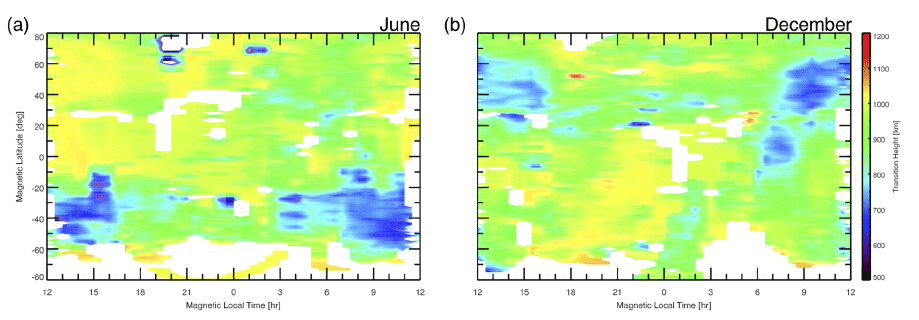
We also calculated the ionospheric transition height from topside profiles by using the method in previous studies (Marinov et al. 2004;Kutiev et al. 2006;Kutiev & Marinov 2007;Lee et al. 2016). Transition height is the altitude where the oxygen ion density is equal to the sum density of hydrogen and helium ions. Since the helium ion density is negligibly low, the transition height can be regarded as the altitude where the oxygen and hydrogen ion densities are equal. The oxygen ion density profile is assumed to have a slope in the measured electron density profile between the lowest gradient (the smallest scale height) altitude above the F2 peak and the 30% higher altitude. Then, the transition height is located where the measured electron density is twice the extrapolated value computed by the oxygen profile slope. Fig. 8 shows 2D maps of the transition height on the MLT-MLAT plane during the solar minimum period under the quiet geomagnetic condition. Normally, the transition height is higher in day time and lower in night time because dominant photoionization of oxygen expands oxygen ions upward during daytime (Marinov et al. 2004;Heelis et al. 2009;Lee et al. 2016). However, Fig. 8 shows the opposite aspect in the IMT region for both seasons. Most of night time in the IMT region, the transition heights are lifted up to 1,000 km. This implies that hydrogen ions are transported efficiently upward to the plasmasphere in the IMT region, rather than downward to fill up the ionosphere in the other normal region during nighttime. The stagnation model does not explain this abnormal upward transport in the IMT region. In addition, the IMT feature is well detected not only in the pre-midnight sector but also in the post-midnight sector, despite there is no stagnation region of plasma motion in the post-midnight region. Unknown additional processes should be involved with the occurrence of IMT.
Thus, we further investigate plasma temperatures around the IMT region measured by ISR at St. Santin and Millstone Hill. Fig. 9 presents ISR measured electron temperatures between 250 km and 350 km in altitude, around the F2 peak, for four seasons. Due to the short data coverage of St. Santin ISR, only the solar maximum period is included. Electron temperature shows very clear diurnal variation at both locations: high in day time and low at night. However, there is a distinct increase of electron temperature during winter nighttime at Millstone Hill, which is considered to be inside of the IMT region, as shown in Fig. 9(b) and 9(c). The temperature increase started around 19 MLT, peaked at midnight, and lasted up to 5 MLT. On the other hand, the nighttime electron temperature is lowest in summer. The increase of electron temperature in winter is larger in the solar minimum than maximum periods. The variation of nighttime electron temperatures is well matched with general aspects of the IMT variation with seasons and solar activities.

When the electron temperature increase, an electron moves fast, enhancing the ambipolar diffusion coefficient, Da, through following equations:
where mi is the ion mass, νin is the ion-neutral collision frequency, Te, Ti and Tp are the electron, ion, plasma temperature, respectively (Schunk & Nagy 2009). The increase of electron temperature in the IMT region should thus enhance ambipolar diffusion, which can transport ions more efficiently to the plasmasphere. The ion-neutral collision frequency in ambipolar diffusion coefficient is also given by
where A′ and B′ are constants, nn is neutral density and Tn is neutral temperature (Schunk & Nagy 2009). Since the collision frequency at a given altitude is decreased by lower neutral density during the low solar activity, the ambipolar diffusion coefficient becomes larger than during the high solar activity. The two factors work positively each other, causing fast ambipolar diffusion that can make strong upward transport of ions to the plasmasphere. It is also matched with the increase of the transition height in the IMT area, as shown in Fig. 8. Brinton et al. (1971) suggested the upward flow of hydrogen ions and helium ions along the closed trough field line at super-sonic velocity. However, even the fast ambipolar diffusion does not directly cause ion transport at super-sonic velocity because diffusion is basically a sub-sonic process. It is very suggestive that high electron temperature in winter and in low solar activity can lead to efficient transport of IMT ions from the ionosphere to the plasmasphere through ambipolar diffusion. It may be the additional process to promote and to maintain IMT after midnight when there is no stagnation region.
5. SUMMARY AND CONCLUSION
In this paper, we investigate the ionospheric mid-latitude trough (IMT) by using topside sounder, Alouette and ISIS satellites, in 1960s and 1970s. The measured topside electron density profiles allow to construct statistical 2D and 3D structures of IMT from consecutive observations. We find that the equatorward boundary of the IMT region has a gentle gradient while its poleward boundary has a sharp gradient, probably due to the auroral region. Unlike previous studies, we were able to characterize the IMT phenomena according to solar activities as well as seasons, thanks to the long observation periods. From the statistical analysis of seasonal variations, we confirm that the deeper and steeper IMT shape appears in winter, consistent with previous studies (Lee et al. 2011). In addition, our quantitative analysis of IMT depth ratio indicates that IMT feature is clearer (deeper) during the solar minimum than the maximum. The deeper IMT structure may be related to lower background electron densities of ionosphere in winter and in low solar activity. Furthermore, the O+ to H+ transition heights of topside ionospheric profiles are found to be lifted significantly in the IMT region. This implies that depletion in the IMT region may be caused by efficient upward transport of ions to the plasmasphere, unlike the traditional stagnation model in which IMT is caused by prolonged recombination of ions near the stagnation point.
We further investigate electron temperatures measured by incoherent scatter radars (ISR) outside (Santin) and inside (Millstone Hill) the IMT region. Electron temperatures at Millstone Hill show significant increase during winter nighttime. The temperature increase is larger during the low solar activity than during the high solar activity, which is similar to the variation of IMT structure. Enhanced ambipolar diffusion caused by the temperature increase may promote the IMT structure even at the postmidnight sector, where there is no stagnation point. Further studies are needed to confirm or dis-confirm this idea.
In conclusion, our analysis of both topside ionospheric profiles and ISR temperatures strongly suggests that depletion in the IMT region may be caused by fast upward transport of ions, rather than simply prolonged recombination of ions proposed by the traditional stagnation model.