1 INTRODUCTION
Meteor is a luminous phenomenon through the ionized passage formed by penetrating meteoroid into the Earth’s upper atmosphere at 70-120 km at a speed up to 70 km/s (McKinley 1961; Ceplecha et al. 1998). During the penetration, ablation and evaporation of meteoroid occur by the interaction with the atmosphere, producing strong ionization and depositing meteoric fine ashes or smoke particles in the middle atmosphere. From meteors, radar can observe three types of echoes: first, head echoes as detected in front of the meteoroid; second, specular echoes (overdense or underdense) due to meteor trajectories perpendicular to the radar beam; third, non-specular echoes as detected by plasma instability or turbulence-generated instability from meteor trails (Chau et al. 2014). In the summer polar region, meteor occurrence is concentrated near 90 km (Younger et al. 2009; Jee et al. 2014). In the summer polar upper mesosphere and lower thermosphere, meteors deposit meteoric dusts or the aerosol to produce the charged ice particles in the freezing temperature (< 150 K). The formation of the charged ice meteoric particle plays an essential role in giving detectability of polar mesospheric summer echoes (PMSE) and optical scenery of polar mesospheric clouds (PMC or noctilucent clouds (NLC)) (Cho & Röttger 1997).
A few studies have reported significant levels of electric field fluctuations or strong electric field (0.1-3 V/m) in NLC and PMSE layers (Holzworth & Goldberg 2004; Shimogawa & Holzworth 2009). The meteors or meteoric dusts also play an important role in producing upper-atmospheric electrical discharges of sprites and jets. Sprites and jets are associated with vertical electric field formation above thunderclouds (Pasko et al. 1998; Zabotin & Wright 2001). The association of sprites and/or jets with penetrating meteors including meteor showers were confirmed by the sequential observation by optical measurements (Suszcynsky et al. 1999; Kim et al. 2003; Yair et al. 2004). So far sprites or jets have been capably observed only by high-resolution optical instruments due to lasting up to hundreds of miliseconds, called transient luminous event (TLE). It is almost unable to be observed by using radar. A number of TLE has been reported occuring as high as 62.28°N over Filand (Lahtinen et al. 2012). The distinction between non-specular meteor trails and electrical jets can be made by the speed of propagation. Non-specular meteor trails are normally subject to an ambipolar diffusion at either middle or high latitude (Dyrud et al. 2002; Oppenheim et al. 2003; Chau et al. 2014). However, in the case that the speed of meteor trail propagation upward would exceed that caused either by ambipolar diffusion or by atmospheric dynamics, the term of electrical leader is used due to the duration of more than a second as well as the speed over ~a few km/s. The leader accompanied by ion motion is also distinguished from electrical streamers, which only have electron motion lasting for a few nano- to mili-seconds.
In this study we report observations of ascending leader signature in radar echoes: one is solely taking ascension with speeds exponentially decreasing from 10 km/s with increasing height, and another ascending leader occurs as following the preceding descending plasma leader (at up to ~8 km/s). This study for the first time reports an evidence of ascending plasma leader. It is interesting to estimate how long and fast the ascending plasma leader moves across the spatial domain, and to understand what force continuously exerts on the plasma leaders to move at such speeds.
2 DATA ANALYSIS
Esrange MST radar (ESRAD) operates at a frequency of 52 MHz, i.e. a wavelength of 5.77 m, and is installed in Kiruna (67.8°N, 20.04°E), Sweden. The ESRAD radar layout is set up with spaced receivers, composed with two rows by three columns of antenna subarrays.
ESRAD is in capable of measuring the horizontal traveling speed of scatterers using full correlation analysis (FCA). The “true” velocity is termed due to accounting for the effects of random changes and anisotropy in the ground diffraction pattern by employing the FCA technique. True wind speeds provided by FCA technique is in good agreements for ≤ 150 m/s with those from imaging Doppler interferometry (within 10 %) (Holdsworth & Reid 2004), and generally with those of alternative techniques including Doppler beam swinging (DBS) (Holdsworth & Reid 1995, 2004). Meteor echoes are usually extremely strong. They can be detected not only in the nominal “half-maximum” of the main lobe, but also in side lobes. The radial velocity will generally include a significant contribution of the horizontal component of high penetrating speed of meteors. Here we use the data measured in the fca_150 mode, which uses 4,688 Hz PRF with 128 coherent integrations, giving a 0.027 sec time resolution, 150 m height resolution. The 2nd height aliasing corresponds to a height range of 65-93 km, which is used to resolve meteor occurrence. Nonetheless, the peak occurrence is usually observed at 90 ± 10 km (Younger et al. 2009). Statistically the possible occurrence on the meteororiginated radar echoes below 80 km is less than 0.01 % (Park & McIntosh 1967). For more details, of the radar and operating modes, see Kirkwood et al. (2007) and Lee et al. (2014).
ESRAD has an interferometric capability to track the spatial location of echoes (within zenith angles of about 10°) and the speed of growth of meteor trails. In this, the change of horizontal displacement of meteor trail can be resolved by using phase difference between two receivers along E-W or N-S direction (e.g, Sato et al. 2000; Chau & Woodman 2004; Hunt et al. 2004; Sparks et al. 2010). The real height profile of meteor trail can be derived by subtracting the horizontal displacement change from the range.
3 VERTICAL TRANSIT RADAR ECHOES
By ESRAD two types of long-lasting and fast-moving meteor trail echoes are observed: one is solely upward, and another is a simultaneous view of two motions of upward and downward propagations, which likely merge at a point approaching from the opposite directions.
The non-specular echo, occurring at 02:01 in June 10, 2008 (day = 162) as shown in Fig. 1(a), is an observation of echo target apparently having an upward motion. The upward motion can be verified with tracking maximum echo power movement taking upward as shown in Fig. 1(b). In Fig. 1(c), spectrogram shows power spectrogram becoming wide with increasing range. This implies turbulence increases with increasing range. The strongest spectral power occuring at the highest range could be observed from specular echoes. In Fig. 1(d), phase difference in E-W direction is shown, and the gradients rapidly decrease with respect to time, while in N-S direction phase difference change is very small (not shown). This implies that the echo target starts with making large horizontal displacements with a high speed but rapidly slowing down with respect to time, while it makes upward launch.

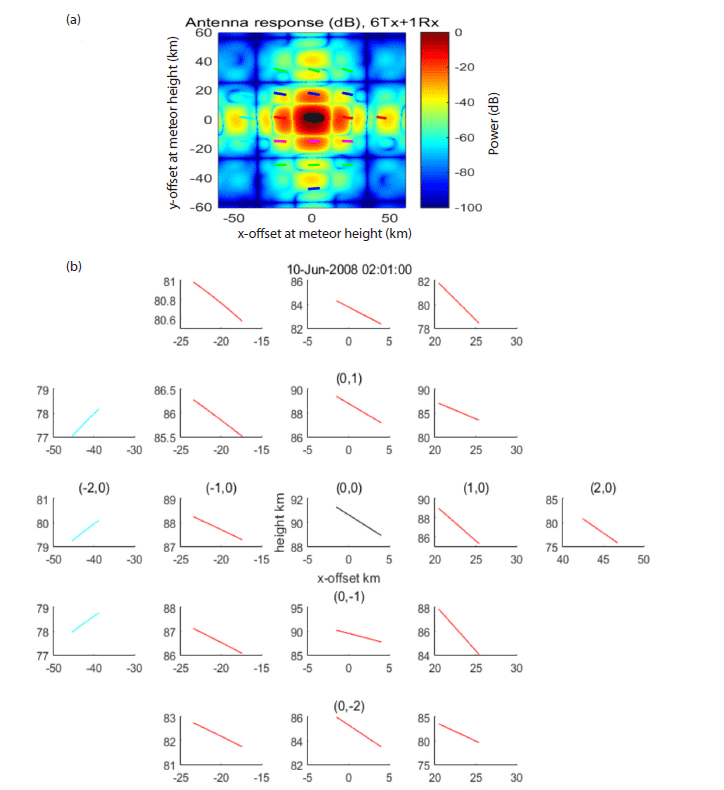
The echo target can be observed either in the main lobe or in a side lobe as shown in Fig. 2(a). The distance increases by 2π to the next side lobe. As shown in Fig. 2(b), real heights of echo target are variable according to horizontal offsets against x-axis (E-W direction) and y-axis (N-S direction), so that for example, an occurrence in the main lobe is noted with a factor coordinate of (fx, fy) = (0, 0), and in case that occurrence is at third side lobe in negative y axis, it is noted with (fx, fy) = (0, -3). Here, in case that echo target occurs +2π away from the radar in E-W direction (for (fx, fy) = (1, 0)), meteor trail can be possibly launched at 85.5 km and reaching 88.7 km; if it would occur -2π away only to N-S direction ((fx, fy) = (0, -1)), the extension would be spanned from 87.7 km to 90.2 km. As the occurring location is further away from the radar, the height tends to decrease. Therefore, for an occurrence at a factor coordinate of (fx, fy) = (0, 0) (in main lobe), the height range corresponds to 88.9-91.3 km, and for (fx, fy) = (0, -3) (third sidelobe in y axis) corresponding to 75.7-78.2 km. The meteor echo power is observed with high enough to be identified, the occurrence could not be beyond second sidelobe.
From the phase difference as shown in Fig. 1(d), horizontal displacements of echoes can be traced. In Fig. 3(a), horizontal displacements are depicted in horizontal domain relative to radar zenith. The echo mainly moves along the E-W direction (Zenith-x) in the horizontal spatial domain. As shown in Figs. 3(b)-3(c), height transits after subtracting horizontal displacements are plotted with respect to zenith-x and relative time, respectively. The echo transit takes vertically upward as far as 4 km with decreasing the gradient of vertical displacement, lasting for 3.5 sec (Fig. 3(b)); at the same time the echo target also takes horizontal transit more than 5 km distance along the E-W direction (x-axis) (Fig. 3(c)).
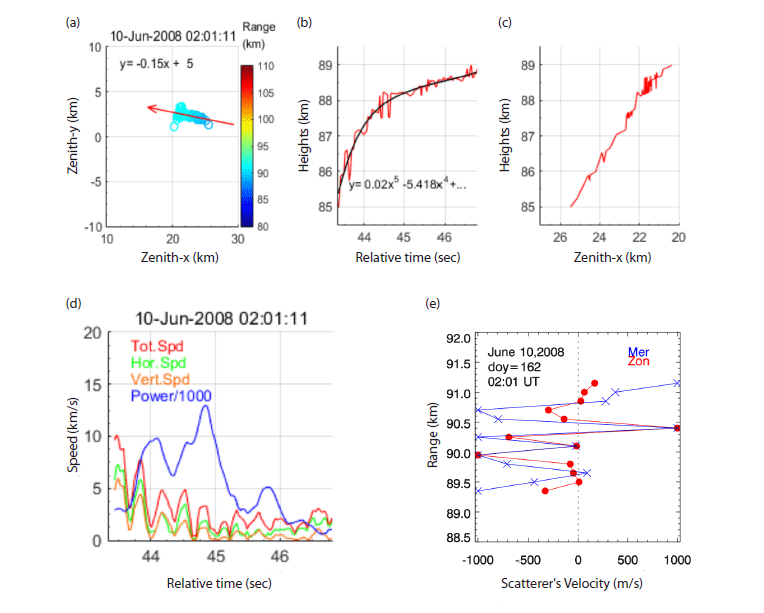
As a result, the total (red), horizontal (green) and vertical (orange) speeds exponentially decrease in oscillation from 10 km/s down to ~3 km/s with slopes of -0.7 ~ -1.5 (for exponential function) with respect to time as shown in Fig. 3(d). Here the echo power (blue) increase while speeds decrease. The interferometrc analysis provides the horizontal speed range at 10 km/s down to 3 km/s for the moving scatterer.
As shown in Fig. 3(e), horizontal velocity profile resolved by FCA technique is plotted in the original range of meteor trail as observed. Usually the velocity derived by FCA technique is used to obtain background neutral velocity. However, speeds over 300 m/s in the mesosphere can be supersonic in such a low temperature less than 150 K, not coming from the background wind field but from the fast moving scatterers (i.e., plasma clouds). The cutoff velocity in meridional and zonal directions is a value of 1,000 m/s due to the limit of resolving capability of the FCA technique. Therefore, scatterers at velocities of 1,000 m/s in a profile would take fast horizontal motion exceeding 103 m/s at each direction with taking upward motion. Thus, the interferometry analysis giving speeds of 3-10 km/s could be reasonable in comparing to the results from FCA method.
As a single event, the echo target takes jump upward as high as 4 km with taking horizontal displacements (~5 km) along the E-W direction. It is noticeable that the event is solely launched vertically upward and the moving distance rapidly decreases with respect to time. Thus, the speed exponentially decreases as climing up. It could be reasonable in that gravity force has the plasma motion upward to be slow down.
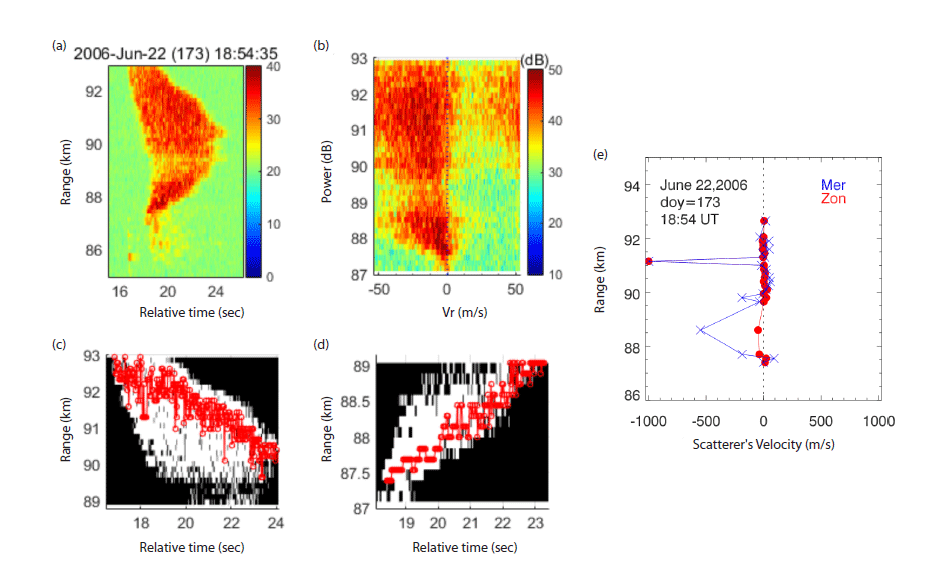
Both the leading downward and the following upward transit echoes are observed. Fig. 4(a) shows an echo target apparently taking downward and then followed by upward transits as suspected from slopes appearing with respect to the leftmost time as observed at 18:54:35 UT on June 22, 2006 (day = 173). The signal power is greater than that of normal PMSE at 30-35 dB above the noise level (not shown here). In Fig. 4(a), a moving downward starts actually above but seen from 93 km range, so that the target is assumed as started at 16.8 sec from 93 km range, followed by an echo target moving upward in 1.5 sec (at 18.3 sec) as launched at about 87 km. In Fig. 4(b), spectrogram is shown for whole targets with respect to radial velocity. Here, radial velocity is mostly negative through the range. The coexisting large positive radial velocities at 91- 93 km are likely of the portion of larger negative values than -50 m/s. It might be caused by a folding effect as based on an interval appearing at velocities of 10-20 m/s. The echo taking on mostly negative radial velocities implies that echo motion goes away from the radar. Negative radial velocities distributed from zero (0) to -50 m/s (and beyond) occur at ranges of 91-93 km, among which the wide range of radial velocities beomes narrow as the target descends. This implies that the largest turbulence occurs at 91-93 km, gradually decreasing as decreasing the range. Here, for the bottom side target (87- 89 km ranges, upward transit in Fig. 4(a)), the radial velocity is also predominantly negative (plasma motion going away) but weaker than that of upper echo target. Mean radial velocities (not shown) of spectrogram from upper to lower targets are almost in a linear decrease although spectral power to some extent becomes weakened near 89-89.5 km. Resultedly, large turbulence tends to decrease as decreasing the range from 93 to 87 km. For the echo as shown in Fig. 4(a), meteor head echo can be detected by following the leftmost line as done for nonspecular meteor trail (Dyrud et al. 2002). In another method, maximum echo power (max-power) can be used to trace head echo movement. In case max-power would be traced from 93- 87 km in consideration as a single target, the trace oscillates up and down to a vertical distance more than 4 km between ~88-92 km (not shown). The non-linearly propagating echoes between heights are too complicated to understand as it is, so that to simplify the analysis the target is separate into two parts: one is the upper part, and another is the lower part from a height of ~89 km. As shown in Fig. 4(c), max-power of upper target is started at the leftmost, and shifts to the rightmost at ranges of 92-93 km as time goes on; below 92 km it is delayed to the latest time at each range, where the power suddenly drops. By this, the property of observed echo is clearly distinguished from that of usual meteor trail, which has maxpower at the lowest in the range spread by producing a track at leftmost line (Dyrud et al. 2002). As shown in Fig. 4(d), for the lower part echo target, maximum echo power is traced, moving upward with respect to time. This max-power echo trail tends to occur at the rightmost in each range similar to that of upper part target. The max-power appearing at the latest time is also not easily explained with the traditional meteor head echoes (Dyrud et al. 2002). In Fig. 4(e), horizontal velocity profile as resolved by FCA technique is plotted. During downward transit at ~91.2 km meridional and zonal velocities exceed 1,000 m/s. In addition during upward transit at ~88.7 km, meridional velocity of 520 m/s occurs. A plasma velocity over 300 m/s (supersonic) can be caused by explosive events or strong electric field (Lee et al. 2014). It is more discussed in Section 4.
As asummed the echo target occurring nearest to the radar, the horizontal displacements in radian can be described in horizontal space in kilometers with respect to E-W (x-axis) and N-S (y-axis) directions from radar zenith as shown in Figs. 5(a) and 5(b) (left), which corresponds to upper part (moving downward) and lower part echo (moving upward), respectively. In Figs. 5(a) and 5(b) (center), vertical transit through real height is plotted after subtracting horizontal displacements with respect to time: red is for a height transit derived from max-power, and blue is for height transit derived from the foremost echoes at each range (Fig. 4(a)). By resolving moving average per 0.1 sec vertical transit speeds reach up to 4.55 km/s (1.94 km/s), and the horizontal speed reaches at most 5.4 km/s (3.4 km/s) with averages of 1.31 km/s (1.21 km/s), and total speed reaches up to 7.55 km/s (4.36 km/s) with averages of 2.55 km/s (2.08 km/s) for downward (upward) propagating echo target. The total horizontal moving distance in N-S direction (zenith-y, Figs. 5(a) and 5(b) (right)) is about 4 km (3.5 km) lasting for 7.2 sec (5 sec) for downward (upward) propagating echo target. The foremost down/upward echoes (left-most lines) meet at ~88.25 km height as shown in Figs. 5(a) and 5(b) (center) in blue lines.
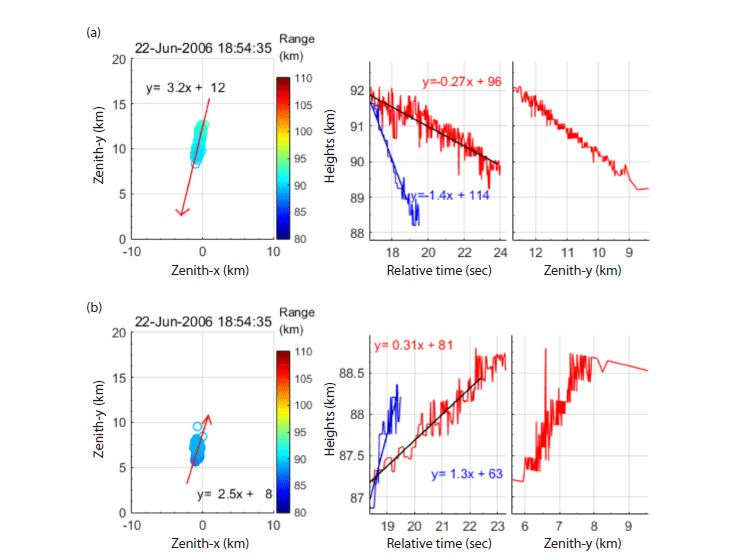
As shown in Fig. 6(a), the received signal power decreases as increasing horizontal offsets. Therefore, signal power response of antenna becomes maximum at the center (main lobe) and decrease every 2π (side lobes) as being away from the radar zenith. It is interesting to consider whether upper and lower echo targets are associated or independent. The upper and lower echoes propagate downward and upward toward the middle of the height. In this, the echo occurring height can be decided as below. The antenna power with no inflection points and the echo hierarchy kept for upper target locating higher than lower echoes are limited to factor coordinates of (fx, fy) = (0, -2), (0,-1), (0, 0) or (0, 1) as shown in Fig. 6(b). According to the coordinate, the occurring height as traced with max-power can be derived as possibly at 92.7-89.3 km or 81.2-79 km (upper echo target) and 86.8- 88.4 km or 76.5-77.6 km (lower echo target), and for the left most line the heights are possibly at 92.4-88.0 or 81-77.9 km (upper echo target) and 86.5-88.0 km or 76.3-77.2 km (lower echo target). This is from the assumption that two parts of echo targets occur within the same radial distance in a factor of 2π from the radar zenith, coming across at ~89 km range.
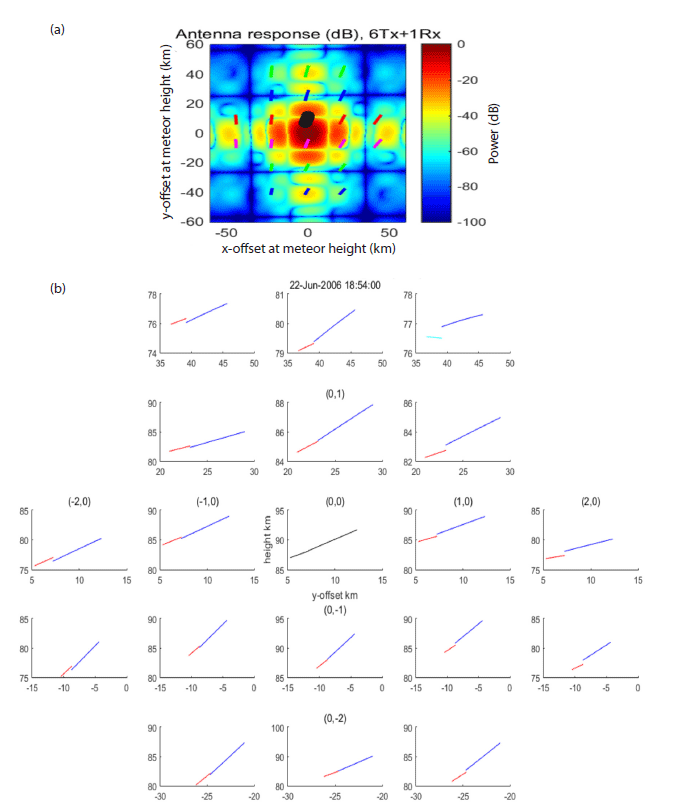
In case the lower part target is independently launched to the upper target, the transit speed should rapidly decrease by suffering from gravity force (see Figs. 1(a) and 3(b)). However, as shown in Figs. 5(a) and 5(b) (center) the upward path including downward path straightly forward as passing time so that the speed is to some extent constant. The upper and lower targets are possibly associated for the former leading and for the later following in ~1 sec (Fig. 4(a)).
4 INTERPRETATION
It is worthy of searching for the source to produce the observed vertically fast-moving echo targets. Meteor, meteor fireball, a fume of fireball and electrical leader are discussed as possible candidates as following. Firstly, meteor could be the source. For the echo in Fig. 1(a), the upward propagating target is at speeds of 10-3 km/s as traced by max-power. For the echo in Fig. 4(a), maximum echo power keep moving to the rightmost time edge at 92-93 km, it keeps occuring at the rightmost edge at each range below ~92 km. It is differentiated from usual meteor trail since echo power of usual nonspecular meteor trail decreases as time passes according to diffusion theory (Chau et al. 2014). In the aspect of speed, mean transit speeds of 2-10 km/s is difficult to consider as meteor head echo (10-70 km/s) or non-specular meteor trail echoes (Dyrud et al. 2002).
Secondly, it might be an observation of meteor fireball. The observed echo target (Fig. 4(a)) has foremost descending echoes ahead of maximum echo power descending. The strongest power descends at latest. It is unlikely to be fireball, of which a clump of cohesive plasma goes forward together, and the trail of nonspecular echoes would be left behind for further ionization to be less echo power (Park & McIntosh 1967).
Thirdly, the upward propagation (Figs. 1(a) and 4(a)) might be an observation of upward fume spouted out from meteor fireball explosion. However, the speed over 2 km/s persisting for 3 sec – 5 sec is not attained by atmospheric diffusion process, which gives a diffusion coefficient less than 4 m2/s (Chau et al. 2014). In addition, the total transit speed is much greater than that (150 m/s) of atmospheric dynamics in capable of generating.
Fourthly, the observed echoes can be possibly explained with electrical jet or leader. The thing that meteor may trigger sprites is firstly suggested by Muller (1995). A possibility of meteoric dust to evolve to sprite formation is demonstrated so that lightning current would be impinged from thundercloud top to the ionosphere (Zabotin & Wright 2001). An explosive light curve of meteor as a signature of fireball is mostly observed at least 90 % out of the observations of high time resolution photometers composing 16 sites of an autonomous fireball observatory (Spurný & Ceplecha 2008). Spurný & Ceplecha (2008) suggested that the passage of a meteoroid can cause charge separation between the meteoroid body itself and the plasma trail behind. Meteor-triggered sprites or jets are confirmed by sequential optical measurements of meteor, sprites and then upward jets (Suszcynsky et al. 1999). It is interesting that the observed echoes are composed with not only downward transit but also upward transit echoes. The time of observations in this study is on June 10, 22, which are not directly related to any meteor shower. The role of sporadic meteor is considerable, known for contributing the 75 % of total meteor influx (Ceplecha et al. 1998). In general columniform sprite (C-sprite) in association with meteor is usually produced at currents of 23-100 kA produced by positive CG lightning (Wescott et al. 1998; Symbalisty et al. 2000). A meteor traveling at 13-20 km/s may produce a line density of n = 1012-1014 electrons cm-1 at 75-85 km altitudes (Ceplecha et al. 1998). A theoretical model has been suggested by Symbalisty et al. (2000) to explain the production of electrical discharges including sprites and jets from the penetration of meteor. In this, by meteor ablation the ionization of meteor trail is enhanced for a short duration, and at the same time a number of aerosol is deposited. As a sequence, the aerosol deposition reduces the ionization level to induce a significant reduction of conductivity. The lightning stroke initiates a runaway breakdown to induce electron avalanche from the cloud top to the ionosphere (Roussel-Dupré & Gurevich 1996). When the electron beam passes through the atmospheric volume of a reduced conductivity, it enhances the number of electrons, ceases the electric field, and comes to the end of the discharges. The electrical discharge occurring through meteor trail can be applied to approximately below an altitude of 85 km, in which the conductivity is mainly controlled by ions.
As considering the observed echoes (Figs. 1(a) and 4(a)) are caused by the similar mechanism suggested as above, the solely upward echo (Fig. 1(a)) possibly occurs in the main or first side lobe in x-axis and the second side lobe in y-axis; the downward and upward moving echoes (Fig. 4(a)) possibly occur in the first (second) side lobe in x-axis and the second (first) side lobe in y-axis, as assumed the occurring within heights of 75-85 km. In order to cause the meteor trail leader echoes, the lightning stroke may be originated either from tropospheric lightning or from the top of PMC clouds. Based on WWLLN data, there is no lightning occurrence observed near 02:01 on June 10, 2008. By the way, before the meteor trail observed at 18:45 on June 22, 2006 there are observations of lightning with currents at least 30 kA at 18:15:08 at 68.4°N and 22.01°E and at 18:32:45 at 67.4°N and 22.6°E, so that 39 min and 22 min ahead of the radar echo (Fig. 4(a)) observed with downward and upward transits. The time difference of 22 min is likely too large for the tropospheric lightning to directly trigger an upper atmospheric electrical discharge due to the usual connection claimed for a time difference up to a few tens ms (Symbalisty et al. 2000). Then, top of PMC clouds is a potential candidate to generate lightning-like electrical discharge at a few kA to a few tens kA. In PMC a mesospheric lightning has been suggested to occur from the observation of supersonic bursts at 557.7 nm at least lasting 8 sec (Lee & Shepherd 2010). Electrical discharge can last as long as the electrification lasts or charged electrons/ions are supplied at the ends of electrical discharge column. The observed speeds up to 10 km/s is as a modest speed still comparable to that of electrical leader (~104 m/s).
By theory, in electrical discharge, plasma streams can be classified into cold and hot plasma channels. The property of cold plasma is transient in lasting for μs to ms from experimental results (Becker et al. 2004), while the hot plasma is usually capable of increasing neutral and ion temperature up to electron temperature. According to Becker et al. (2004), for example, a lightning stroke can increase temperature up to 30,000 °C (Uman 2001). The persistently upward moving echoes lasting for 3.5 and 5 sec as observed in Figs. 1(a) and 4(a) provide possible signatures of plasma echo trail propagating through a hot plasma channel. Therefore, the observed echo trail can be a movement of electrons as well as ions, comparable to the hot plasma channel of leaders and strokes occurring in tropospheric lightning discharge.
This study suggests, for the observed non-specular meteor trail, discharge as a new type of meteor trail leader. Therefore, it is a challengeable to understand how the strong electric field can be supplied for a relatively long duration of about 7 sec, including the unobserved altitude region over 93 km.
5 SUMMARY AND CONCLUSIONS
Unusual, non-specular, fast-moving upward meteor trails are observed by ESRAD at Kiruna, Sweden. Interferometric capability of the radar allows us to resolve the spatial geometry of the meteor trail as horizontally and vertically elongated above 75 km, and horizontal speeds of the propagating plasma trails in addition to FCA technique.
Both solely upward moving (Fig. 1(a)) and bidirectional moving (Fig. 4(a)) non-specular trail echoes are observed. As for solely launched upward-motion plasma trail, gradients of horizontal displacements decrease with time, so that the upward and horizontal speeds exponentially decrease as climbing upper heights, in total from 10 km/s down to 2 km/s. The decelerating propagation is possibly caused by gravity force effect. The echo trail with downward and upward propagations have total speeds of 7.55 km/s and 4.36 km/s, respectively. A launching of upward transit is likely delayed in ~1 sec after the downward transit having been initiated. In this case, the upward transit speed (Fig. 4(a)) is likely not hampered by frictional effect or gravity force, linearly maintained, different from solely launched upward transit echo (Fig. 1(a)). This supports the upward transit echo may be led by the downward transit echo, so that the former could be a passive response to the later as active.
The upward propagating plasmas cannot be explained with meteor or meteor fireball but explained with electrical leader running through hot plasma channel based on long durations of 3-5 sec. Therefore, this possibly gives the evidence that electrical leaders occur in the D-region ionosphere and the mesosphere in the summer polar region. It is remarkable that long-lasting electric field can be sustained for 3.5 - 7 sec, longer lasting than any electrical leader discharge occurring above thunderstorms (< 400 ms). Therefore, this study suggests the non-specular meteor trail discharge is a new type of meteor-trail leader discharge occurring in the summer polar upper mesosphere.