1 INTRODUCTION
The geometry of the Earth’s magnetic field causes the polar upper atmosphere to have very different physical characteristics from the mid- and low-latitude atmosphere. An enormous amount of energy is released from the Sun and transferred to the Earth’s upper atmosphere via interactions between solar winds and the magnetosphere. This energy produces a number of important phenomena in the upper atmosphere of polar regions such as large-scale plasma convection, Joule heating via ion-neutral collisions, enhanced plasma density, and auroras by energetic particles. The impacts of solar energy are not limited to the polar upper atmosphere, but can be effectively transferred to the midand low-latitude regions through global circulation.
The Korea Polar Research Institute (KOPRI) has been operating several ground-based instruments at the King Sejong Station (KSS), Antarctica to study the mesosphere and lower thermosphere (MLT) dynamics and energetics since 1989 (Jee et al. 2014). Although the KSS has been contributing to the understanding of neutral winds and temperatures as well as atmospheric wave activities in the upper atmosphere in the Southern high-latitude region, the station is inherently limited by its low magnetic latitude (53°S MLAT) for the studies of the polar upper atmosphere such as ionospheric convection and auroras. In order to expand our research capability to the polar space environment, the Jang Bogo Station (JBS) was established at Terra Nova Bay in North Victoria Land, Antarctica (geographic: 74.62°S, 164.22°E / geomagnetic: 79.87°S, 53.56°W) in February 2014. JBS is mostly located inside the polar cap region, and depending on the local time and magnetic activity, can be in the polar cusp and auroral region. The geomagnetic location of JBS enables us to study various phenomena in the polar region. In this article, we briefly describe the ground-based observational instruments operating at JBS along with some preliminary observation results.
2 INSTRUMENTS
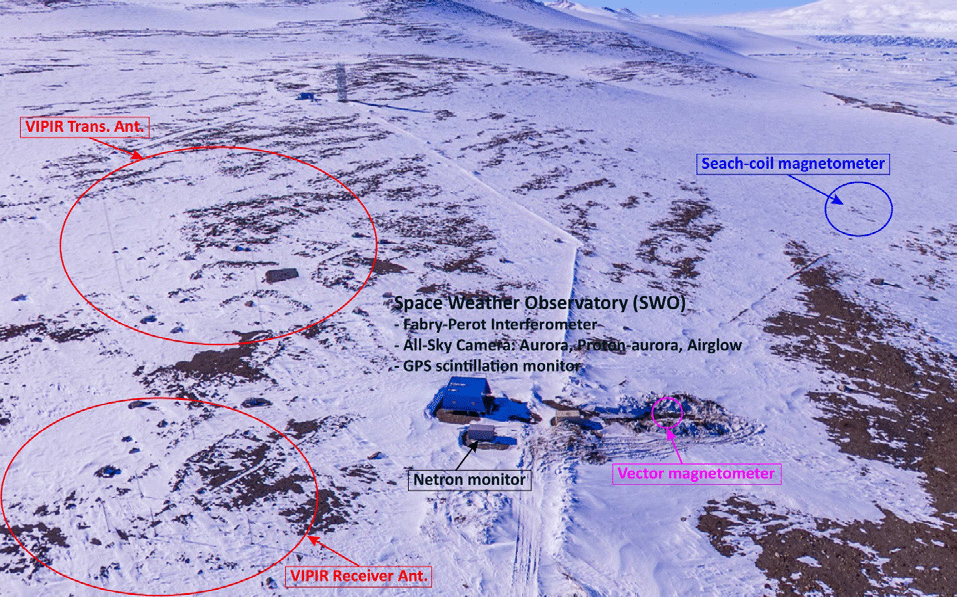
Ground-based observations at JBS began in March 2014 for neutral winds and temperature measurements using the Fabry-Perot Interferometer (FPI). For comprehensive studies on magnetosphere-ionosphere-thermosphere (MIT) electrodynamic coupling in the polar region, ionospheric radar and magnetometers have additionally been installed and are operational. Fig. 1 shows an aerialview of the Space Weather Observatory (SWO) and the locations where the radar antenna, magnetometers, and neutron monitor are installed. All the optical instruments are installed inside the SWO located about 500 m north from the main building to avoid artificial light pollution from the main station. In this section, we introduce the instruments operating at JBS.
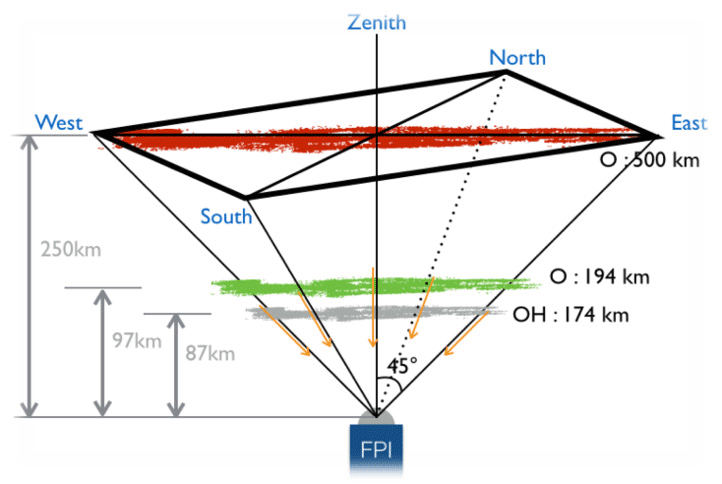
FPI has been used to observe neutral winds and temperatures from the upper mesosphere to the mid-thermosphere over JBS since its installation in March 2014. As JBS is mainly inside the polar cap region (~80°S in magnetic latitude, MLAT), the FPI provides invaluable information on the effects of interactions between solar winds and the Earth’s magnetosphere on upper atmospheric dynamics and temperatures. The JBS FPI was developed by the High Altitude Observatory (HAO), National Center for Atmospheric Research (NCAR), and currently operates with three optical filters to measure airglow emissions at altitudes from 87 km up to 250 km, as shown in Fig. 2. It is a high-resolution spectrometer capable of detecting small wavelength shifts with a 10 cm clear aperture etalon. For each observational cycle at a given filter, the sky-scanner on top of the FPI collects airglow emissions from four azimuthal directions (0, 90, 180, and 270) at a zenith angle of 45º and from the zenith. A more detailed description of the geometry and optical parameters of the FPI observations can be found in Wu et al. (2004). After the incident light passes through the etalon in the FPI optics, 2-D fringe interferometric patterns are formed. The neutral winds and temperatures can be estimated by measuring the Doppler shifts and broadening of the fringe profiles, respectively.
According to Lee et al. (2017), the green-line airglow emission (557.7 nm) over JBS are severely affected by greencolored aurora with an identical wavelength above the airglow emission layers. This leads to neutral winds following ion-convection patterns with a period of 24 hours that do not appear in the MLT winds from meteor radar observations in the southern high latitude region. To investigate ionneutral coupling in the mid thermosphere at a finer temporal resolution, we have limited the FPI measurements to the 630.0 nm emission line in 2018 and this has enabled us to observe neutral wind and temperatures every 15 min.
An ionosonde is radar used for observing the state of the ionosphere and has been extensively used for real-time monitoring of the ionosphere over the globe since the 1920s. Essentially, ionosondes measure the height of ionospheric layers by measuring the time it takes for the transmitted signals to return from the layers. Several types of ionosondes have been developed by independent research groups. The ionosonde system installed at JBS consists of a Vertical Incidence Pulsed Ionospheric Radar (VIPIR) and Dynasonde analysis software. The VIPIR is a high performance highfrequency (HF) radar system developed by Scion Associates. It is composed of a 4 kW peak power solid state transmitter that generates precise amplitude and phase radio-frequency (RF) signals and a transmitted waveform amplitude (Bullett et al. 2010, 2016). The VIPIR transmitting antenna is a dual vertical incidence log periodic antenna that is supported by four 35 m towers as described in Fig. 3(a). It operates in the frequency range of 0.5 to 25 MHz. The receiving an-tenna has an interferometric array with 7 orthogonal 4 m active dipole antennas as shown in Fig. 3(b). The hardware configuration is illustrated in Fig. 3(c). The In-Phase and Quadrature data received by the VIPIR hardware are analyzed by the Dynasonde software that conducts echo recognitions and ionogram inversions. The recognized echoes are characterized by physical parameters such as amplitude, polarization, two angles of arrival, stationary phase group range, average phase, and their respective error estimates. Using these echoes, the ionogram inversion is conducted by using the ‘NeXtYZ’ 3-D ionogram inversion software that uses a numerical ray-tracing method with a Wedge- Stratified Ionosphere (WSI) model. The NeXtYZ is capable of deriving not only the general vertical electron density profile, but also the horizontal gradients and general tilts (Zabotin et al. 2006).
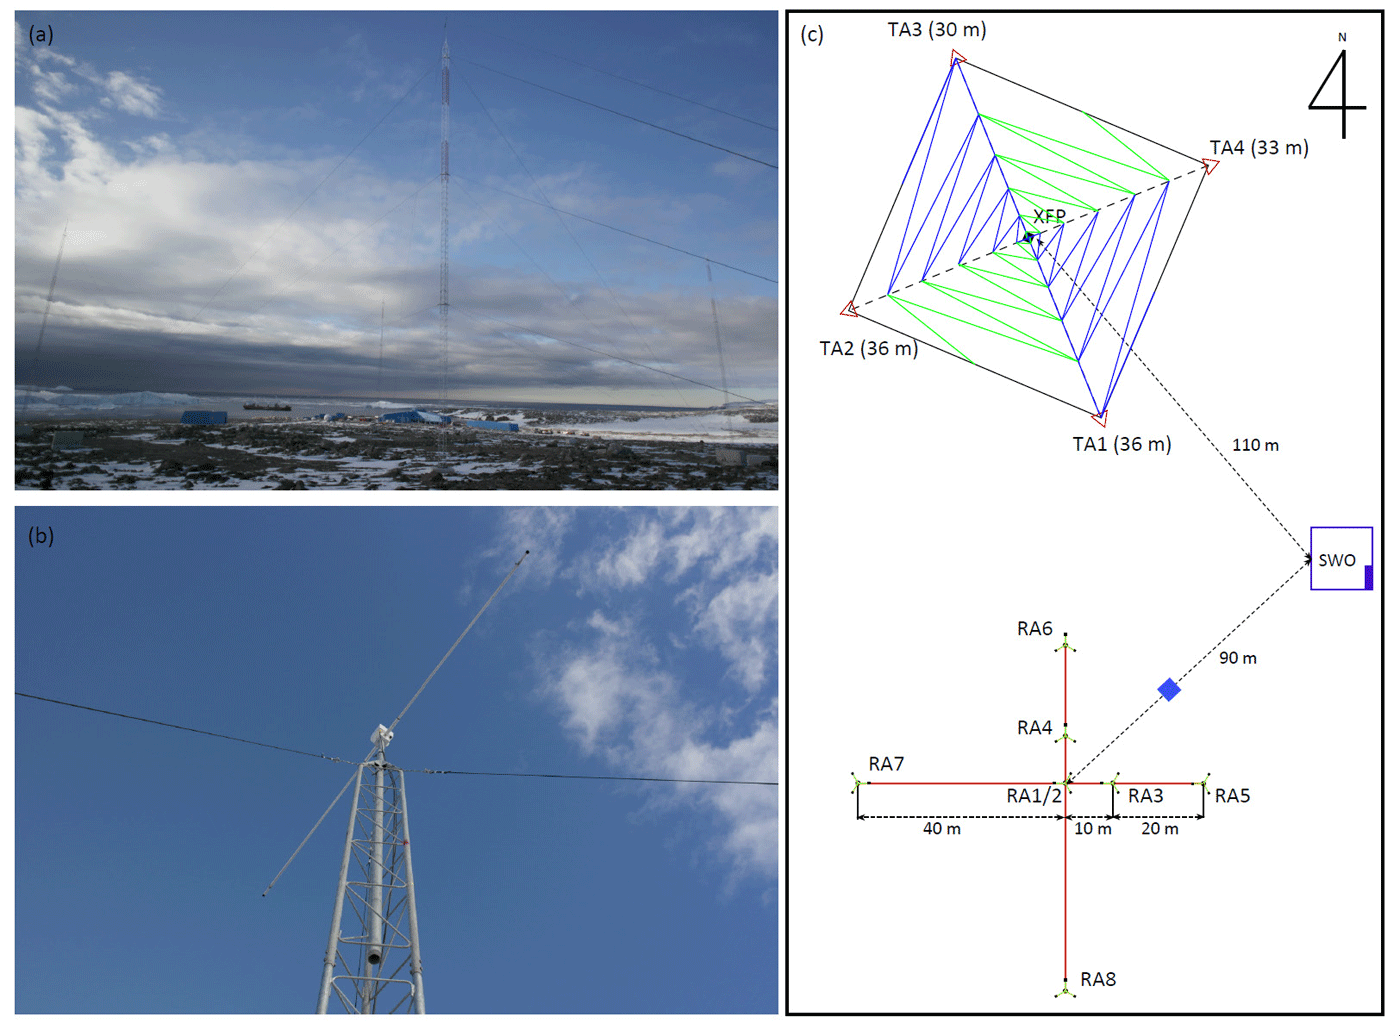
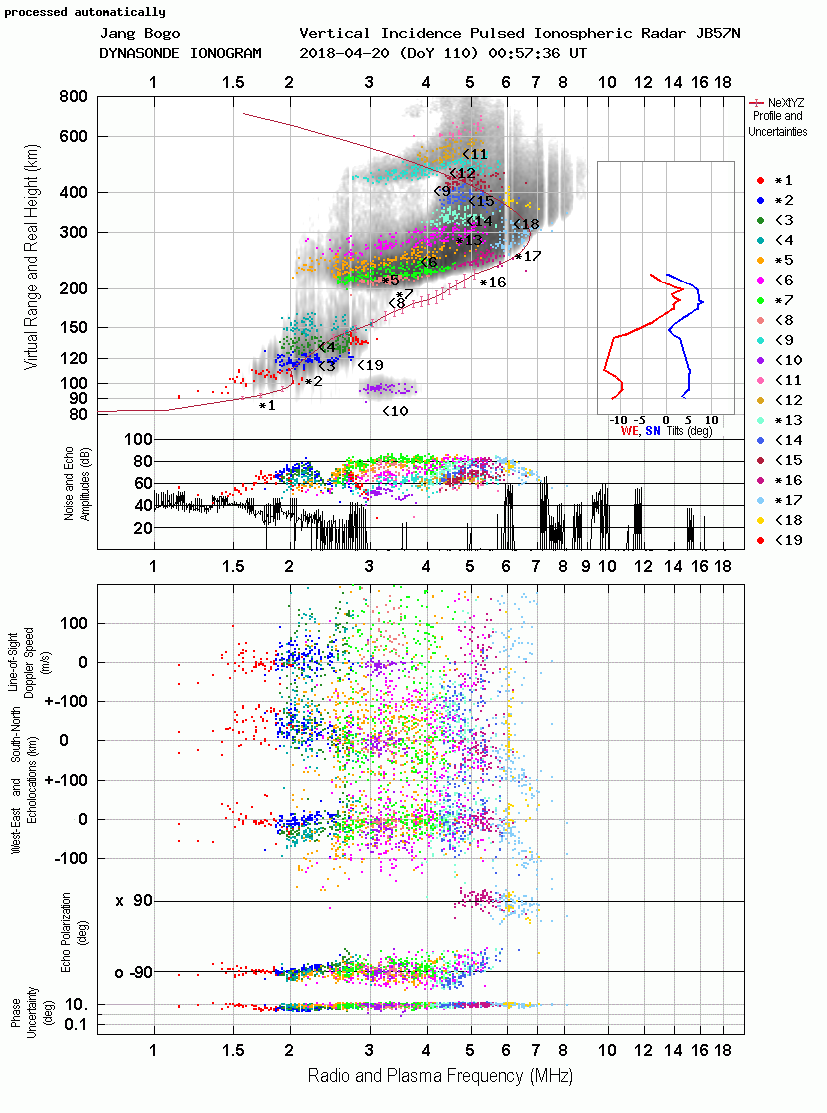
Fig. 4 shows an example of an ionogram from the JBS VIPIR at 00:57 UT on April 20, 2018. The ionogram can be divided into two parts based on the characteristics of the echo. The upper panel shows the electron density profile in a log-log coordinate system, tilt angle, and echo/noise amplitudes. The gray dots indicate echoes reflected from the ionosphere with virtual heights and the red solid lines depict electron density profiles with real heights. In the VIPIR, the reflected echoes are classified according to their physical features. Echo traces are ordered by number and distinguished by colors that appear on the right side of the electron density profiles. The asterisks indicate the traces selected for the inversion procedure. The local tilt angles from the NeXtYZ in the small rectangular box are the variations of the local 3-D tilt of the ionospheric layers. The red and blue lines represent the ionospheric tilt in the meridional and zonal directions, respectively. The scatter plots in the bottom panel are the Doppler speeds along the line of sight in m/s and the horizontal echo locations. The polarization of the echoes and the phase information are also plotted in the bottom panel. The information in the bottom panels was derived from the selected upper panel echo traces.
Even though the VIPIR was installed during the 2014- 2015 summer season, successive long-term observations could not be performed until 2016 because of physical damage to the receiving and transmitting antennas that resulted from low temperatures and severe winds. After repairing the antennas, normal operations resumed in January 2017 and successful consecutive observations are currently being conducted. The JBS VIPIR currently uses a Dynasonde B-mode pulse set with a temporal resolution of 2 min.
Earth’s magnetic field is affected by the variations in the space environment. Therefore, geomagnetic field measurements have been widely used for space research. There are two kinds of magnetometers used at JBS; a search-coil magnetometer (SCM) and a vector magnetometer. The magnetometers have different targets. The SCM measures the magnetic field variations (AC field), while the vector magnetometer measures the magnitude of the magnetic field strength (DC field).
The SCM was developed by the Kyung Hee University in collaboration with the University of New Hampshire and was installed during the 2016-2017 austral summer season. The SCM consists of two magnetic sensors (Fig. 5(a)) assembled orthogonally to sample the AC magnetic field (dB/dt) in the horizontal components, and magnetically northward (X) and magnetically eastward (Y) at a rate of 0.1 s (Shin et al. 2016). The SCM was placed on the east side of the SWO at a distance of ~250 m to avoid artificial noise. Fig. 5(b) illustrates the SCM system configuration. Signals measured by two sensors flow into a junction box outside of the SWO that are then amplified and transferred to a control box along the main cable. The signals are then converted from analog to digital in the DAQ board in the control box. The data are typically over 30 MB and are safely stored using the NAS server.
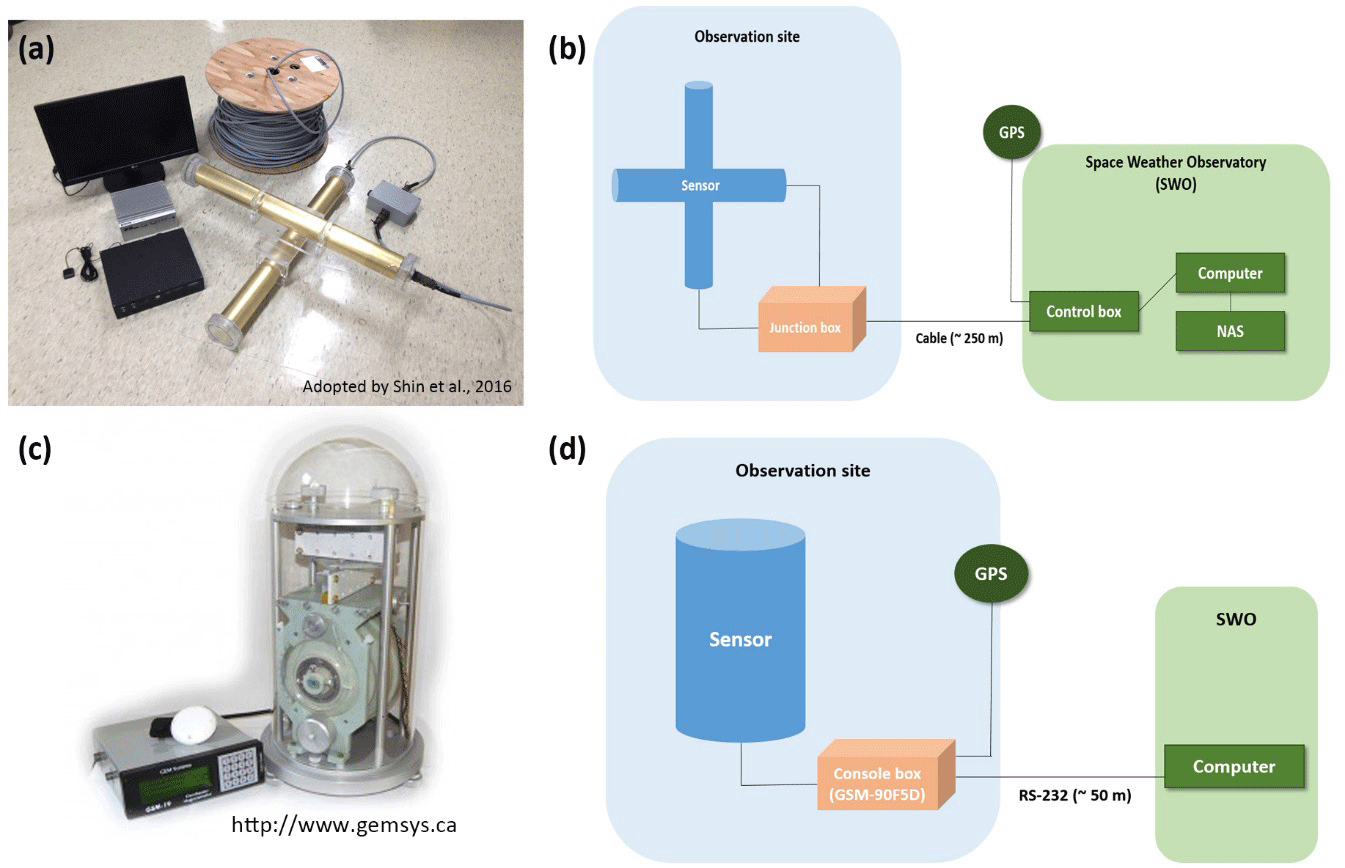
We installed another magnetometer named the “dIdD suspended system vector magnetometer” (here after, dIdD) developed by GEM Systems, Canada. The dIdD consists of Overhauser sensors with an orthogonal coil system as the bi-directional set of bias coils (Fig. 5(c)). These two coils monitor the declination and inclination in the horizontal and vertical planes, respectively. A simple algorithm determines the subsequent instantaneous angular changes in the direction of the total magnetic field vector, F. These angular changes are dI (delta inclination) and dD (delta declination). The dIdD determines the instantaneous inclination and declination for the F vector by adding dI and dD to the inclination and declination baseline values. The dIdD operates with a 1 sec time resolution. Similar to the SCM, the sensor and console box are located outside of the SWO and are connected to the control PC through a RS-232 protocol as shown in Fig. 5(d).
SCM measurements can be used to define wave signatures. The cusp region near JBS is the main source of ground Pc1 waves from the outer magnetosphere (Boloshoakova et al. 1980; Morris & Cole 1991). A high temporal resolution is very important for measuring Pc1 waves since the frequency range of the Pc1 is from 0.2 to 5 Hz. In contrast to the SCM, the dIdD measures the magnetic field and its variations connected to the interplanetary magnetic field in the polar region. An example of the polar magnetic field variations will be described in the next section.
When energetic particles from the magnetosphere enter the polar ionosphere some of their energy can be transferred to ionospheric ions/electrons and neutral constituents via collisions. The excited atoms and molecules go back to a more stable lower energy state by radiating photons that we see as the visible aurora. The auroral phenomena can be considered as the major product of the energy transfer processes from solar winds to the polar ionosphere through the magnetosphere. Although our understandings of auroral characteristics such as generation mechanisms and aurora types has improved through several ground-based and space-born observations over several decades, we still have limited knowledge about the connections between the space environment and auroral activities with a wide range of periods and spatial scales.
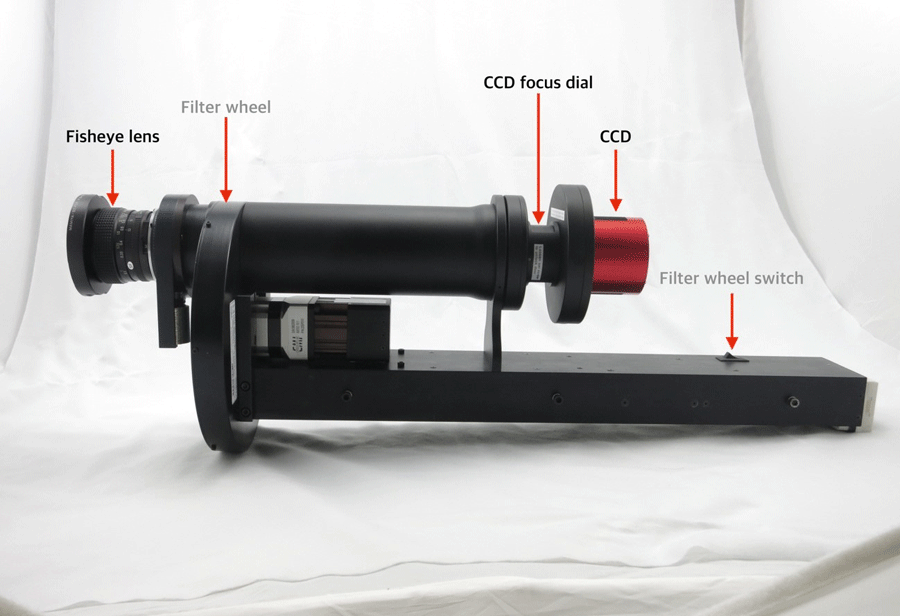
The Aurora ASC has been operating at JBS since March 2018 to observe auroras in the visible range. The camera was originally developed for gravity wave studies to measure airglow emissions with several optical filters such as the OH band and green line and was reformed to focus on monitoring auroral activities. To capture the general features of an aurora such as the morphology and spatiotemporal evolution, a color CCD sensor and fisheye lens have been adapted. The components marked with black text in Fig. 6 are those currently used, while the filter wheel and switch with gray text are not used for auroral observations. The built-in control software developed by Keo Scientific Ltd. automatically performs the observations and data acquisitions based on the site and instrument settings. We have been able to collect an auroral image with a 1 min temporal resolution. The aurora ASC allows us to study plasma-neutral dynamic coupling by comparing the collocated FPI and ionospheric radar measurements to find evidence for auroral breakups from energetic particles produced by wave-particle interactions in the magnetosphere.
A neutron monitor was installed near the SWO in December 2015. A neutron monitor detects cosmic rays that propagate throughout the atmosphere. To avoid the shielding effect caused by Earth’s magnetic field and atmosphere, the location of a neutron monitor is very important (Poluianov et al. 2015). Our monitor consists of 18 tubes, but only six tubes were transferred from the United States McMurdo station (MCMU). Over a two year period, neutrons from space-originating cosmic ray collisions with the atmosphere were simultaneously monitored at JBS and MCMU. Jung et al. (2016) introduced the installation of a neutron monitor and reported the measurement comparisons from the two stations. They found that the data were well correlated. The mission to relocate the rest of the neutron monitor (12 tubes) from the MCMU to JBS was completed in late 2017.
In order to expand the capability of the polar cap upper atmosphere observations, the Korea Astronomy and Space Science Institute (KASI) have operated the ASCs and global positioning system total electron content (GPS TEC)/ scintillation monitor at JBS in collaboration with the KOPRI. Used to study irregularities at the ionospheric E- and F-layers, the GPS monitor has been operational since 2016. The monitor also measures the TEC above JBS. Related to the dynamic space environment, GPS TECs simultaneously fluctuate at both low- and high-latitudes (Chung et al. 2017). In contrast to Aurora-ASC, the KASI-ASC is used to observe airglow emissions at five different wavelengths for O (557.7 nm, 630.0 nm, and 634.3 nm), Na (589.3 nm), and N2+ (589.3 nm). The KASI-ASC was installed at the SWO in 2017. The observed airglow images are used to investigate the two dimensional structure of gravity waves at different height layers (Yang et al. 2015).
JBS is located in the polar cap, a very unique region where the interactions between the upper atmosphere and the space environment can be observed. JBS collected data will be applied to investigate the physical characteristics underlying magnetosphere-ionosphere-thermosphere coupling.
3 PRELIMINARY RESULTS
In this section, we will introduce data measured by the instruments described in the previous section during a geomagnetic storm that occurred on April 20, 2018.
Fig. 7 shows the time series of the (a) magnitude of the interplanetary magnetic field (IMF), (b) Z-component of the IMF on the Geocentric Solar Magnetic (GSM) coordinates, (c) solar wind dynamic pressure, (d) SYM-H, (e) total magnetic field measured by the dIdD, and the (f ) dynamic spectrum of the Y-component deduced by the SCM from April 19 to 23, 2018. The solar wind parameters were obtained from time-shifted 1 min OMNI data (http://omniweb.gsfc.nasa. gov/). A sudden increase in the PSW, IMF BT, and southward turning of the IMF BZ were observed around 00:00 UT on April 20 and are marked as dashed lines (red in Figs. 7(a)- 7(e), white in Fig. 7(f )). Associated with this interplanetary shock (IP shock), a sudden commencement (SC) by magnetospheric compression is clearly observable from the SYM-H index in Fig. 7(d). The SYM-H decreases after the SC and dropped to a minimum of -80 nT at 09:30 UT.
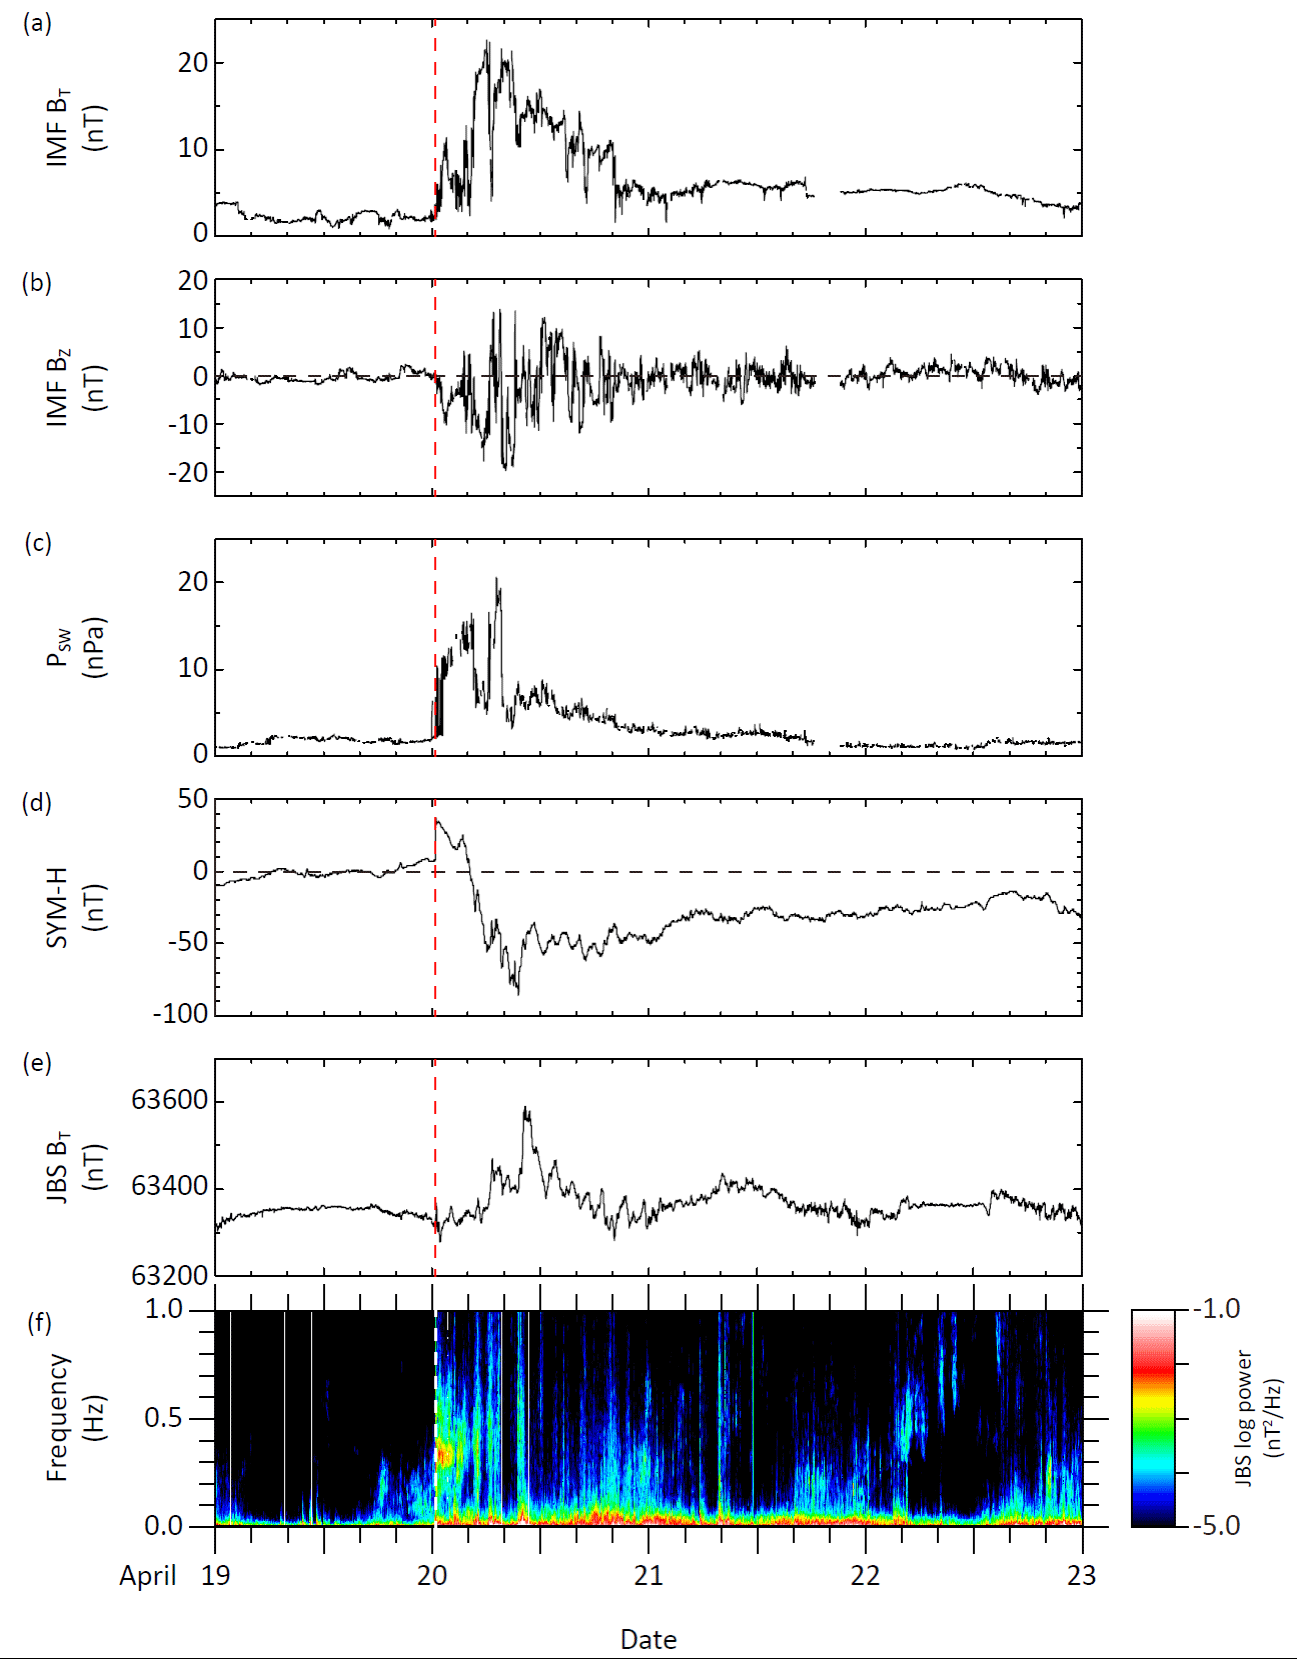
The total magnetic field at JBS was enhanced related to the minimum SYM-H by the magnetospheric compression shown in Fig. 7(e). When the IP shock arrived at the magnetopause, JBS was located in the post-noon sector (13 MLT). At that time, the SCM observed a sudden Pc1 signature with a peak frequency at ~300 mHz, whereas there was no wave activity before the SC arrival. Although the typical location of the magnetopause is larger than 10 RE, it moved from ~12 RE to ~9 RE due to the IP shock (Shue et al. 1997, 1998). Compression of the magnetosphere causes an increase in the temperature anisotropy near noon at high latitudes where it then generates ULF emissions in the Pc1 band (Olson & Lee 1983; Anderson & Hamilton 1993). Pc1 waves associated with significant compression of the magnetosphere were simultaneously observed in space and on ground (Anderson & Hamilton 1993; Engebretson et al. 2002, 2015). The magnetic field was disturbed by the geomagnetic storm and magnetic field fluctuations in the low frequency band were successively observed until April 22 as shown in Figs. 7(e) and 7(f).
The keogram from the Aurora-ASC is shown in Fig. 8. Figs. 8(a) and 8(b) show the auroral intensities in geomagnetic coordinates along the east-west and north-south directions, respectively. The initial brightening occurred at 09:40 UT associated with the sudden enhancement of the magnetic field as shown in Fig. 7(e), while a decrease in the AL index began at 09:30 UT (not shown). This time delay is caused by the poleward expansion following the sudden brightening related to the sub-storm onset. The Aurora- ASC observations provide clear evidence of the poleward expansion in Fig. 8(b). The aurora started northward of JBS and expanded from north-east to south-west corresponding to the extended auroral zone from low to high geomagnetic latitude.
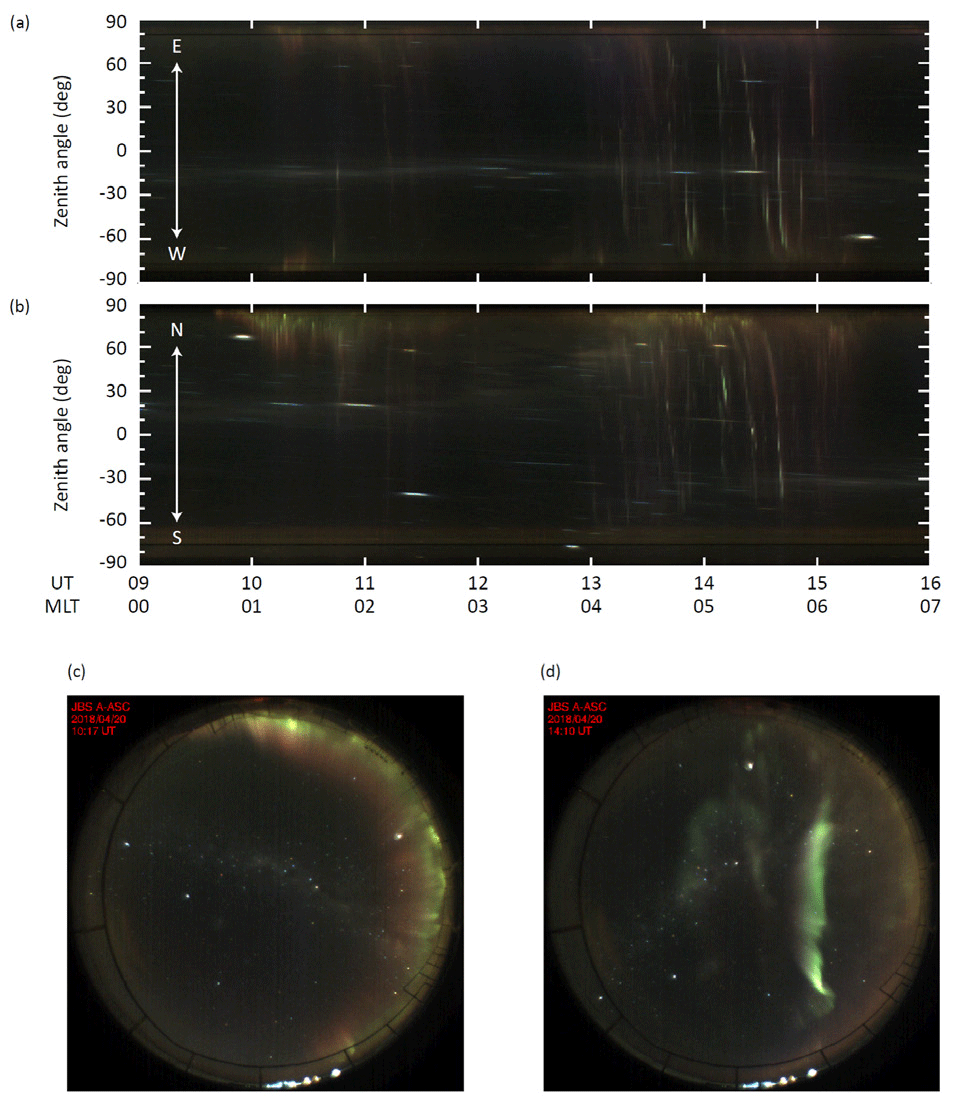
The second auroral breakup began at 13:00 UT (04 MLT) and propagated from north-east to south-west. After the breakup, the aurora was observed over the entire ionosphere above JBS until 15:00 UT. Newell et al. (2009, 2010) statistically analyzed the global structure of the aurora based on particle data obtained from the SSJ/4 electrostatic analyzer on Defense Meteorological Satellite Program (DMSP) satellites. They found auroral region asymmetry between day and night, as the poleward boundary of the aurora moved to higher latitudes as the Earth rotated from night to day. These signatures agree well with JBS observations shown in Fig. 8. Figs. 8(c) and 8(d) represent sample images from Aurora-ASC at 10:17 UT and 14:10 UT.
The overall responses of the ionosphere and thermosphere to the geomagnetic storm on April 20 are summarized in Fig. 9. Fig. 9(a) shows the spectrum of the electron density and hmF2 (magenta-colored lines) measured by the VIPIR. The ion flow and neutral wind on the zonal and meridional planes are shown in Figs. 9(b) and 9(c) as red and blue lines, respectively. Fig. 9(d) is a time series of the neutral temperature measured by the FPI from April 19 to 23, 2018. The plasma flows were calculated by applying the least square-fitting to the Doppler speed of the echoes above 130 km recorded by the VIPIR to define the plasma velocity in the F-layer. Note that we used the FPI red-line emission at 250 km to represent neutral wind in the F-layer. The geomagnetic storm onset time is marked with vertical dashed lines.
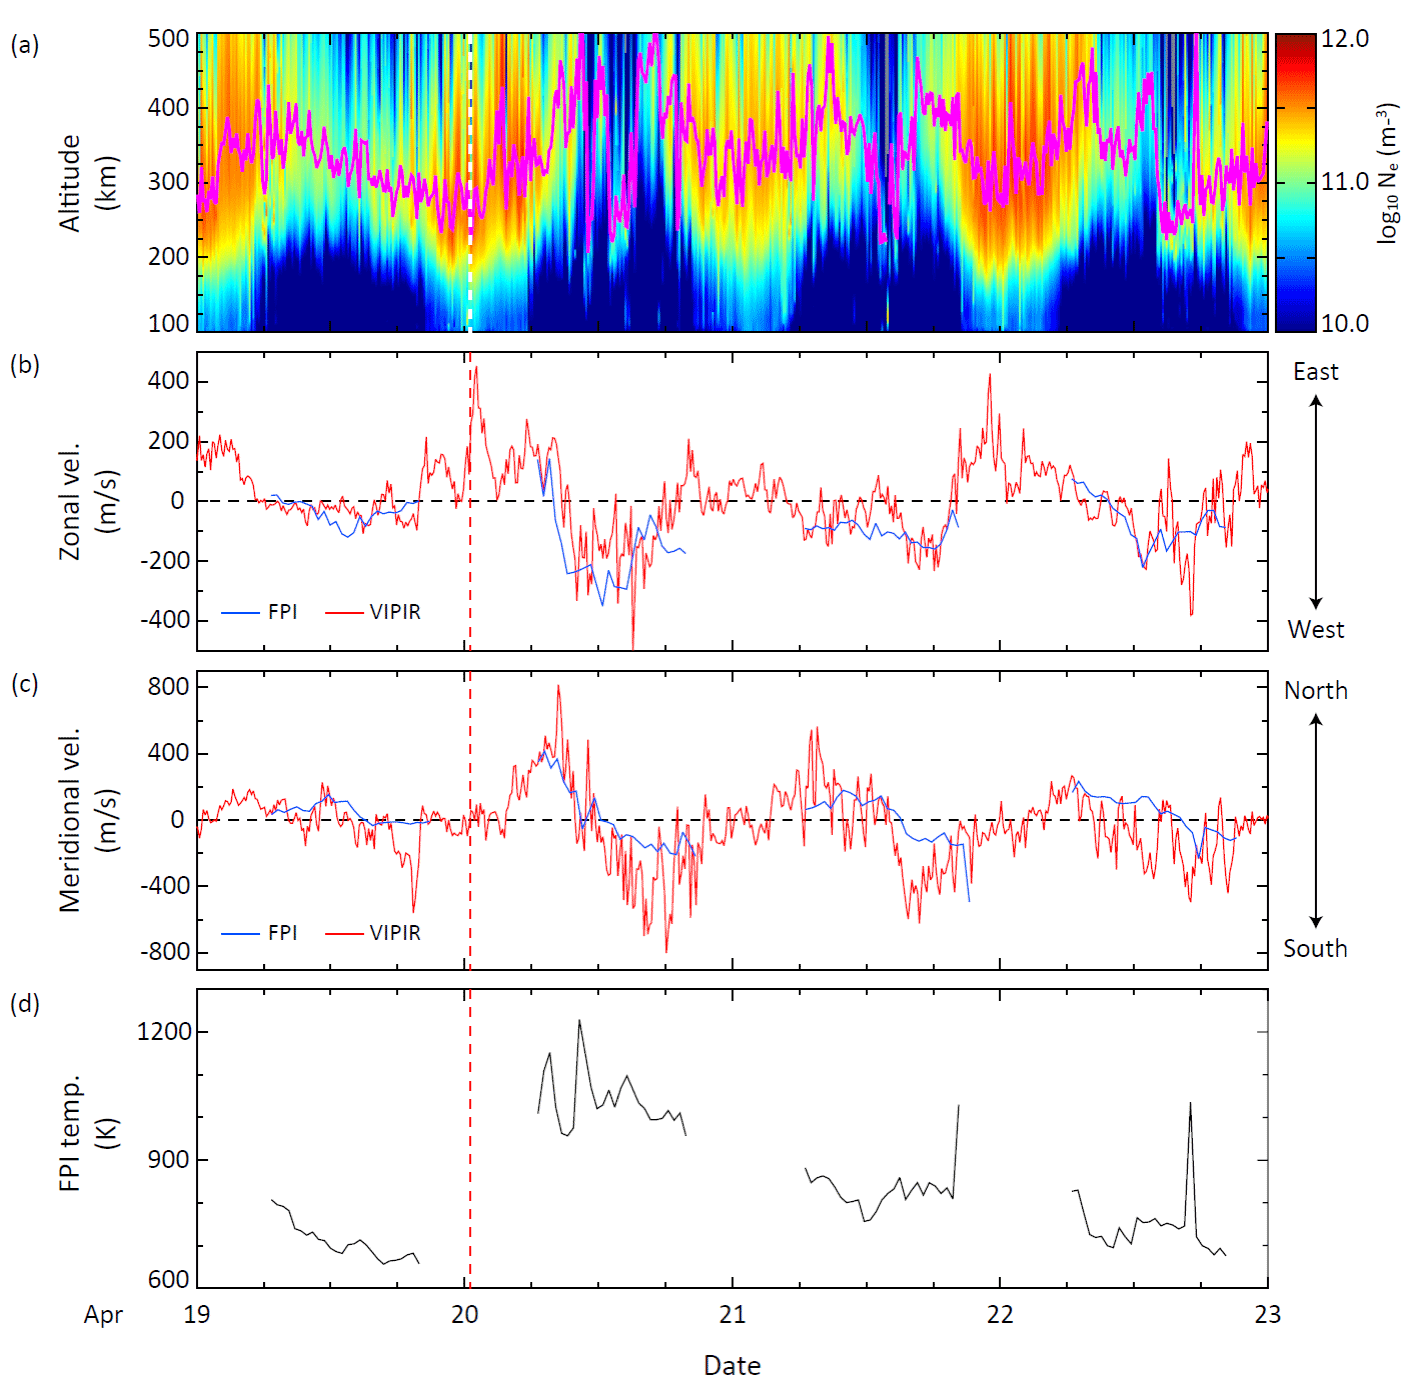
The ionospheric hmF2 dramatically dropped by about 250 km at around 11:00 UT and rose rapidly to 400 km before going back to the quiet nighttime condition. Prolonged lower electron density structures continued for 7 hours indicating an ionospheric negative storm.
There are also notable changes in both the ion and neutral motions during the disturbed period. After onset of the storm, the ion moved strongly eastward up to 400 m/s then enhanced westward flows appeared during the night. The neutral wind eastward motion increases were not detected by the FPI because they occurred during daytime by the VIPIR. Strong westward thermospheric winds, however, were simultaneously observed by the FPI in Fig. 9(b). Meridional flows also became significantly stronger in an equatorial direction. Neutral winds, for example, reached 400 m/s which is comparable to the ion flow. It should be noted that FPI westward winds are generally stronger than ion velocities during the main phase of the storm while the ion flow dominates the neutral wind in a meridional direction during the corresponding period.
Polar thermospheric temperature enhancements due to the ion-neutral frictional heating process during the storm period have been observed by several ground-based FPI observations (Huang et al. 2016; Lee et al. 2017). Thermospheric temperatures quickly increased by at least 300 K compared to non-storm conditions on April 19 and gradually cooled down to 600 K within two days.
4 SUMMARY
In this paper, we briefly introduced the ground based observation capabilities at the Jang Bogo Korean Antarctic Research Station for magnetosphere-ionosphere-thermosphere (MIT) coupling over the polar cap region. Initial observation results collected during an April 2018 geomagnetic storm are also presented. JBS plays an important role in extending our research scope from neutral MLT dynamics to the ionosphere and magnetosphere because of its location in the cusp/polar cap while the King Sejong Station in the subauroral region is limited with regards to studying the effect of space weather including solar winds on the Earth’s upper atmosphere and ionosphere. Observations at JBS began in 2014 with the FPI when the station became operational. Several instruments were subsequently installed and operated at JBS to monitor essential phenomena occurring in the polar ionosphere and magnetosphere. These include the VIPIR in 2015, SCM in 2017, and the Aurora- ASC and dIdD in 2018. They have continually provided simultaneous observations of the ionosphere and thermosphere at the polar cap, that are being used to study neutralplasma coupling at the upper atmosphere, solar windmagnetosphere-ionosphere coupling, plasma convection in the ionosphere, and sub-storm-aurora phenomena.