1 INTRODUCTION
Solar cycles excite variations of Earth’s electric/magnetic systems and thermodynamic systems (Kim & Chang 2014a, 2014b; Lee & Yi 2016; Na et al. 2016). Numerous attempts have been made over years to particularly link various aspects of solar variability to Earth’s climate variability, since the need in estimating the magnitude of anthropogenic contribution to climate change demands a better understanding of the natural causes of the climate change (Svensmark & Friis- Christensen 1997; Reid 2000; Tinsley 2000; Roldugin & Tinsley 2004; Scafetta & West 2006; Burns et al. 2007, 2008; Cho & Chang 2008; Kniveton et al. 2008; Meehl et al. 2009; Gray et al. 2010; Cho et al. 2012a; Lee et al. 2014; Gray et al. 2017). Topics on which main efforts are focused can be grouped into three categories: (a) the direct impact of solar irradiance variability on temperatures at the Earth’s surface, characterized by the total solar irradiance (TSI), (b) the indirect impact of variations through the absorption of UV radiation in the upper stratosphere associated with the ozone chemistry, (c) the indirect impact of variations in the generation of charged particles by galactic cosmic ray (GCR) penetration into the troposphere, which is generally accepted as one of the most plausible agents linking the solar magnetic activity to various climatic phenomena (Ney 1959; Friis-Christensen & Lassen 1991; Marsh & Svensmark 2000; Pudovkin 2004; Haigh 2007; Bazilevskaya et al. 2008).
Furthermore, there are growing phenomenological evidence that solar activity is indeed related to variations of the terrestrial climate. Periods corresponding to the 11 year sunspot cycle have been detected in various hydrologic data (Mazzarella & Palumbo 1992; Kavlakov 2005; Pérez-Peraza et al. 2008; Park & Chang 2013). The chemical composition from the stratosphere to the lower thermosphere is also disturbed by influx of energetic particles into the atmosphere coming from the Sun and outside the heliosphere (Garcia et al. 1984; Reid et al. 1991; Vitt & Jackman 1996; Vitt et al. 2000; Ogurtsov et al. 2004; Jackman et al. 2005; Storini & Damiani 2008; Damiani et al. 2010; Funke et al. 2011; Sinnhuber et al. 2012). Analyzing the measured pH in precipitation over the 109 stations distributed in the United States, Moon et al. (2014) have found that data of pH in precipitation appear to be anti-correlated with the solar asymmetry. It has been also shown that sea surface temperature (SST) and/or pressure is related to solar energetic particle events (SEP) (Veretenenko & Thejll 2004; Cho et al. 2012b; Mironovaet al. 2012; Mironova & Usoskin 2013, 2014), tropospheric dynamics are related to GCRs (Tinsley & Deen 1991; Pudovkin et al. 1997; Svensmark & Friis-Christensen 1997; Artamonova & Veretenenko 2011), pressure is to related to interplanetary magnetic field (IMF) (Tinsley & Heelis 1993; Lam et al. 2013), SST is related to solar wind speed (SWS) (Zhou et al. 2016). Besides, solar signals are reported to statistically relate to synoptic scale changes, such as, El-Niño-Southern Oscillation (ENSO) variability (e.g., van Loon et al. 2007; Meehl et al. 2008; van Loon & Meehl 2008; Roy & Haigh 2010; Zhou & Tung 2010; Haam & Tung 2012; Lee et al. 2012; Roy & Haigh 2012), the Quasi Biennial Oscillation (QBO) (Labitzke 1987; Labitzke & van Loon 1988; Sagir et al. 2015), North Atlantic Oscillation (NAO) (Gray et al. 2013).
Recently, future disasters resulting from extreme weather conditions under accelerated global warming has attracted much attention from various research fields (Lee et al. 2016). In particular, concerns about possible impacts of global warming on tropical cyclone (TC) activity have triggered a number of theoretical, modeling, and empirical studies (e.g., Trenberth 2005; Yan et al. 2012). A sophisticated global and regional climate models are employed to study tropical cyclonegenesis (Shen et al. 2000; Yoshimura & Matsumura 2005; Gualdi et al. 2008; Zhao et al. 2009; Bender et al. 2010; Yamada et al. 2010). Impacts of warming climate on the TC activity is also examined based on observations (Emanuel 2005; Trenberth 2005; Webster et al. 2005; Yan et al. 2012; Gleixner et al. 2014; Scoccimarro et al. 2014). Consequently, TC activity over the Northwestern Pacific basin is shown to be strongly related to ENSO events (Lander 1994; Saunders et al. 2000; Wang & Chan 2002; Camargo & Sobel 2005; Chan 2006; Ho et al. 2009; Goh & Chan 2012; Zhang et al. 2012; Nakano et al. 2016), to Pacific Decadal Oscillation (PDO) (Chan & Liu 2004; MacDonald & Case 2005; Wang et al. 2010), to Arctic Oscillation (AO) (Larson et al. 2005; Xie et al. 2005; Choi & Byun 2010), to North Atlantic Oscillation(NAO) (Peng et al. 2012; Zhou & Cui 2014; Yu & Lin 2016; Choi et al. 2017), to Madden-Julian Oscillations (MJO) (Liebmann et al. 1994; Nakano et al. 2015; Zhao et al. 2015; Nakazawa 2006), to the western North Pacific monsoon (WNPM) (Chen et al. 2006; Choi et al. 2016). Moreover, the detection of longterm trends in TC activity has been a subject of considerable debate (e.g., Sobel et al. 2016). Camargo & Sobel (2005) also showed that TCs tend to occur in the southeastern area of the subtropical western North Pacific (WNP) and tend to have a longer lifetime during ENSO warm episodes (Choi & Moon 2012). The average latitude where TCs reach their maximum intensity has been observed to be moving poleward in some regions over the 30 years, apparently in concert with the observed expansion of the tropical belt (Kossin et al. 2014, 2016).
Thus, we are here motivated, in view of solar-terrestrial connection, to search for another example of extreme weather condition modulated by solar activity. Previously, solar influences on local variations of drought has been investigated by Park & Chang (2013), which is among the greatest natural disasters. In the present contribution, we attempt to address the solar influences on climate change in terms of a statistical behavior of TCs in WNP, particularly in the level of tropical storm (TS) or greater than TS (cf., Elsner & Jagger 2008; Elsner et al. 2010; Karakhanyan & Molodyk 2017). TSs are one of TC groups classified for organizational purposes by the Regional Specialized Meteorological Center (RSMC) on the basis of intensity which is modulated by large-scale environmental parameters (McBride & Zehr 1981; Gray 1998; Yoshida & Ishikawa 2013; Yang et al. 2015; Admiranto & Priyatikanto 2016; Jo & Chang 2016). That is, they are TCs of a strong thunderstorm with a defined surface circulation and maximum sustained winds of at least 17 m/s. Once the system’s maximum sustained wind speed reaches 33 m/s, the TC is designated as a typhoon. This paper is organized as follows. We begin with descriptions of data analyzed for the present paper in Section 2. We present and discuss results of examining properties of TSs in Section 3. Finally, we briefly summarize and conclude in Section 4.
2 DATA
For the present analysis the best track data for TCs with maximum sustained wind speeds of at least 17 m/s from 1977 to 2016, spanning from the solar cycle 21 to the solar cycle 24, have been obtained from the Tokyo Typhoon Center at the RSMC1 where details of TCs occurring since 1951 can be downloaded in text files. The RSMCs are responsible for detecting TCs in its designated area of responsibility, and for providing information about the systems present and their forecast position, movement and intensity. There are six meteorological centers in addition to six regional Tropical Cyclone Warning Centers (TCWCs) that all provide public tropical cyclone advisory messages. The best track data consist of 6-hourly (00:00, 06:00, 12:00, 18:00 UTC) center positions (latitude and longitude in tenths of degrees), grade, the maximum sustained surface wind speed in knots (10-minute average), radii of 30 kt (and 50 kt) winds or greater in nautical miles, and central pressures in hPa for all TCs of TS intensity or higher. A reason why we here analyze data from 1977, instead of 1951, is that the maximum sustained wind speed and the longest radius of 30 kt winds or greater have been provided from the Tokyo Typhoon Center since 1977. As a result, we end up with 1018 TS entries. In order to divide the TC data for further analyses into subgroups based on periods of El-Niño/La-Niña2 or solar cycles3, we adopt the dates from official websites. The El-Niño periods include 1977/01 ~ 1977/02, 1977/09 ~ 1978/01, 1979/10 ~ 1980/02, 1982/04 ~ 1983/06, 1986/09 ~ 1988/02, 1991/06 ~ 1992/07, 1994/10 ~ 1995/03, 1997/05 ~ 1998/05, 2002/06 ~ 2003/02, 2004/07 ~ 2005/04, 2006/09 ~ 2007/01, 2009/07 ~ 2010/04, 2014/11 ~ 2016/05 and the La-Niña periods include 1984/10 ~ 1985/06, 1988/05 ~ 1989/05, 1995/08 ~ 1996/03, 1998/07 ~ 2001/02, 2007/08 ~ 2008/06, 2010/07 ~ 2011/04, 2011/08 ~ 2012/02, 2016/08 ~ 2016/12. The years of the solar maxima include 1979, 1989, 2000, 2014 and those of the solar minima include 1976, 1986, 1996, 2008. The descending phase and solar ascending phase of solar activity correspond to the period between the maximum and the minimum of the sunspot cycles, respectively.
3 NUMBER DISTRIBUTION OF TCS CHARACTERIZED BY SOLAR ACTIVITY
In Fig. 1, we show positions of all the TCs with maximum sustained winds of at least 17 m/s occurring during the period from 1977 to 2016. From left to right, we show the positions of TCs when maximum sustained wind speed reaches at least 17 m/s for the first time (i.e., becoming stronger than a tropical depression, TD, and being designated as a TS), when the central pressure becomes the lowest, and when maximum sustained wind speed gets down below 17 m/s from higher than this speed (i.e., becoming weaker than a TS, and ending its life as a TS), respectively. The number distribution of TCs with maximum sustained winds of at least 17 m/s obtained by projecting to the specific axis is also shown along the corresponding axis in the left and bottom panels, respectively. Note that all the histograms produced in this paper are normalized such that the total area is equal to unity. Thick curves represent the best fit of a Gaussian function. It should be mentioned a couple of points. Firstly, number distributions of TCs as a function of longitude as a whole are far from the Gaussian distribution. It is evident in the rightmost panel, which is rather similar to a gamma distribution. Thus, it can be said that TCs are not normally distributed in longitude. Secondly, number distributions of forming position of TCs as a function of latitude appear to be skewed. In other words, there are an excess in lower latitude part and a deficit in higher latitude part. It is useful to remind that a skewed Gaussian is sometimes observed when a distribution is bimodal with two components closely spaced (e.g., Chang 2011). That is, the skewed distribution can be explained by a sum of two distinct unimodal distributions. Interestingly, Lee et al. (2016) reported a skewed distribution of TC intensity and suggested that the observed distribution could be due to two Gaussian components of distinct populations of TCs. Thirdly, bimodality is obvious in the rightmost panel. In this case, however, it can be understood clearly with a seasonal effect.

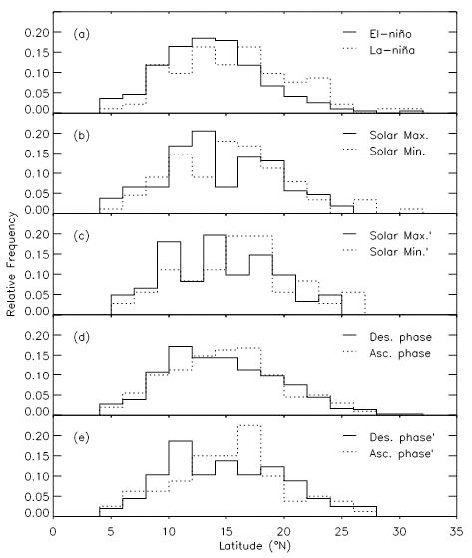
In Fig. 2, we show number distributions of latitude when TCs form (i.e., when TC’s maximum sustained winds speed exceeds 17 m/s for the first time) resulting from subsets extracted from our original data set for comparison. Here, we have chosen TCs whose maximum sustained winds speed exceeds 33 m/s at least once in the life time. Moreover, for the plots we show in the followings as well as Fig. 2, all TC data sets only contain those with maximum sustained winds speed at least 33 m/s, which consist of 554 TS entries. In the top panel, continuous and dotted histograms result from TCs occurring in the El-Niño periods and the La- Niña periods, respectively. As one may expect, TCs appear to form in lower latitude in the El-Niño periods compared with the La-Niña periods. That is, mean values of forming latitude in the El-Niño and La-Niña periods are 13.26° and 15.13°, respectively. In the second panel, continuous and dotted histograms result from TCs occurring in the two year periods around solar maxima and the solar minima, respectively. That is, the continuous histogram results from TCs occurring in solar maxima ±1 year intervals. And the dotted histogram results from TCs occurring in solar minima ±1 year intervals. Apparently, TCs tend to form more frequently in lower latitude in the solar maximum periods than in the solar minimum periods. That is, mean values of forming latitude in the solar maximum and solar minimum periods are 13.99° and 14.98°, respectively. To make sure that it is not due to the ENSO effect, we exclude TCs both in the El-Niño periods and in the La-Niña periods from the data set and repeat the analysis. Results are shown in the third panel, in which a similar trend can be noticed as seen in the second panel. In the fourth panel, continuous and dotted histograms result from TCs occurring in the descending phase of solar activity and the ascending phase, respectively. We find that TCs tend to form in lower latitude in the descending phase of solar activity than in the solar ascending phase. That is, mean values of forming latitude in the descending phase of solar activity and solar ascending phase are 13.88° and 14.55°, respectively. In the bottom panel, we show results obtained by a procedure which has been done to obtain results shown in the third panel. A similar trend as found in the fourth panel can be seen. Thus, TCs occurring in the descending phase of solar activity seem to form in relatively lower latitude. In Table 1, we list central values of the Gauss function as mean values of the histogram, resulting from the Gaussian fit to histograms. Note that standard deviations are generally very large since the distribution seen from histograms is broad in nature.
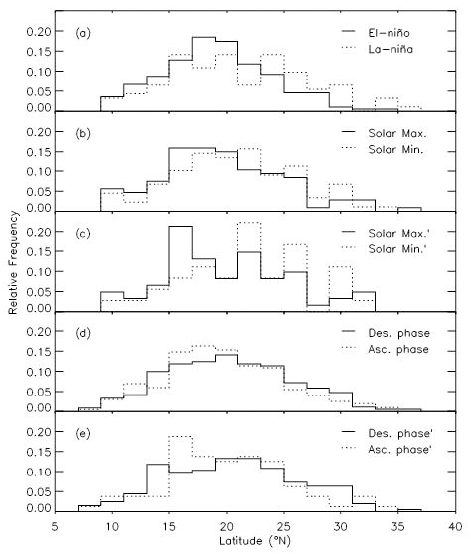
In Fig. 3, we show similar plots to Fig. 2, except that latitude of TCs when its central pressure is the lowest is counted. Note that this is different from the recurvature location. When the central pressure remains the lowest for a while we consider the first position with the lowest central position as that of the strongest TC. Line types in plots represent data sets in a similar way as in Fig. 2. According to the top panel, it is found that TCs tend to become the strongest in lower latitude in the El-Niño periods compared with the La-Niña periods. That is, mean values of latitude when TC is the strongest in the El- Niño and La-Niña periods are 18.85° and 20.49°, respectively. It does not necessarily mean that strong TCs reside in lower latitudes during the El-Niño periods compared with the La- Niña periods. A reason for this is because it is not a matter of comparisons of TCs with each other, it only deals with a kind of evolution for a given TC. Similarly, the second panel suggests that TCs tend to become the strongest in lower latitude in the solar maximum periods compared with the solar minimum periods. That is, mean values of latitude when TC is the strongest in the solar maximum and solar minimum periods are 18.84° and 20.61°, respectively. As shown in the third panel, this behavior becomes clear when we exclude TCs both in the El-Niño periods and in the La- Niña periods from the data set. It is found in the fourth panel, in the meantime, that TCs tend to reach its maximum strength in higher latitude in the descending phase of solar activity than in the solar ascending phase. That is, mean values of latitude when TC is the strongest in the descending phase of solar activity and solar ascending phase are 19.89° and 19.17°, respectively. In the bottom panel, results from data sets in which TCs both in the El-Niño periods and in the La-Niña periods are both removed is shown to imply a same conclusion drawn in the fourth panel. In Table 1, we list central values of the Gauss function as mean values of the histogram, resulting from the Gaussian fit to histograms.
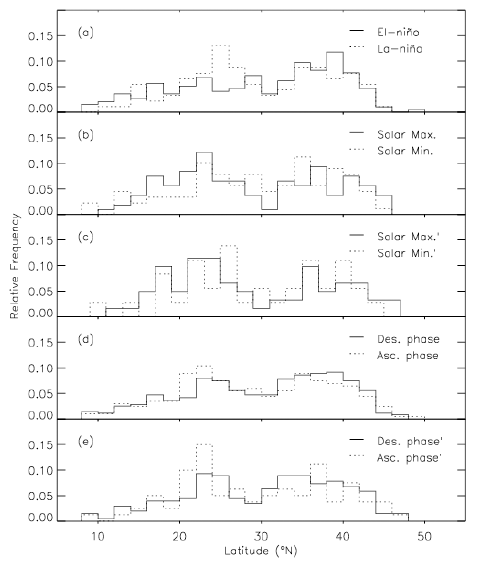
In Fig. 4, we show similar plots to Fig. 2, except that latitude of TCs when intensity of TC becomes that of a TD (i.e., maximum sustained wind speed down below 17 m/s from higher than this speed and ending its life as a TS) is counted. Bimodality due to the seasonal effect is manifest as a whole. According to the top panel, TCs proceed up to higher latitude before its termination in the El-Niño periods compared with in the La-Niña periods. That is, mean values of destroying latitude in the El-Niño and La-Niña periods are 31.86° and 30.49°, respectively. This finding agrees with recent reports that the weakening of the steering flow in the tropics causes the rising and poleward-shifting trends of TCs, resulting in slower-moving and longer-lasting TCs (Oey & Chou 2016). This finding may also reflect that TCs developing in El-Niño years tend to land on or affect regions of East Asia such as the eastern sea of China, Korea and Japan, while those in La- Niña years tend to land on the Philippines, South China or Indochina peninsula. TCs are found to end its phase as a TS in lower latitude around the solar maximum periods compared with the solar minimum periods, according to the second panel. That is, mean values of destroying latitude in the solar maximum and solar minimum periods are 29.59° and 31.68°, respectively. It is led to a similar conclusion in the third panel that results from TC samples in which TCs both in the El-Niño periods and in the La-Niña periods are both removed. In the fourth panel, it is found that TCs tend to end its life in higher latitude in the descending phase of solar activity than in the solar ascending phase. That is, mean values of destroying latitude in the descending phase of solar activity and solar ascending phase are 32.00° and 29.65°, respectively. In the bottom panel, results from data sets in which TCs both in the El-Niño periods and in the La-Niña periods are both removed seem to agree with those in the fourth panel. In Table 1, we list central values of the Gauss function as mean values of the histogram, resulting from the Gaussian fit to histograms.
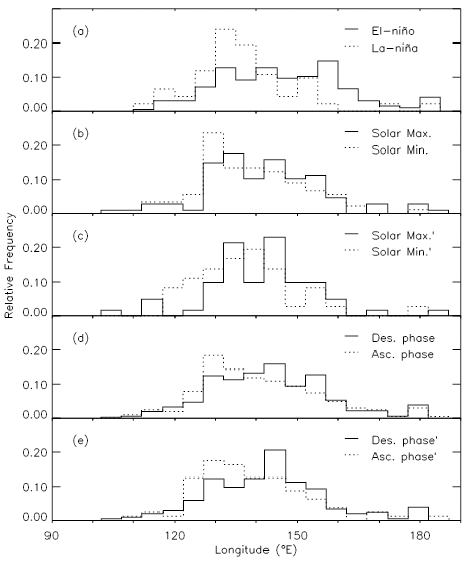
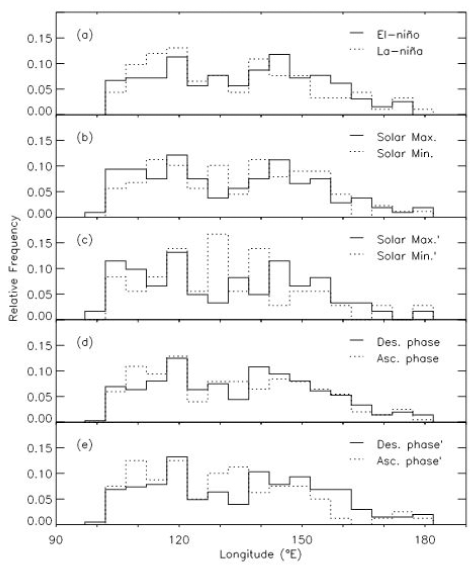
In Fig. 5, we show similar plots to Fig. 2, except that longitude of TCs when TCs form is counted. According to the top panel, TCs appear to form more frequently in the east part of the North Pacific basin in the El-Niño periods compared with the La-Niña periods. That is, mean values of forming longitude in the El-Niño and La-Niña periods are 145.39° and 134.71°, respectively. This finding agrees with the fact that a southeastward shift in the mean TC formation location during El-Niño years compared to La Nina years (Wang & Chan 2002). This may be due to the increase in SST over the central-eastern Pacific in El-Niño years. It has implication on the east-west shift of the tropical upper tropospheric trough (TUTT), since the annual mean TC genesis longitude is known to be controlled by TUTT (Wu et al. 2015). According to the second and the third panels, TCs tend to form in the east of the North Pacific basin in the solar maximum periods than in the solar minimum periods. That is, mean values of forming longitude in the solar maximum and solar minimum periods in the second panel are 140.54° and 136.73°, respectively. Similarly, according to the fourth and bottom panels, it is found that TCs tend to form in the east of the North Pacific basin in the descending phase of solar activity than in the solar ascending phase. That is, mean values of forming longitude in the descending phase of solar activity and solar ascending phase in the fourth panel are 141.94° and 137.68°, respectively. In Table 1, we list central values of the Gauss function as mean values of the histogram, resulting from the Gaussian fit to histograms.
In Fig. 6, we show similar plots to Fig. 2, except that longitude of TCs when its central pressure is the lowest is counted. According to the top panel, TCs tend to become the strongest in the east part of the North Pacific basin in the El-Niño periods compared with the La-Niña periods. That is, mean values of longitude when TC is the strongest in the El-Niño and La-Niña periods are 132.14° and 127.01°, respectively. According to the second and the third panels, TCs tend to become the strongest in the east of the North Pacific basin in the solar maximum periods than in the solar minimum periods. That is, mean values of longitude when TC is the strongest in the solar maximum and solar minimum periods in the second panel are 129.80° and 128.77°, respectively. Similarly, according to the fourth and bottom panels, it is found that TCs tend to become the strongest in the east of the North Pacific basin in the descending phase of solar activity than in the solar ascending phase. That is, mean values of longitude when TC is the strongest in the descending phase of solar activity and solar ascending phase in the fourth panel are 130.44° and 129.14°, respectively. In Table 1, we list central values of the Gauss function as mean values of the histogram, resulting from the Gaussian fit to histograms.
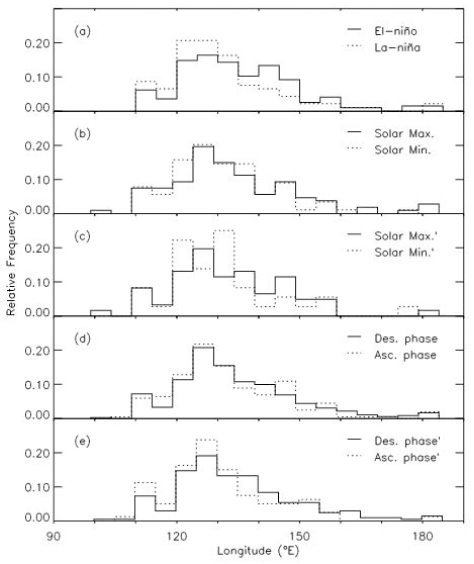
In Fig. 7, we show similar plots to Fig. 2, except that longitude of TCs when intensity of TC becomes that of a TD is counted. According to the top panel, TCs tend to end its life in the east part of the North Pacific basin after recurvature in the El-Niño periods compared with in the La-Niña periods. That is, mean values of destroying longitude in the El-Niño and La-Niña periods are 130.02° and 122.14°, respectively. With findings in Fig. 4 showing that TCs proceed up to higher latitude before its termination in the El-Niño periods, it is confirming that during the El-Niño periods TCs tend to move toward Korea and Japan more frequently compare with the La-Niña periods. According to the second and the third panels, on the other hand, TCs tend to end its life in the west of the North Pacific basin in the solar maximum periods than in the solar minimum periods. That is, mean values of destroying longitude in the solar maximum and solar minimum periods in the second panel are 126.57° and 131.46°, respectively. According to the fourth and bottom panels, it is found that TCs tend to end its life in the east of the North Pacific basin in the descending phase of solar activity, as in the El-Niño periods, than in the solar ascending phase, as in the La-Niña periods. That is, mean values of destroying longitude in the descending phase of solar activity and solar ascending phase in the fourth panel are 131.56° and 128.22°, respectively. In Table 1, we list central values of the Gauss function as mean values of the histogram, resulting from the Gaussian fit to histograms.
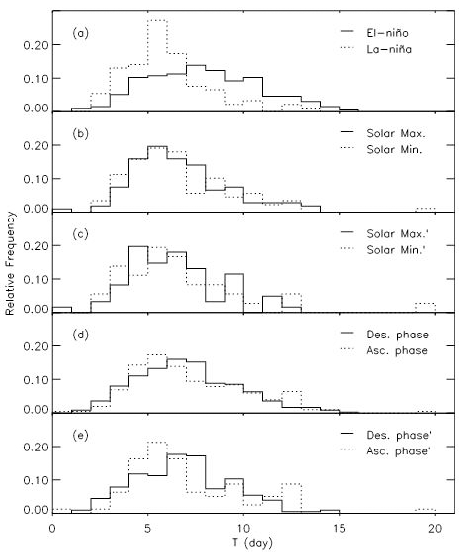
In Fig. 8, we show similar plots to Fig. 2, except that number distributions of lifetime of TCs are shown. The lifetime of a TC is defined as the interval from the occurrence to the disappearance of a TC. Note that lifetime, as well as the number of TCs and intensity of individual TC may represent a level of TC activity, though a factor such as the accumulated cyclone energy or the power dissipation index (Emanuel 2005) can be used to investigate variability of TC activity. In this sense, results in Figs. 8-10 may be used to characterize a long term trend of TC activity. Based on the top panel, TCs occurring in the El-Niño periods tend to survive longer than those occurring in the La-Niña periods. That is, mean values of lifetime in the El-Niño and La-Niña periods are 7.61 days and 5.46 days, respectively. This finding agrees with the fact that TCs in El-Niño years last a longer timescale compared with TCs in La-Niña. According to the second panel, TCs occurring in the solar maximum periods tend to survive longer than those occurring in the solar minimum periods. That is, mean values of lifetimes in the solar maximum and solar minimum periods are 6.02 days and 5.69 days, respectively. Results from TC samples in which TCs both in the El-Niño periods and in the La-Niña periods are both removed are shown in the third panel, which supports finding from the second panel. In the fourth and bottom panels, it is found that TCs tend to survive longer in the descending phase of solar activity than in the solar ascending phase. That is, mean values of lifetime in the descending phase of solar activity and solar ascending phase in the fourth panel are 6.67 days and 6.42 days, respectively. In Table 1, we list central values of the Gauss function as mean values of the histogram, resulting from the Gaussian fit to histograms.
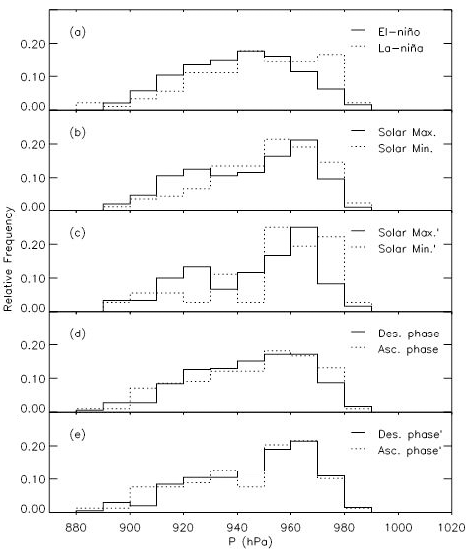
In Fig. 9, we show similar plots to Fig. 2, except that number distributions of central pressure of TCs at their maximum strength during the TC lifetime are shown. Based on the top panel, TCs occurring in the El-Niño periods tend to have a lower central pressure at their maximum strength than those occurring in the La-Niña periods. That is, mean values of central pressure of TCs at their maximum strength in the El-Niño and La-Niña periods are 942.14 hPa and 951.12 hPa, respectively. This finding agrees with the fact that TCs in El-Niño years show stronger intensity compared with TCs in La-Niña. According to the second and third panels, TCs tend to have a lower central pressure at their maximum strength in the solar maximum periods than in the solar minimum periods. That is, mean values of central pressure of TCs at their maximum strength in the solar maximum and solar minimum periods in the second panel are 948.07 hPa and 955.08 hPa, respectively. In the fourth panel, it is found that TCs occurring both in the descending and ascending phases of solar activity show indistinct distributions. That is, mean values of central pressure of TCs at their maximum strength in the descending phase of solar activity and solar ascending phase are 947.37 hPa and 949.69 hPa, respectively. On the other hand, in the bottom panel that results from TC samples in which TCs both in the El-Niño periods and in the La-Niña periods are both removed, such a trend becomes vague. In Table 1, we list central values of the Gauss function as mean values of the histogram, resulting from the Gaussian fit to histograms.
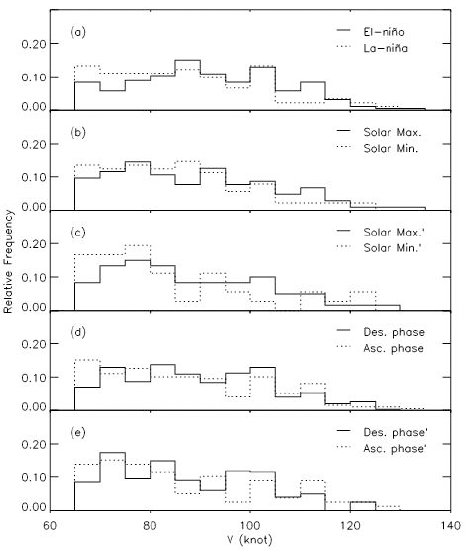
In Fig. 10, we show similar plots to Fig. 2, except that number distributions of maximum sustained surface wind speed are shown. Results are somehow expected to be similar to those in Fig. 9, since the maximum sustained surface wind speed is related to the central pressure of TCs. Based on the top panel, TCs occurring in the El-Niño periods tend to have higher maximum sustained surface wind speed than those occurring in the La-Niña periods. That is, mean values of maximum sustained surface wind speed in the El-Niño and La-Niña periods are 91.03 kt and 85.14 kt, respectively. In the second and third panels, TCs occurring in the solar maximum periods tend to have higher maximum sustained surface wind speed than those occurring in the solar minimum periods. That is, mean values of maximum sustained surface wind speed in the solar maximum and solar minimum periods in the second panel are 86.22 kt and 82.65 kt, respectively. In the fourth panel, it is found that TCs tend to have higher maximum sustained surface wind speed in the descending phase of solar activity than in the solar ascending phase. That is, mean values of maximum sustained surface wind speed in the descending phase of solar activity and solar ascending phase are 88.27 kt and 84.56 kt, respectively. On the other hand, in the bottom panel that results from TC samples in which TCs both in the El-Niño periods and in the La-Niña periods are both removed, it shows indistinct distribution. In Table 1, it should be mentioned that, due to a failure of the Gaussian fit, we directly have obtained mean value without a fitting process.
4 SUMMARY AND CONCLUSIONS
Solar activity is known to link to changes in the Earth’s weather on the day-to-day timescale to tens of year timescale. The large number of extreme weather events has triggered discussions on whether they are related to solar origin. On one hand, there is growing evidence linking specific events to solar variability. Here, we have attempted to examine variability of tropical cyclone activity modulated by solar activity in comparison with a large-scale environmental parameter, i.e., ENSO. For this purpose, we have obtained the best track data for TCs in the western North Pacific with maximum sustained wind speeds of at least 17 m/s from 1977 to 2016, spanning from the solar cycle 21 to the solar cycle 24. We have focused on tropical cyclones in the western North Pacific partly because tropical cyclone (TC) that occurs in western North Pacific has higher frequency than any other TC genesis basins, i.e., one third of all TCs in the world, and the partly because the western North Pacific have a significant amount of heat content on the Earth together with the southern Pacific, thus important for understanding the terrestrial weather and climate. Throughout the paper, we have presented results from TCs whose maximum sustained winds speed exceeds 33 m/s at least once in the life time. To make sure that it is not due to the ENSO effect, we have excluded TCs both in the El- Niño periods and in the La-Niña periods from the data set and repeated the analysis, as shown. In addition to this test, we have also reiterated our analysis twice with TCs whose maximum sustained winds speed exceeds 17 m/s, instead of 33 m/s, as well as TCs designated as a typhoon. It turns out that conclusions remain unchanged.
Our main results are as follows:
-
(1) We have confirmed that in the El-Niño periods, compared with the La-Niña periods, TCs tend to form in the lower latitude, reach its maximum strength in the lower latitude, and end its life as TSs in the higher latitude. TCs occurring in the El-Niño periods, compared with the La-Niña periods, tend to form in the east in longitude, reach its maximum strength in the east in longitude, and end its life as TSs in the east in longitude. Besides, TCs occurring in the El-Niño periods last longer compared with the La-Niña periods. Furthermore, TCs occurring in the El-Niño periods have a lower central pressure at their maximum strength and thus higher maximum sustained surface wind speed than those occurring in the La-Niña periods.
-
(2) We have found that in the solar maximum periods, compared with the solar minimum periods, TCs tend to form in the lower latitude, reach its maximum strength in the lower latitude, and end its life as TSs in the lower latitude. TCs occurring in the solar maximum periods, compared with the solar minimum periods, tend to form in the east in longitude, reach its maximum strength in the east in longitude, but end its life as TSs in the west in longitude. Besides, TCs occurring in the solar maximum periods last longer compared with the solar minimum periods. Furthermore, TCs occurring in the solar maximum periods have a lower central pressure at their maximum strength than those occurring in the solar minimum periods, and somewhat higher maximum sustained surface wind speed in the solar maximum periods. Hence, TCs occurring in the solar maximum periods resemble those in the El-Niño periods in their properties.
-
(3) We have also found that in the solar descending periods, compared with the solar ascending periods, TCs tend to form in the lower latitude, reach its maximum strength in the higher latitude, and end its life as TSs in the higher latitude. TCs occurring in the solar descending periods, compared with the solar ascending periods, tend to form in the east in longitude, reach its maximum strength in the east in longitude, and end its life as TSs in the east in longitude. Besides, TCs occurring in the solar descending periods last longer compared with the solar ascending periods. Furthermore, TCs occurring in the descending periods have a lower central pressure at their maximum strength and thus higher maximum sustained surface wind speed than those occurring in the ascending periods. Hence, TCs occurring in the solar descending periods somehow resemble those in the El-Niño periods in their properties.