1. INTRODUCTION
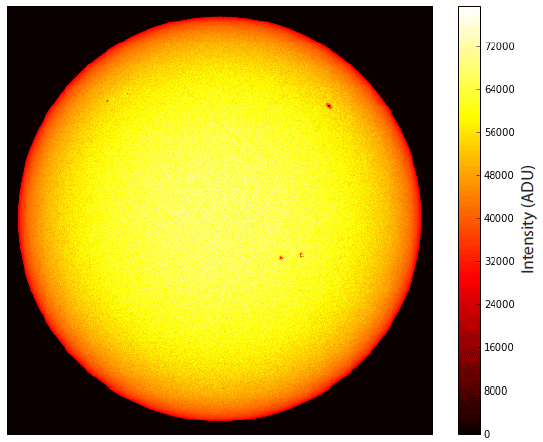
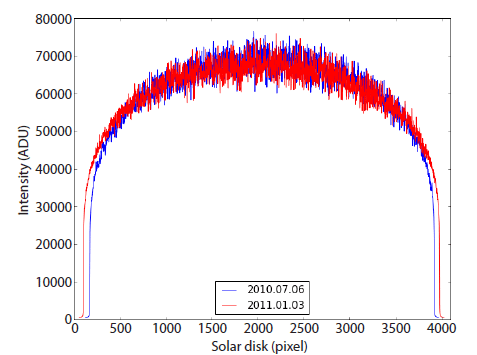
The brightness of the solar disk decreases from the center to the limb. This effect is termed limb darkening as shown in Fig. 1. Limb darkening arises because we see deeper, hotter gas layers when we look directly at the center of the disk and higher, cooler layers when we look near the limb. This effect can be understood by the concepts of opacity and optical depth. We see optically thick (opaque) gas at the center, and optically thin (transparent) gas at the limb. Limb darkening arises from photospheric opacity (Zeilik & Gregory 1997). Fig. 2 shows the photospheric intensity of the whole solar disk acquired from raw solar images taken by solar dynamics observatory (SDO) / helioseismic and magnetic imager (HMI) at aphelion (July 6, 2010) and perihelion (January 3, 2011). The limb darkening of the photospheric intensity in Fig. 2 matches well with the solar image in Fig. 1.
Pierce et al. (1950) have measured the solar limb darkening in the infrared range between 0.5 and 10.2 µm. They found a systematic increase in the solar continuous opacity toward longer wavelengths in the infrared, as predicted by calculations of the absorption coefficient of the negative hydrogen ion. Rubin (1959) investigated the solar limb darkening using the extreme limb of the sun, for example, the outer 1.2 % of the solar semi-diameter by the eclipse method during the eclipse of February 25, 1952. Usually the measurements of the brightness distribution of the solar disk are available for 99 % of the solar semi-diameter. Rubin (1959) has calculated the reasonable solar limb darkening at the extreme edge in the succession of observations by Pierce (1954).
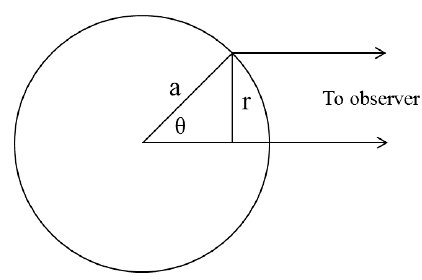
Athay et al. (1972) made profiles for the center-to-limb variation in intensity at different µ positions using the obser-vations of Fe I (λ = 4,383, 4,603) at Kitt Peak national observatory. The parameter µ is cos θ and θ is the angle between the emergent ray and the normal to the solar surface as shown in Fig. 3. They found a depth-varying source function, and the ratio of the continuous absorption coefficient to the total absorption coefficient reaches a minimum in the mid-photosphere. Pierce & Slaughter (1977) and Pierce et al. (1977) calculated the coefficients of the third and fifth degree polynomial of the solar limb darkening at 112 wavelengths in the UV, visible, and infrared portions of the solar spectrum obtained at the McMath-Pierce solar telescope during 14 days in the period of March 1974 through January 1975. Their observation in the UV and visible ranges has good consistency to the result fit by Sykes’s formula (Sykes 1953) with respect to limb darkening, but the red and infrared portions showed a discrepancy with the other study.
Moe & Milone (1978) have measured the limb darkening of the quiet sun in the spectral range of 1945–3245 Å using Navel Research Laboratory (NRL)'s SO82B instrument onboard Skylab. They calculated the coefficients for linear, quadratic, and logarithmic fits to the observed center-to-limb variations as a function of wavelength by averaging the spectral intensities over 10 Å wavelength bands. They found that the quadratic fits best represent the observations.
Neckel & Labs (1994) observed solar limb darkening be-tween the 1986 minimum and the 1990 maximum of solar activity using ground observation data. However, they did not find systematic variations in solar limb darkening dependent on the momentary activity nor the solar cycle phase in the wide wavelength portion. Studying the solar limb darkening at 303– 1,100 nm wavelength, Neckel (1996) calculated the coefficients of limb darkening functions and found that the coefficients show a rather low scatter, appearing to be linear functions of either λ-1 or λ-5 in the plots of coefficients vs. wavelength. Neckel (2003) also calculated the coefficients of limb darkening functions considering the limb temperature. Neckel (2003) suggested that the variation in limb temperature with wave-length due to systematic errors can be solved by simple correction functions. Afterwards, Neckel (2005) published the coefficients of limb darkening functions, corresponding to a limb temperature of 4,746 K based on the results by Neckel & Labs (1994).
Previous studies on solar limb darkening have focused on the calculation of the coefficients of limb darkening functions in the wide wavelength range. Even though Neckel & Labs (1994) examined the solar cycle variation in limb darkening, a significant variation could not be found. In this study, we examine the solar cycle variation in limb darkening using solar images taken by solar and heliospheric observatory (SOHO) and SDO. Regular and uniform observations by satellites can reduce observational error and the systemic variation in limb darkening by the change of solar activity can be studied.
2. DATA AND METHODS
A reasonably good empirical representation of limb darkening is given by the equation for the specific intensity:
Here, a is the radius of the solar disc, r is the radial distance from the center of the disc, and u is the limb darkening coefficient. This is often written in terms of θ (see Fig. 3): I(θ) = I(0)[1-u(1-cos(θ)]. When the intensity of the limb at the pole (r = a) is applied, the equation can be simplified by I(θ)/I(0) = (1-u). The limb darkening is displayed stronger in the short wavelength and the limb darkening function is expressed in terms of wavelength.
The photospheric intensity was estimated by full disk images of SOHO/Michelson Doppler Imager (MDI) (from May 1996 to April 2011) and of SDO/HMI (from April 2010 to December 2016). We extracted the data number of the daily image data. The data number as the photospheric intensity was extracted in a line of one pixel width from northern to southern poles at the center of the equator. We selected a solar image at the same time (near 00UT) every day as the daily data. When we could not determine the solar image at the same time, we selected the solar image at near midnight. In this study, we analyze the photospheric intensity of 6,768 Å (SOHO) and 6,174-6,174 Å (SDO) and discard the wavelength term. We found the pixel values at the center and at the positions of 0.8, 0.85, and 0.9D (D: solar diameter), and calculated the daily coefficients of limb darkening as the ratio of I(θ)/I(0). Then, we analyze the solar cycle variation in the daily limb darkening coefficients.
3. RESULTS
Fig. 4 shows the daily limb darkening coefficient estimated by the photospheric intensity from solar images taken by SOHO and SDO during the period of May 1996–December 2016. Green, red, and blue dots indicate the daily coefficient at the size of 0.8, 0.85, and 0.9D, respectively. The value of the coefficient at 0.9D ranges from 0.6–0.7. This value is in agreement with the well-known value of solar limb darkening coefficient of about 0.6 (Ramanathan, 1954). Thus, we use the coefficient at the size of 0.9D in this study. The strong seasonal variation appears in the daily coefficient estimated by the photospheric intensity from solar images taken by SOHO. The seasonal variation arises from the change in distance between the Sun and the Earth due to the orbit of the Earth. In particular, the seasonal variation is noticeable in the limb. The coefficient estimated from SDO images does not show seasonal variation. This issue is discussed in Fig. 5.
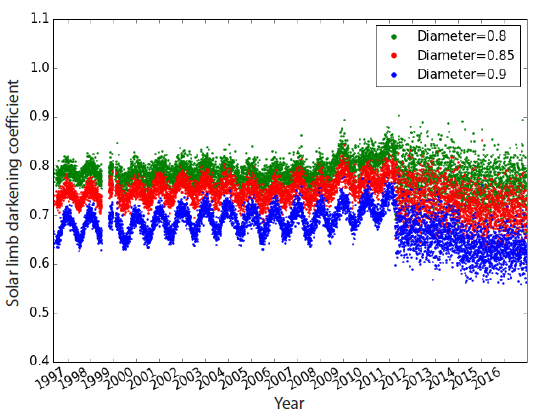
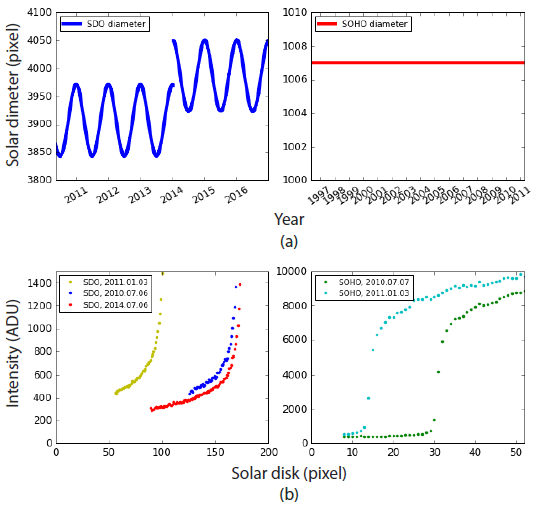
Fig. 5 shows the seasonal variation of solar diameter Fig. 5(a) and photospheric intensity Fig. 5(b) from the solar images taken by SOHO and SDO. The left panel is from SDO and right panel is from SOHO. In the top panel of Fig. 5, SOHO shows the same limb of the 1,007th pixel, which records the intensity. That is, the solar diameter is the same in the solar images taken by SOHO.
However, SDO exhibits seasonal variation in limb and solar diameter. This variation becomes a maximum at perihelion and minimum at aphelion. In the bottom panel of Fig. 5, the pixel that records the photospheric intensity is different with respect to time, i.e., perihelion and aphelion, as exhibited by solar images taken by SDO. However, the pixel is the same with respect to time as exhibited by solar images taken by SOHO. Consequently, seasonal variation appears only in the daily coefficients estimated from solar images taken by SOHO.
As shown in Fig. 5, the daily coefficient estimated from the solar images taken by SOHO should be corrected for the seasonal variation. Fig. 6 shows the corrected daily limb darkening coefficient estimated from solar images taken by SOHO. The display of Fig. 6 is the same as that of Fig. 4. Since the photospheric intensity at the limb shows a strong seasonal variation due to the variation in the Sun-Earth distance, we applied a geometrical correction to the actual solar distance for any specific time during the year. The seasonal variation disappeared in the daily coefficient at the size of 0.9D in Fig. 6.
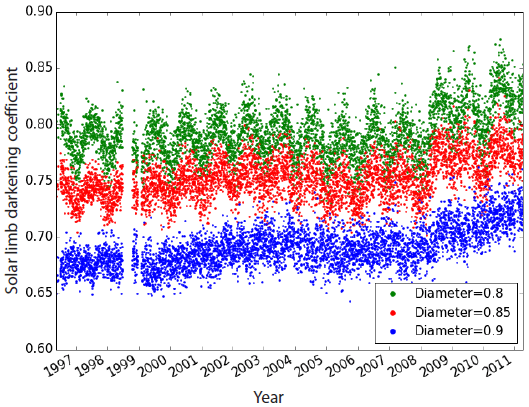
Fig. 7 shows the daily intensities at the center and limb with the daily limb darkening coefficient estimated from solar images taken by SOHO Fig. 7(a) and SDO Fig. 7(b). Red and black lines indicate the daily photospheric intensities at center and limb. The cyan dots and bold blue lines indicate the daily and monthly limb darkening coefficients at the size of 0.9D, respectively. In the top panel of Fig. 7, the photospheric intensity at the limb and the limb darkening coefficient estimated from the solar images taken by SOHO are corrected for seasonal variation. The limb darkening coefficient increased due to an increase in photospheric intensity at the limb rather than at the center since 2008. In the bottom panel of Fig. 7, the limb darkening coefficient estimated from the solar images taken by SDO maintains a consistent value due to the same trends in photospheric intensities both at the center and at the limb. The limb darkening coefficient shows a decrease due to the decrease in photospheric intensity at the limb since 2014. This decrease may be related to the increase in solar diameter in the solar image due to the changes in the orbit of SDO.
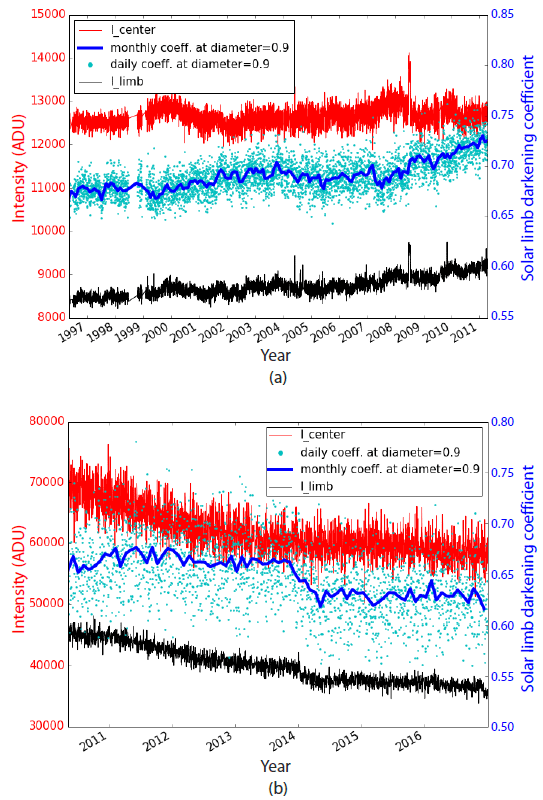
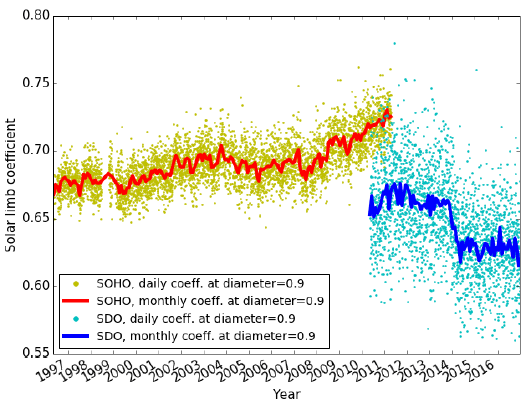
Fig. 8 summarizes the limb darkening coefficient from Fig. 7. Fig. 8 shows the daily and monthly limb darkening coefficients at 0.9D. Olive dots and red lines indicate the daily and monthly limb darkening coefficients estimated from the solar images taken by SOHO, and the cyan dots and blue lines indicate the daily and monthly limb darkening coefficients estimated from solar images taken by SDO. The limb darkening coefficient estimated from SOHO shows a slight increase at the solar maximum of solar cycle 23 and a significant increase at solar minimum since 2008. The limb darkening coefficient by SOHO shows a gradual increase in the range of 0.65–0.70 during the period of 1996–2011. On the other hand, the limb darkening coefficient estimated from SDO shows a constant value of about 0.65 and a sharp decrease due to the change in the orbit of SDO since 2014. The average of limb darkening coefficient at 0.9D is 0.691 (by SOHO) and 0.648 (SDO). The gradual increase in the limb darkening coefficient may result from the reduced sunspot number and solar magnetic field strength as the solar activity weakened. However, the rapid decrease in the limb darkening coefficient may due to the aging effect of CCD.
4. SUMMARY
We calculated the daily limb darkening coefficient esti-mated by the photospheric intensity from the solar images taken by SOHO and SDO during the period of May 1996 – December 2016.
The limb darkening coefficient estimated from solar images taken by SOHO and SDO is similar to the well-known solar limb darkening coefficient at 0.9D. The averaged value of the coefficient is about 0.69.
The limb darkening coefficient estimated from SOHO shows a temporal increase at solar maximum and a gradual increase since the solar minimum of 2008. The limb darkening coefficient estimated from SDO shows a consistent value and a decreasing trend since 2014.
The limb darkening coefficient shows an increasing trend since 2008 (SOHO) and a decreasing trend since 2014 (SDO). The increase in the former case is caused by an increase in the photospheric intensity due to weakened solar activity, and a decrease in the latter case results from the aging effect of CCD and the difference in the configuration of satellites.
