1 INTRODUCTION
Both the apparent stellar movement on the celestial sphere and many of the seasonal and daily changes on the Earth are related with the two fundamental rotations of the Earth: annual orbital rotation around the Sun and its spin rotation. Aside from its conical precession with an approximately 26,000 yr period, the Earth’s spin rotation may be regarded as virtually invariable for most common applications. However, at close observation, the Earth’s orientation does change in complicated ways (Dehant & Mathews 2009; Gross 2009). Different periodic components of nutation exist with amplitudes of a few arcsec (18.6 yr period) and a few hundred milliarcsec (half year or fortnightly periods) down to submilliarcsec (other periods), while the position of the Earth’s pole on its surface also varies ceaselessly. Since the 1980s, global geodetic measurements have become more accurate than ever with the aid of worldwide implementations of space geodesy - VLBI, GNSS, SLR, and DORIS (McCarthy & Seidelmann 2009). At present, numerous other types of Earth/space observations are being carried out worldwide. The International Earth Rotation and Reference Frame System (IERS) has been supporting the retrieval of the Earth orientation parameter (EOP) and defining the Terrestrial/ Celestial reference frames (Petit & Luzum 2010).
The European Centre for Medium-Range Weather Forecasts (ECMWF) has been gathering vast amounts of data about the atmospheric state and supporting related output datasets. For this study, datasets of 6 hr interval global atmospheric pressure and wind velocity since 1980 have been obtained from the ECMWF website. Since the usage of quartz/atomic clocks in the 1950s, the seasonal variation of length-of-day (l.o.d.) was clearly observed, and this perturbation was later ascribed to annual periodic changes in the global atmospheric circulation (Munk & MacDonald 1960). This seasonal pattern of the Earth spin rate change as well as the seasonal pole position change are checked in this study via comparison of (i) the observed Earth rotation excitation inferred from the IERS dataset and (ii) the calculated atmospheric excitation obtained from ECMWF data of atmospheric state.
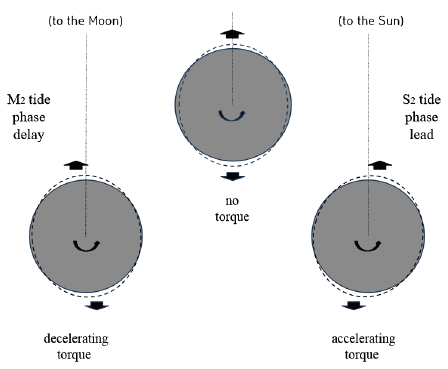
One of the longstanding questions of scientific interest is the secular deceleration/acceleration of the Earth’s spin rotation (Munk & MacDonald 1960; Lambeck 1980). Tidal interactions in the Earth-Moon-Sun system have been known to be the key mechanism. Associated phenomena, such as lunar orbital retardation and the change in the Earth-Moon distance have been investigated. Munk & MacDonald (1960) early pointed out that the atmospheric solar semi-diurnal S2 tide constantly accelerates the Earth’s spin rotation due to its phase lead - i.e., the maximum atmospheric pressure occurs at around 10 a.m. local time across the globe (see Fig. 1), and they estimated the associated solar (atmospheric) energy input into Earth’s spin as 2.2×10¹¹ W. We hereby repeat the same calculation with a new updated atmospheric tide model, including one correction of theoretical error in their work.
The Earth’s average pole, which is time averaged position of the Earth’s spin angular velocity on its surface, should coincide with the principal axis of the Earth. Various geophysical processes in the atmosphere/hydrosphere as well as inside of the Earth cause changes in the Earth’s rotational state. If a certain change in the mass distribution of the Earth were to occur, the pole would migrate accordingly. There have been estimates about the linear trend of the pole drift with magnitudes ranging of 3.0 - 4.1 milliarcsec/yr (mas/yr) and direction 75° - 85° W. Gross (2009) compiled different estimates, and took 3.51 mas/yr and 79.2° W as the most representative values for the pole drift during the time span between 1900 and 1990. This has been often referred as the ‘polar wander’ and mainly ascribed to the Earth’s viscoelastic relaxation after the Pleistocene deglaciation (e.g., Nakiboglu & Lambeck 1980), known as the ‘glacial isostatic adjustment’ or ‘post glacial rebound’. Recently, it has been pointed by Mitrovica & Wahr (2011) and Harada (2012) that the polar wander associated with the glacial isostatic adjustment of thousand years time scale should be less than previous estimates not considering the Earth’s fossil bulge.
From the recent thirty-year polar motion data, an Eastward directional change of greater than five degrees has been reported (Chen et al. 2012; Na et al. 2012), and some have postulated that this change may have been induced by the recent worldwide intensification of glacier melting (Chen et al. 2013; Na et al. 2013). From a comparison of the observed polar motion with the Earth’s gravity harmonic coefficients, on the basis of Gravity Recovery And Climate Experiment (GRACE) data, Chen et al. (2013) asserted that 90 % of the abrupt change of the average pole position is caused by accelerated melting of glaciers throughout the globe.
Measurements and analysis have been conducted regarding the glacier melting and the resultant sea level rise (e.g., Fairbanks 1989; Shepherd et al. 2012). The U.S. National Snow & Ice Data Center (NSIDC) compiles studies of glaciers and other frozen areas and continues to produce their reports and datasets. The World Glacier Monitoring Service (WGMS) compiles related datasets as well. The sea level rise by ice melting is a serious concern, however, we hereby focus on an additional effect; the alteration of Earth’s pole and its spin rate.
There have been previous estimates of change in Earth’s rotation due to glacier melting (Gasperini et al. 1986; Trupin 1993; Johnston & Lambeck 1999). Glacier melting is a much slower process than the normal mode periods of the Earth, and it is presumed in this study that the redistribution of melt water causes only negligible momentum. As noted above, the polar wander has been caused by the glacial isostatic adjustment for centuries. Thus some viscoelastic response of the Earth to the recent fast surface unloading is expected in the long-term. However, its relaxation time is on the order of a few thousand years, so the viscoelastic unloading effect associated with the recent rapid glacier melting should be small and not yet discernable in pole drift observation.
2 THEORY OUTLINE OF PERTURBATION IN THE EARTH’S SPIN ROTATION
Perturbations in the Earth’s spin rotation are quite small, thus in its investigation, a first-order approximation is adequate in most circumstances (Eubanks 1993; Wahr 2005; Gross 2009). The Earth’s angular velocity can be written as(1)
where m = (m1, m2, m3) is the small change in the Earth’s spin angular velocity. And the Earth’s spin angular momentum L can be written as(2)
where C are A the Earth’s principal moments of inertia, and ΔIij and h are the small changes in the Earth’s inertia tensor and the angular momentum associated with the atmospheric/hydrologic (or other interior) motion of the Earth. After imposing the angular momentum conservation, we acquire the following equations(3a)(3b)
where the Chandler wobble frequency is defined as . The excitation function is defined as follows.(4a)(4b)
Formerly, polar motion was regarded as the same as
Given the polar motion data, the excitation function can be derived by using Eq. (5) through Fourier transform and its inverse transform. The excitation function acquired by such procedure is called ‘observed excitation’ or ‘geodetic excitation’ (sometimes also called ‘astronomic excitation’).
Excitation function associated with the atmospheric pressure distribution can be evaluated as(6a)(6b)(6c)
where Δp/g represents local excessive air mass. Excitation function associated with the global wind distribution can be evaluated as(7a)(7b)(7c)
where (u, v) are the eastward and northward components of wind velocity.
The amount of the Earth’s acceleration due to the atmospheric semi-diurnal S2 tide can be evaluated as follows. First, the solar semi-diurnal tidal potential is given as (Melchior 1983):(8)
where G, MS, rS, a are the gravitational constant, the mass of the Sun, the Earth-Sun distance, and the Earth’s radius. For simplicity, it may be assumed that ϕS = 0 without loss of generality. Then, the local eastward component of solar tidal force f can be written as(9)
The resultant tidal torque accelerating the Earth’s spin is given as(10)
And the corresponding energy input into the Earth’s spin is given as .
The Earth’s spin rotation excitation due to glacier mass change can be evaluated similarly as the atmospheric excitation; however, in this case, the mass term only is evaluated, ignoring the slow and almost quasi-static motion of melt water. The melt water is further assumed to be distributed uniformly on the globe.(11a)(11b)(11c)
3 DATASETS AND MODELS OF EOP, ATMOSPHERIC STATE, AND GLACIER MELTING
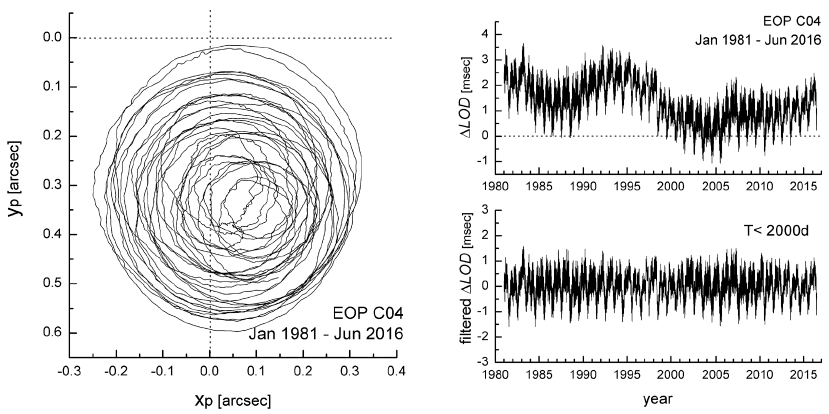
A daily basis Earth’s spin rotational time series data by the name of EOP 08 C04 (Bizouard & Gambis 2009) was obtained from the IERS website for this study (http://www.iers.org/ IERS/EN/IERSHome/). The EOP C04 dataset is composed of the pole position (xp, yp) and the spin change in terms of excessive amount of length of day (Δl.o.d.). In Fig. 2 the locus of the Earth’s pole is illustrated with respect to the Earth’s Reference Pole, which is the nominal geographic pole. The Earth’s present spinning rate is about 7.292115×10⁻⁵. The Earth’s spin angular velocity is often inversely expressed as length of day. The Δl.o.d. time series for the same time span is illustrated as well in the right panel of Fig. 2. The lower graph shows the high-pass filtered Δl.o.d. time series devoid of long period components.
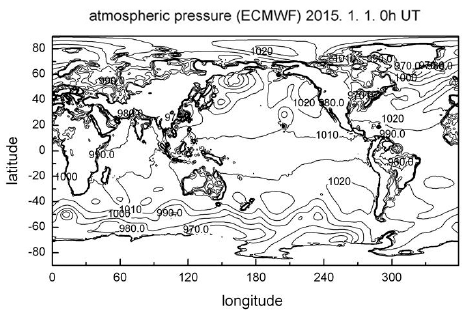
ECMWF datasets for global atmospheric pressure and wind velocity for the time span between Jan 1981 and Dec 2015 were extracted and processed to derive the atmospheric excitation function (http://www.ecmwf.int). Two contributions from: i) excessive mass (pressure) and ii) motion (wind) were evaluated separately, and then summed together resulting the total atmospheric excitation functions (χ1, χ2, χ3) to be compared with the observed excitation inferred from polar motion data. In Fig. 3, the global distribution of atmospheric pressure at one epoch (00h Jan 1st of 2015) is given.
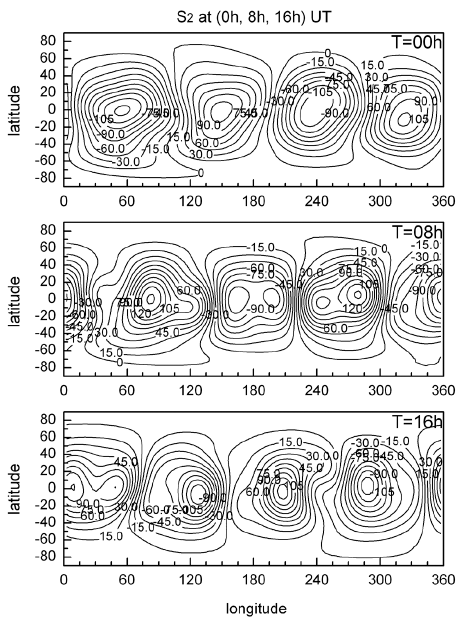
Ray & Ponte (2003) compiled pre-existing models and various datasets about the atmospheric solar semi-diurnal S2 tide to determine their model being composed of spherical harmonics up to degree n=7. This model has become widely accepted and in use for representing atmospheric S2 and S1 tides. The atmospheric pressure based on their S2 tide model is described with interval of 8 hr in Fig. 4.
Reports from NSIDC (https://nsidc.org/) and certain journal articles (Shepherd et al. 2012) were indispensible source of information about the mass changes of glaciers over the world. In this study, only the ten world largest glaciers were considered. These ten glaciers can be classified according to their location as follows: Greenland, West Antarctica, East Antarctica-1, East Antarctica-2, Arctic, High Mountain Asia, Alaska, North West America, Patagonia, Europe (Alps). The rates of glacier mass changes in units of 1014 kg/yr at those ten locations are listed in Table 1 along with the corresponding values of the Earth’s spin rotational perturbations caused by each mass change. In fact, the Arctic glacier is composed of five glaciers (hundreds of kilometers apart), which were separately treated in the calculation, although only the total contribution is listed. Two separate ones (north and south) compose the Patagonia glacier.
4 RESULTS AND DISCUSSION
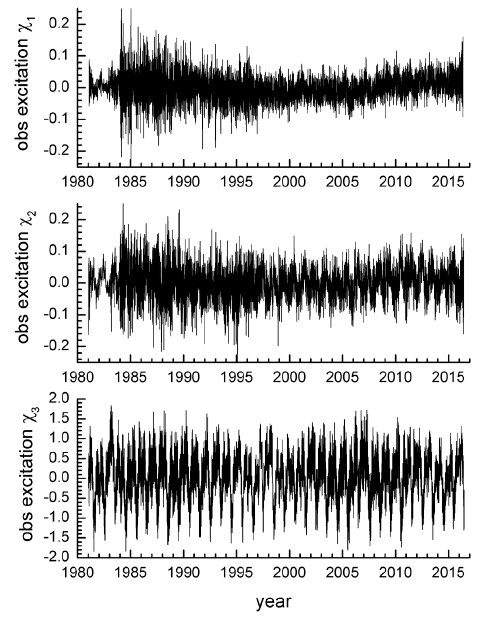
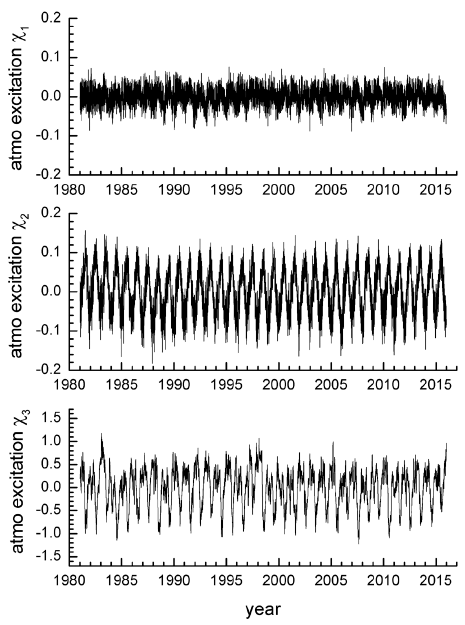
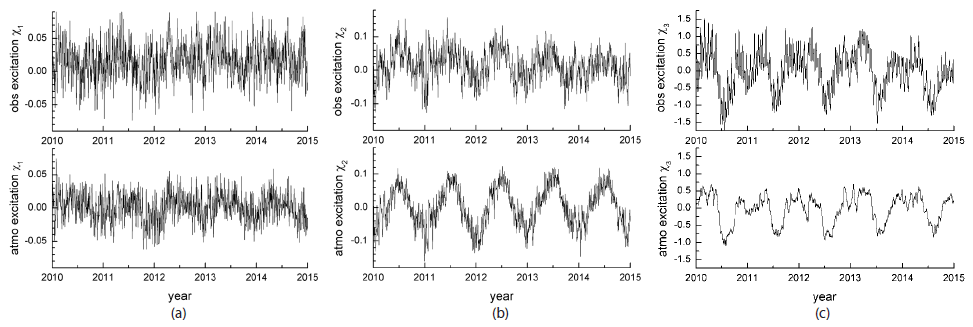
From the polar motion and l.o.d. time series of EOP C04, the observed excitation functions were computed by using Eq. (5), and they are illustrated in Fig. 5. The atmospheric excitation functions acquired from ECMWF data by using Eqs. (6) and (7) are shown in Fig. 6. To better compare the two kinds of excitation functions, those parts of five year time span (2010-2015) are shown again on three separate figures (Figs. 7(a)-7(c)). In all these three comparisons (a-c), similarities between the observed excitation and the calculated atmospheric excitation are noticeable. The dominance and similarity of atmospheric excitation exist particularly in the l.o.d. change, i.e., χ3. The correlation between the observed and atmospheric excitation functions defined as are 0.575, 0.719, and 0.792 respectively for the each three components during the five year time span. From the excitation function shown in Fig. 7(c), it is found that l.o.d. is shorter by about -0.65 millisec in late June - early September and longer by +0.65 millisec from winter to spring time. Differences between the observed and calculated excitation functions can be briefly summarized as follows. Seasonal variations are not quite clear in the two (observed and atmospheric) excitation time series of χ1, while one-year periodicity is distinct in both sets of χ2 and χ3. The amplitude of atmospheric excitation slightly exceeds that of observed one. Correlation of observed and atmospheric excitation is best for χ3; however, high frequency terms are much reduced in the atmospheric excitation . The conspicuous monthly variations in the observed excitation amount up to ±0.30 millisec variation of l.o.d. And these should be ascribed to the oceanic and bodily tides (spectral analysis clearly confirmed the existence of the fortnightly and monthly periodicities in ). The seasonal variation in the atmospheric excitation shows excellent phase match with , but smaller amplitude; ±0.52 millisec. Provided with estimates of other contributions, such as ocean tides and Earth’s interior processes, which are beyond the scope of this study, the difference between the observed and calculated excitation functions will decrease and eventually disappear.
In this study, the atmospheric torque to accelerate the Earth’s spin rotation is estimated as τ = 2.223×10¹⁵ Nm. And its corresponding energy input is estimated as 1.621×10¹¹ W. Based on the Earth-Moon distance increasing rate 3.8 cm/yr, which was derived from the lunar laser ranging measurements (Dickey et al. 1994; Chapront et al. 2002), the Earth’s spin energy decrease and the tidal energy dissipation were estimated as 3.54×10¹² W and 3.42×10¹² W (Na & Lee 2014). Since these estimations had been made without considering the atmospheric tide, we hereby state that the tidal energy dissipation in the ocean and mantle should be re-estimated as 3.58×10¹² W. To the best of our knowledge, this clarification was not included in any previous studies. Also, we are certain that Munk & MacDonald (1960) had missed one necessary Earth tidal deformation factor of about 0.69 (1+k-h : a combination of Love numbers) in their derivation, so that their estimate of atmospheric energy input overshot accordingly as 2.2×10¹¹ W. In fact, the formula for the atmospheric S2 tidal pressure distribution used by them was also slightly different from the Ray and Ponte’s model; however, that model difference is not large - particularly the phase lead values are virtually identical (68° and 67.9°).
When viewed from above the North pole (Fig. 2), aside from the almost linear drift due to the glacial isostatic adjustment (GIA), the polar motion is mainly composed of the two counterclockwise rotational motions - Chandler wobble and annual wobble, of which periods are about 433 and 365 days. After removal of the two major wobble motions and other minor periodic signals by low-pass filtering in the frequency domain, the pole drift of long period components only (three cases; longer than 10, 15, 20 yr up to infinity) is repeatedly shown in Fig. 8. Another plot made from the same time series by excluding the constant pole drift associated with GIA is shown in Fig. 9.
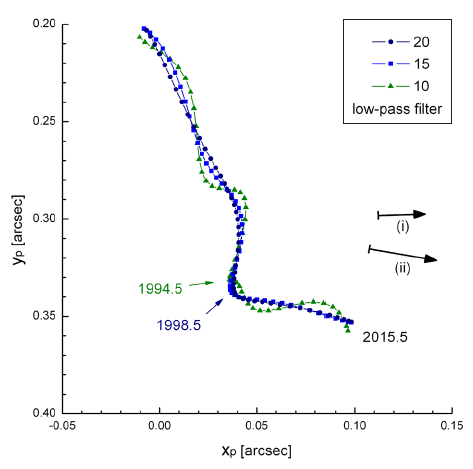
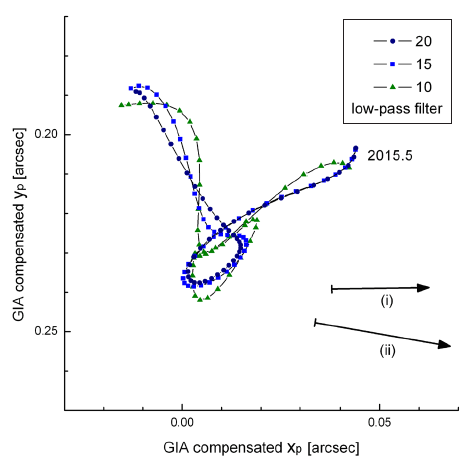
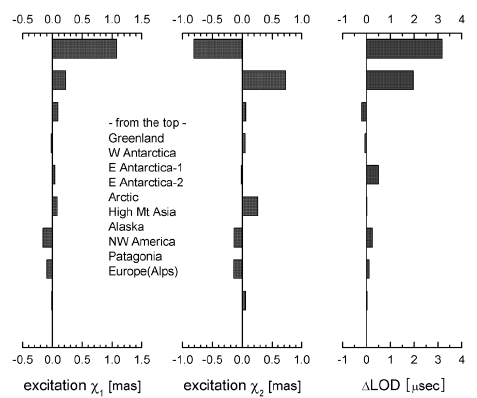
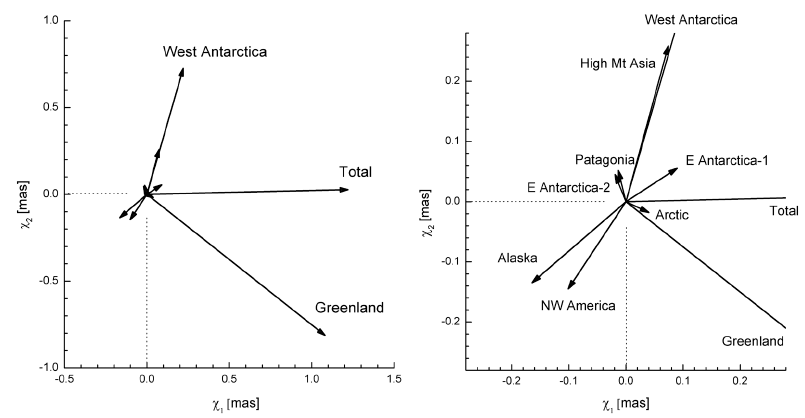
Based on the datasets of NSIDC and others, excitations of polar motion and l.o.d. due to the mass changes of the ten largest glaciers were calculated by the method described above, and the results are given in Table 1. The total polar motion excitation per year associated with the ten largest glacier mass changes is found as (χ1, χ2)=(1.221, 0.027) milliarcsec. The smaller arrows in Figs. 8 and 9 correspond to the twenty year accumulation of this total polar motion excitation. In fact, Shepherd also gave an alternative estimate of glacier mass changes in Greenland and Antarctica, and the corresponding polar motion excitation (per year) is found to be (χ1, χ2)=(1.746, -0.367) milliarcsec. The larger arrows in Figs. 8 and 9 indicate the twenty year accumulation of the latter estimate of the total polar motion excitation based on their renewed estimate. All the other figures are based on the combination of NSIDC data and Shepherd’s the former estimate of glacier mass changes as given in Table 1. The total amount of changes of l.o.d. in one year due to the mass changes of the ten largest glaciers is found to be +5.74 μsec(or +7.28 μsec for the renewed data) per year. The calculated polar motion excitation and l.o.d. change are illustrated as histograms in Fig. 10. Each calculated polar motion excitation values are again illustrated as arrows in the two-dimensional plots (Fig. 11); the perturbation due to every glacier and the total (left panel) and an enlarged version (right panel). The dominance of Earth’s spin rotation perturbation due to the mass changes in the two major ones - Greenland and West Antarctica - is quite evident in the illustrations (Figs. 10 and 11). A change of l.o.d. +5.74 μsec per year for twenty years is only +114.8 μsec; however, the corresponding accumulation of UT1 delay after the same time span (20 yr) amounts to 0.419 sec. Assuming the l.o.d. change per year is +7.28 μsec, then the corresponding l.o.d. change and accumulated UT1 delay in same twenty years would be +145.6 μsec and 0.532 sec respectively. These kinds of estimates on the Earth’s spin state change have never been reported. In addition, we state that the eastward pole drift, which started in the mid 1990s, suddenly became much weaker after 2013 (Figs. 8 and 9), and this slower pole drift quite possibly indicates a recent mitigation of the vigorous glacier melting.
5 CONCLUSIONS
It is confirmed that both the l.o.d. change and the drift of average pole during the last 35 yr have been dominated by atmospheric excitation. Such tendency is most conspicuous in the seasonal variation of the Earth’s spin angular velocity, as l.o.d. is shorter by -0.65 millisec in late June - early September and longer by +0.65 millisec from winter to spring (for the 5 yr period of 2010 - 2015). Since the seasonal variation of is slightly larger than that of , another source of seasonal excitation should exist in the opposite sense to explain the gap.
The Earth’s spin acceleration due to the atmospheric S2 tide is accurately re-estimated in this study. The exerting torque and energy input rate are estimated as 2.2×10¹⁵ Nm and 1.62×10¹¹ W respectively. Previous estimate of tidal dissipation in the ocean and mantle should be increased by this amount, while the estimate of the Earth’s spin rotational energy decrease remain unaffected by this additional consideration of the atmospheric tide.
Based on the direct calculation of the Earth’s inertia tensor change associated the glacier mass change, the unusual eastward drift of the Earth’s average pole since late 1990s is confirmed to be strongly affected by the huge amount of glacier melting, even though the two datasets do not show perfect match in our model. The calculated average polar motion excitation in each year during the last twenty years due to the glacier melting ranges from (χ1, χ2)=(1.221, 0.027) milliarcsec up to (χ1, χ2)=(1.746, -0.367) milliarcsec. The associated UT1 delay due to the twenty year glacier melting ranges between 0.419 and 0.532 sec. From the behavior of the average pole, it is certain that glacier melting has been temporarily weaker since 2013.